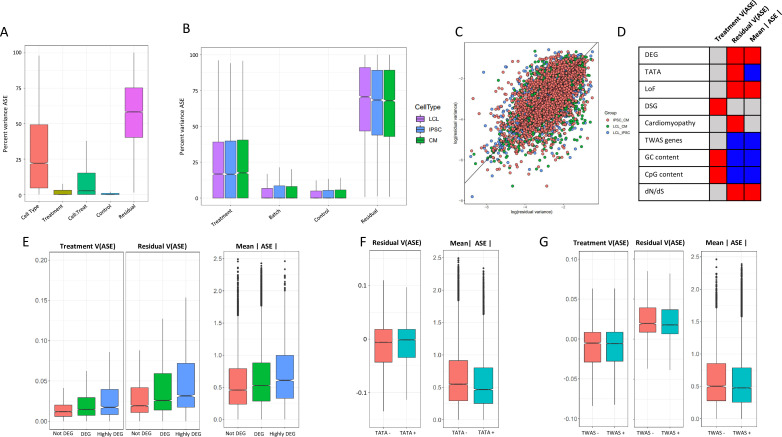
Figure 5. ASE residual variance (A) Variance partitioning of ASE across all cell types.
(B) Variance partitioning of ASE within each cell type separately. (C) ASE residual variance across cell types. For SNPs with ASE variance measured in more than one cell type in the cell-type-specific model, we have plotted the residual variance in each pair of cell types. (D) Relationships between eight gene annotations and treatment ASE variance, residual ASE variance, and mean absolute ASE. Red indicates that the annotation is positively correlated to ASE variance or absolute ASE, while blue indicates a negative correlation. Gray indicates no significant relationship. (E) Treatment variance, residual variance, and mean absolute ASE by DEG. We have separated genes into three categories: (1) Not DEG: Not differentially expressed in response to any treatment. (2) DEG: Differentially expressed with log2 fold change > 0.25 in at least one treatment but not greater than 0.75 in any treatment. (3) Highly DEG: Differentially expressed with log2 fold change > 0.75 in at least one treatment. Each gene can only be in one category. (F) Residual ASE variance and mean absolute ASE for genes with or without a TATA box in the promoter. (G) Treatment variance, residual variance, and mean absolute ASE for genes significant or not significant by TWAS.


