

Abstract
Objective:
For children hospitalized with acute traumatic brain injury (TBI), to use post-discharge insurance claims to identify: 1) health care utilization patterns representative of functional outcome phenotypes and 2) patient and hospitalization characteristics that predict outcome phenotype.
Setting:
Two pediatric trauma centers and a state-level insurance claim aggregator.
Patients:
289 children who survived a hospitalization after TBI between 2009 and 2014, were in the hospital trauma registry, and had post-discharge insurance eligibility.
Design:
Retrospective cohort study.
Main Measures:
Unsupervised machine learning to identify phenotypes based on post-discharge insurance claims. Regression analyses to identify predictors of phenotype.
Results:
Median age 5 years (interquartile range 2-12), 29% (84/289) female. TBI severity: 30% severe, 14% moderate, and 60% mild. We identified 4 functional outcome phenotypes. Phenotypes 3 and 4 were the highest utilizers of resources. Morbidity burden was highest during the first 4 post-discharge months and subsequently decreased in all domains except respiratory. Severity and mechanism of injury, intracranial pressure monitor placement, seizures, and hospital and intensive care unit lengths of stay were phenotype predictors.
Conclusions:
Unsupervised machine learning identified post-discharge phenotypes at high risk for morbidities. Most phenotype predictors are available early in the hospitalization and can be used for prognostic enrichment of clinical trials targeting mitigation or treatment of domain-specific morbidities.
Keywords: pediatric, wounds and injury, critical care, brain injuries, traumatic, critical care outcomes, patient outcome assessment
Introduction
Pediatric traumatic brain injury (TBI) results in 35,000 hospitalizations in the United States annually. [1] More than 95% of children hospitalized with TBI survive, although often with significant cognitive, physical, mental health, and health-related quality of life impairments. [2–7] These functional deficits require significant and sustained attention from the child’s caregivers and medical providers.
Functional impairments after discharge are a primary concern for caregivers of a child who sustained a TBI. [8] Although predictors of poor outcome have been identified (e.g. low Glasgow Coma Scale (GCS), cardiac arrest, injury mechanism, intracranial pressure (ICP)), clinicians lack the ability to accurately prognosticate post-discharge health care needs early in the hospital course. [9–14] Improved ability to forecast the likely functional outcome and post-discharge health care needs could allow for more appropriate expectations and discharge preparation for providers and families during the acute injury phase. Additionally, post-discharge phenotypes and their predictors will serve as a guide for interventional trials explicitly targeting morbidities in high-risk patients.
Systematic evaluation of post-discharge functional outcomes and health care needs in a large population of children who survive TBI is challenging due to fragmented healthcare databases and delivery systems, subjectivity and time-intensive measures of functional status and variability across age groups, and costliness of prospective longitudinal studies. [15 16] To overcome these challenges, we identified a cohort of children who survived a hospitalization for TBI and used probabilistic linkage to connect their electronic health record (EHR) and trauma registry data to post-discharge insurance claims. We used K-medoids clustering, an unsupervised machine learning technique, to identify novel claims-based outcome phenotypes reflective of functional status after discharge. K-medoids clustering is used to identify natural clusters (in our study, phenotypes) in heterogenous datasets (in our study, cohorts) by searching for patterns among input variables (in our study, insurance claims) without reliance on the structure of an outcome variable. [17 18] It harnesses the large volume of data available in insurance claims to identify clusters using a data-driven approach, which is less vulnerable to investigator biases than, for example, reporting outcomes of cohort subgroups defined by investigator-selected variables. Additionally, we identified patient and hospitalization factors predictive of phenotype membership using regression analyses.
Materials and Methods
Subjects
Children were included if they survived a hospitalization for acute TBI at Denver Health (DH) or Children’s Hospital Colorado (CHCO) between 2009 and 2014, were < 18 years-old at admission, were included in the hospital trauma registry, and had post-discharge insurance eligibility in the Colorado All Payer Claims Database (APCD). Both CHCO and DH are level 1 pediatric trauma centers in an urban setting that serve a large metropolitan region. The APCD includes insurance claims data with mandated reporting from commercial, Medicaid, Medicare Advantage and Medicare Fee for service and voluntary reporting from self-insured employer-based plans. This database includes claims data for approximately 70% of Colorado’s insured population. [19]
We used Markov chain Monte Carlo-augmented probabilistic linkage based on block and match variables (age, sex, admission date, date of birth, treatment hospital, and principal diagnosis) to link EHR and trauma registry data with claims data. [20 21] (Figure 1) Trauma registry data were extracted from each hospital’s trauma registry, which are maintained to support submission to the National Trauma Data Bank. Probabilistic linkage was performed using LinkSolv (Strategic Matching, Inc., Morrisonville, NY). This approach has been shown to have specificity and positive predictive values > 98% for children with severe TBI. [20] The study received a waiver of consent and authorization from the Institutional Review Board.
Figure 1. Summary of methods.
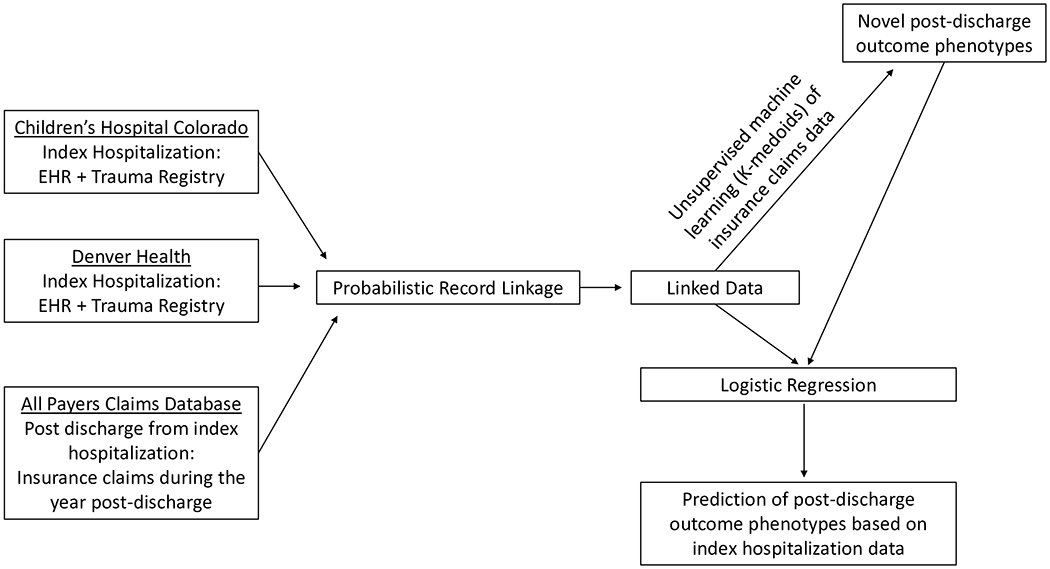
We used deterministic linkage of the electronic health record (EHR) and each hospital’s trauma registry to identify the study cohort and probabilistic linkage to identify the patients within the All Payers Claims Database.
Post-Discharge Health Care Utilization (Input Variables to Clustering Process)
We applied k-medoids clustering to insurance claims data for up to one year after discharge to identify functional outcome phenotypes. The one-year duration captures the period after which most patients’ recovery plateaus and avoids introduction of new medical conditions. [22] For subjects transferred to inpatient rehabilitation, the post-discharge time period began after their rehabilitation stay. Input variables included hospital readmissions, urgent care/Emergency Department (ED) visits, outpatient visits, transport claims, outpatient therapy (speech and physical therapy), durable medical equipment (DME), and all medication prescriptions filled regardless of duration, frequency or indication. We categorized DME codes based on the following categories: respiratory, tracheostomy, mobility, therapy, feeding/communication, urinary catheter, and infusion/access. (Supplemental Digital Content Table 1) Medications were categorized based on Anatomical Therapeutic Chemical (ATC) level 3 categories and further grouped for analysis. [23] (Supplemental Digital Content Table 2) We used Current Procedural Terminology (CPT) codes to classify therapy-related encounters and claim characteristics (e.g. place of service) to classify visit type (e.g. hospitalization). Although interventions could be used in the treatment of several domains, claims were grouped to identify morbidity types including feeding/communication (gastrointestinal medications, speech therapy claims, and feeding/communication DME), respiratory (pulmonary medications, tracheostomy and respiratory DME), mobility (physical therapy claims, mobility and therapy DME), and neurologic (neurologic medications). (Supplemental Digital Content Tables 1 and 2).
Candidate Predictors of Phenotype Membership
We evaluated the variables shown in Supplemental Digital Content Table 3 as predictors of phenotype membership. Broadly, these included patient and admission characteristics, hospitalization care (e.g. duration of ventilator support, neurosurgical interventions), and events (e.g. cardiac arrest, seizures) extracted from the hospital trauma registry. We used established International Classification of Diseases (ICD)-based codesets to identify mild-complicated TBI and cardiac arrest and validated computable phenotypes to identify ICP monitoring, craniotomy/craniectomy, and seizures. [24 25] Missing GCS and injury severity score (ISS) values were assumed to be 15 and 1, respectively.
Clustering Methods
We employed k-medoids clustering (partitioning around medoid algorithm) to generate the outcome phenotypes. To adjust for imbalance in eligibility, we divided each use metric by the number of eligible months during the year post-discharge. Cluster membership was determined by minimizing the dissimilarities (Gower dissimilarity metric) between the individuals assigned to each cluster. [26] K-medoids is robust to noise and outliers because it minimizes distances between medoids, defined as the most centrally located point in a cluster, rather than means. [27 28] Like most clustering algorithms, k-medoids requires that the user specify the number of clusters. We selected the optimal number of clusters using the NbClust algorithm which employs the silhouette width comprised of a dissimilarity metric evaluating members within the same cluster and a dissimilarity metric between clusters. [28] Then, we selected the cluster number with an appropriate spread of patients to allow for separation of phenotypes.
Phenotype Membership Prediction
We used the LASSO method to build a multinomial logistic regression model to identify index hospitalization variables predictive of phenotype membership. [29 30] (Supplemental Digital Content Table 3) We selected and internally validated the optimal model using 10-fold cross-validation with model deviance as the overall performance metric. Selected variables were used in separate logistic regression models for each cluster for inference. Due to small sample sizes, we employed the Firth adjustment, a penalized regression method that corrects for small sample bias in maximum likelihood estimates, and calculated likelihood ratio confidence intervals. [29 31] We calculated area under the receiver operating curve (AUROC) using Firth’s logistic regression with intercept correction (FLIC) method to adjust for bias in the intercept due to the Firth small sample adjustment. [32] Significance of univariable associations between phenotype and categorical variables was assessed using Fisher’s exact test and the Wilcoxon-Mann-Whitney test was used for continuous variables. Statistical analysis was performed using R version 3.5.3 (R Foundation (Vienna), 2019-03-11).
Results
Cohort Characteristics
Of 658 hospitalized children, 324 (49%) linked to records in the APCD. All linkages were strong (estimated match probability ≥99%). Of the 324 linked patients, 295 survived (91%), 289 of whom had post-discharge insurance eligibility in the APCD. (Supplemental Digital Content Figure 1) APCD linkage rates were 46% at CHCO and 56% at DH and 84% for patients with government insurance and 15% for commercial insurance. (Supplemental Digital Content Table 4) The matched and unmatched patients differed by age with the matched cohort being younger (median 4.9 [interquartile range (IQR) 1.6- 12.0] versus 9.5 [IQR 3.9-14.3] years, p<0.001) and more likely to have inflicted injury (21% versus 8%, p<0.001). These cohorts did not differ based on ED GCS, ISS, number of body regions severely injured, hospital or ICU lengths of stay, frequency of seizure diagnosis or ICP monitor placement.
In the cohort of 289 linked survivors, median age was 5 years (IQR 2-12) and 205 (71%) were male. (Table 1) Seventy-nine (27%) had severe TBI (ED GCS 3-8), 37 (13%) moderate (ED GCS 9-12), 36 (13%) mild-complicated (ED GCS 13-15 with abnormal head imaging), and 137 (47%) mild TBI (ED GCS 13-15 without abnormal head imaging). [24] The most frequent mechanism of injury was motor vehicle crash (37%) followed by fall (25%) then inflicted injury (16%). Thirty-five (12%) subjects had a craniectomy or craniotomy and 43 (15%) had an ICP monitor placed. During the hospitalization, 59 (20%) patients were diagnosed with seizures. The median ICU and hospital lengths of stay were 1 [IQR 0-3] and 4 [IQR 2-11] days, respectively. In those with inpatient therapy data available (CHCO cohort), physical, occupational, and speech therapy (PT, OT, SLP) were involved in 55%, 50%, and 44% of patients, respectively.
Table 1.
Index Hospitalization Characteristics.
| Index Hospitalization Characteristic | Total cohort (n=289) | Phenotypes | |||
|---|---|---|---|---|---|
| 1 (n=118) | 2 (n=117) | 3 (n=45) | 4 (n=9) | ||
| Male, n (%) | 205 (70.9) | 79 (66.9) | 83 (70.9) | 35 (77.8) | 8 (88.9) |
| Age (year), median (IQR) | 5.3 (2.2, 12.4) | 5.5 (3, 11.6) | 5.4 (1.5, 13.2) | 4.3 (0.3, 12.5) | 0.4 (0.2, 0.7) |
| Insurance, n (%) | |||||
| Government | 240 (83) | 99 (83.9) | 95 (81.2) | 37 (82.2) | 9 (100) |
| Commercial | 47 (16.3) | 18 (15.3) | 22 (18.8) | 7 (15.6) | 0 (0) |
| Other | 2 (0.7) | 1 (0.8) | 0 (0) | 1 (2.2) | 0 (0) |
| Hospital, n (%) | |||||
| Children’s Hospital Colorado | 169 (58.5) | 57 (48.3) | 67 (57.3) | 38 (84.4) | 7 (77.8) |
| Denver Health | 120 (41.5) | 61 (51.7) | 50 (42.7) | 7 (15.6) | 2 (22.2) |
| Admit Year, n (%) | |||||
| 2009 | 50 (17.3) | 18 (15.3) | 21 (17.9) | 10 (22.2) | 1 (11.1) |
| 2010 | 49 (17) | 16 (13.6) | 26 (22.2) | 5 (11.1) | 2 (22.2) |
| 2011 | 52 (18) | 29 (24.6) | 16 (13.7) | 7 (15.6) | 0 (0) |
| 2012 | 53 (18.3) | 22 (18.6) | 22 (18.8) | 8 (17.8) | 1 (11.1) |
| 2013 | 42 (14.5) | 19 (16.1) | 14 (12) | 6 (13.3) | 3 (33.3) |
| 2014 | 43 (14.9) | 14 (11.9) | 18 (15.4) | 9 (20) | 2 (22.2) |
| Injury Mechanism, n (%) | |||||
| Motor Vehicle Crash | 108 (37.4) | 43 (36.4) | 47 (40.2) | 18 (40) | 0 (0) |
| Fall | 71 (24.6) | 32 (27.1) | 31 (26.5) | 7 (15.6) | 1 (11.1) |
| Inflicted | 46 (15.9) | 9 (7.6) | 15 (12.8) | 16 (35.6) | 6 (66.7) |
| Bicycle | 14 (4.8) | 11 (9.3) | 3 (2.6) | 0 (0) | 0 (0) |
| Other | 50 (17.3) | 23 (19.5) | 21 (17.9) | 4 (8.9) | 2 (22.2) |
| TBI severity, n (%)a, b | |||||
| Severe | 79 (27.3) | 21 (17.8) | 30 (25.6) | 23 (51.1) | 5 (55.6) |
| Moderate | 37 (12.8) | 14 (11.9) | 17 (14.5) | 5 (11.1) | 1 (11.1) |
| Mild-complicated | 36 (12.5) | 12 (10.2) | 15 (12.8) | 7 (15.6) | 2 (22.2) |
| Mild | 137 (47.4) | 71 (60.2) | 55 (47) | 10 (22.2) | 1 (11.1) |
| Injury Scoresa | |||||
| Injury Severity Score, median (IQR) | 17 (9, 24) | 13.5 (9, 20.8) | 16 (10, 22) | 24 (16, 34) | 17 (16, 27) |
| Number of regions Abbreviated Injury Score > 0, n (%) | 2 (2, 3) | 2 (2, 3) | 2 (2, 3) | 3 (2, 4) | 3 (2, 4) |
| Number of regions Abbreviated Injury Score > 2, n (%) | 1 (1, 2) | 1 (1, 2) | 1 (1, 2) | 2 (1, 3) | 1 (1, 3) |
| Hospital Course | |||||
| Hospital LOS, median (IQR) | 4 (2, 11) | 3 (1, 5) | 4 (2, 8) | 21 (11, 49) | 51 (31, 54) |
| Duration of Mechanical Ventilation, median (IQR) | 0 (0, 3) | 0 (0, 1) | 0 (0, 2) | 5 (1, 10) | 11 (1, 13) |
| Intensive Care Unit LOS, median (IQR) | 1 (0, 3) | 1 (0, 1) | 1 (0, 2) | 6 (2, 15) | 13 (6, 16) |
| Intracranial pressure monitor placed, n (%) | 43 (14.9) | 7 (5.9) | 14 (12) | 19 (42.2) | 3 (33.3) |
| Seizure diagnosis, n (%) | 59 (20.4) | 11 (9.3) | 26 (22.2) | 17 (37.8) | 5 (55.6) |
| Red blood cell transfusion, n (%) | 52 (18) | 11 (9.3) | 18 (15.4) | 19 (42.2) | 4 (44.4) |
| Cardiac Arrest, n (%) | 2 (0.7) | 0 (0) | 0 (0) | 1 (2.2) | 1 (11.1) |
| Craniotomy or craniectomy, n (%) | 35 (12.1) | 14 (11.9) | 11 (9.4) | 9 (20) | 1 (11.1) |
| Therapy services involved during hospitalizationc | |||||
| Physical Therapy, n (%) | 93 (55) | 18 (31.6) | 33 (49.3) | 35 (92.1) | 7 (100) |
| Occupational Therapy, n (%) | 85 (50.3) | 18 (31.6) | 27 (40.3) | 33 (86.8) | 7 (100) |
| Speech Therapy, n (%) | 74 (43.8) | 13 (22.8) | 22 (32.8) | 33 (86.8) | 6 (85.7) |
We assumed subjects with a missing GCS value (n=24) or ISS (n=1) had low injury severity and assigned them normal values, 15 and 1, respectively. In the 24 subjects with missing GCS, the median ICU length of stay was 1 day (IQR 0-2) and duration of ventilation 0 days (IQR 0-2). The patient with a missing ISS was neither on mechanical ventilation nor admitted to the ICU.
Mild-complicated traumatic brain injury (TBI) was defined by ICD-9 codes representative of an abnormal brain computed tomography scan. [24]
Available for Children’s Hospital Colorado (CHCO) cohort only. IQR: Interquartile range; LOS: length of stay. Due to rounding, column percentages may not exactly sum to 100%.
Post-discharge Characteristics
Overall, 41 (14%) patients had a hospital readmission and 125 (43%) had an urgent care or ED visit in the year after discharge. Additionally, 274 (95%) patients had an outpatient claim (median 10 [IQR 5-21]) and 172 (60%) had a medication claim (median 1 [IQR 0-5]). The most frequently filled medications were antimicrobials (43%) and antiepileptics (20%). (Table 2) More than a third of the cohort had outpatient PT and SLP visits. Patients most frequently had claims related to mobility, feeding/communication, and neurologic domains and, less frequently, the respiratory domain. (Figure 2) Claims in the feeding/communication and mobility domains were primarily for SLP and PT services, respectively. (Figure 3a–b) In the 169 patients for whom we have inpatient PT, OT and SLP data (CHCO cohort), 10 (13%) of the 76 patients who did not have PT during the hospitalization received this service after discharge. Similarly, 25 (26%) of the 95 patients who did not receive SLP consultation received it after discharge. Across all domains, healthcare use was highest during the initial 4 months after discharge and plateaued between 6 and 12 months after discharge. (Figure 2) This was particularly prominent for the neurologic domain (consisting only of medication data). (Figure 3c) Respiratory health resource use was relatively stable during the post-discharge year. (Figure 3d)
Table 2.
Post-discharge insurance claims by cluster phenotype.
| Post-discharge insurance claims | Total cohort (n=289) | Phenotypes | |||
|---|---|---|---|---|---|
| 1 (n=118) | 2 (n=117) | 3 (n=45) | 4 (n=9) | ||
| Hospital readmission, n (%) | 41 (14.2) | 4 (3.4) | 20 (17.1) | 11 (24.4) | 6 (66.7) |
| Urgent Care/Emergency Department visit, n (%) | 125 (43.3) | 32 (27.1) | 63 (53.8) | 24 (53.3) | 6 (66.7) |
| Outpatient claims, median (IQR) | 10 (5, 21) | 4 (2, 6) | 13 (10, 20) | 37 (27, 69) | 144 (91, 223) |
| Physical Therapy, n (%) | 95 (32.9) | 4 (3.4) | 39 (33.3) | 45 (100) | 7 (77.8) |
| Speech Therapy, n (%) | 104 (36) | 20 (16.9) | 39 (33.3) | 36 (80) | 9 (100) |
| Medication claims, median (IQR) | 1 (0, 5) | 0 (0, 1) | 2 (0, 7) | 4 (1, 19) | 29 (9, 70) |
| Medications, n (%) | |||||
| Any | 172 (59.5) | 42 (35.6) | 84 (71.8) | 37 (82.2) | 9 (100) |
| Psychiatrica | 35 (12.1) | 5 (4.2) | 13 (11.1) | 13 (28.9) | 4 (44.4) |
| Stimulantsb | 16 (5.5) | 1 (0.8) | 9 (7.7) | 5 (11.1) | 1 (11.1) |
| Gastrointestinal | 50 (17.3) | 5 (4.2) | 19 (16.2) | 18 (40) | 8 (88.9) |
| Antiepileptics | 58 (20.1) | 6 (5.1) | 25 (21.4) | 20 (44.4) | 7 (77.8) |
| Antimicrobials | 124 (42.9) | 29 (24.6) | 63 (53.8) | 23 (51.1) | 9 (100) |
| Pulmonary | 40 (13.8) | 6 (5.1) | 19 (16.2) | 11 (24.4) | 4 (44.4) |
| Durable Medical Equipment, n (%) | |||||
| Feeding/communication | 27 (9.3) | 0 (0) | 7 (6) | 11 (24.4) | 9 (100) |
| Mobility | 18 (6.2) | 3 (2.5) | 5 (4.3) | 7 (15.6) | 3 (33.3) |
| Respiratory | 17 (5.9) | 0 (0) | 10 (8.5) | 3 (6.7) | 4 (44.4) |
| Therapy | 39 (13.5) | 5 (4.2) | 14 (12) | 15 (33.3) | 5 (55.6) |
Psychiatric medications included Anatomic Therapeutic Class-3 (ATC3) categorizations of antidepressants, anxiolytics, antipsychotics, hypnotics/sedative, and centrally-acting antiadrenergics.
Stimulants included ATC3 categorizations of psychostimulants, antidementia medications, and dopaminergic medications.
Figure 2. Percent of subjects with at least 1 claim for each domain category during the specified 1-month time period after hospital discharge.

Feeding/communication, mobility and neurologic morbidities decrease during the year after discharge and are more common than respiratory morbidities which are fairly stable during the year after discharge.
Figure 3. Percent of subjects with at least 1 claim for each domain category during the specified 1-month time period after hospital discharge.

3a) Feeding/communication domain. Medications: gastrointestinal medications, CPT codes: speech therapy claims, DME: feeding/communication category. 3b) Mobility domain. CPT codes: Physical therapy claims, DME: mobility and therapy category. 3c) Neurologic domain. Medications: Psychotropics, stimulants, analgesics, antiepileptics, muscle relaxants, antimigraine. 3d) Respiratory domain. Medications: pulmonary medications, DME: tracheostomy and respiratory categories. (Supplemental Digital Content Tables 1 and 2)
Outcome Phenotypes
The post-discharge claims data clustered patients into four distinct phenotypes. Overall, phenotype 4 had the most healthcare needs after discharge followed by phenotypes 3, 2, and 1. This was most noticeable in hospital readmission rates and outpatient claims. (Table 2) It is notable that ED and urgent care visit rates were relatively similar between phenotypes 2-4.
Medication claims demonstrated a similar distribution with phenotype 4 having the most medication claims followed by phenotypes 3 and 2 and far fewer claims for phenotype 1. (Table 2) This pattern was particularly prominent among antiepileptic medications and also consistent in the neurologic, pulmonary, and gastrointestinal medications.
Phenotypes 3 and 4 had higher rates of SLP therapy than phenotypes 1 and 2 (P3 and 4: 45(83%) versus P1 and 2: 59(25%)) and PT (P3 and 4: 52(96%) versus P1 and 2: 43(18%)). They also had higher rates of DME related to feeding/communication and functional morbidities. (Table 2) Phenotype 3 had more frequent PT than phenotype 4. However, phenotype 4 had more DME related to mobility and therapy domains. (Table 2) Similarly, phenotypes 3 and 4 both had high rates of SLP therapy but phenotype 4 had much higher rates of DME related to feeding/communication compared to phenotype 3.
Domain-specific health resource use (the composite of all available claims data) showed that phenotype 1 had the fewest morbidities across all domains. Phenotype 4 had the most morbidities as compared to the remainder of the cohort: neurologic (78% versus 36%), feeding/communication (100% versus 41%), and respiratory (67% versus 13%). (Figure 4) Phenotypes 3 and 4 were similarly affected in the mobility domain, far exceeding mobility morbidities in phenotypes 1 and 2 (100% and 89% versus 8% and 39%). Phenotypes 2 and 3 were similarly affected in the neurologic and respiratory domains (49% versus 69% and 16% versus 27%, respectively) but phenotype 3 had higher rates of feeding/communication than phenotype 2 (89% versus 44%).
Figure 4. Percent of subjects in each phenotype with at least one claim in the domain category during the year after hospital discharge.

Progressively larger diamonds represent the percent of subjects in each phenotype with at least one claim in the domain category during the year after hospital discharge. Phenotype 4 is the most severely affected, followed by phenotype 3 then 2 then 1.
Index Hospitalization Characteristics
Phenotypes 1 and 2 represented more than 80% of the overall cohort and sustained less severe injuries as compared to phenotypes 3 and 4 as evidenced by lower ISS: (P1 and 2: 14 [IQR 9-21] versus P3 and 4: 23 [IQR 16-32], p<0.001), higher proportion with mild or mild-complicated TBI (P1 and 2: 65% versus P3 and 4: 37%, p<0.001), and shorter hospital stays (P1 and 2: median 3 [IQR 2-6] versus P3 and 4: 23 [IQR 12-52] days, p<0.001). (Table 1) Phenotype 4 encompassed the most severely injured patients with predominantly inflicted injuries whereas phenotype 3 was predominantly motor vehicle crash (18(40%)) and inflicted (16(36%)) injuries. (Table 1) Patients in both phenotypes 3 and 4 had a high rate of seizures and transfusions.
Phenotype Predictors
Because phenotype 4 had only 9 members, we had to exclude it from the multivariable model. We anticipate that many clinicians have experience with severely injured patients similar to those in phenotype 4. Index hospitalization characteristics most associated with membership in phenotypes 1, 2, and 3 included injury severity (ISS and number of body regions with an abbreviated injury score ≥ 2), mechanism of injury, ICP monitor placement, seizures during index hospitalization, and hospital and ICU lengths of stay. The model was most accurate for discrimination of membership in phenotype 3 (those with the highest rates of health resource use of the 3 groups) with an AUROC of 0.85 (95% confidence interval (CI) 0.78 – 0.92). Characteristics that most accurately predicted phenotype 3 membership were inflicted injury and longer ICU stay. (Table 3) The model showed acceptable discrimination for phenotype 1 (those with the least health resource use) with an AUROC of 0.7 (95% CI 0.64–0.76). The characteristic that most accurately predicted membership in phenotype 1 was lack of seizures. The model showed lower discrimination for phenotype 2 with an AUROC of 0.63 (95% CI 0.57–0.70). The characteristics that most accurately predicted phenotype 2 membership were seizures during index hospitalization and shorter ICU stay. (Table 3)
Table 3. Multivariable cluster membership prediction model.
Listed variables were generated by univariable models for membership in each phenotype as compared to the other two phenotypes.
| Predictive Characteristic, Odds Ratio (95% Confidence Interval) | Phenotypes | ||
|---|---|---|---|
| 1 | 2 | 3 | |
| Bicycle injury | 3.05 (0.95, 12.46) | 0.36 (0.09, 1.15) | NAa |
| Hospital length of stay (days) | 0.98 (0.95, 1.01) | 1 (0.98, 1.02) | 1.01 (0.98, 1.03) |
| Intracranial pressure monitor placed | 0.56 (0.18, 1.59) | 1.43 (0.54, 3.85) | 1.44 (0.42, 4.53) |
| Intensive Care Unit length of stay (days) | 1.04 (0.93, 1.17) | 0.88 (0.78, 0.97) | 1.14 (1.01, 1.29) |
| Injury Severity Score | 0.99 (0.95, 1.02) | 1.01 (0.97, 1.04) | 1.02 (0.97, 1.07) |
| Inflicted injury | 0.55 (0.22, 1.28) | 0.51 (0.22, 1.14) | 8.03 (2.98, 22.23) |
| Number of regions AIS ≥ 2 | 0.74 (0.52, 1.03) | 1.26 (0.92, 1.74) | 1.21 (0.74, 1.95) |
| Seizure diagnosis | 0.41 (0.17, 0.93) | 3.07 (1.41, 6.99) | 0.67 (0.22, 1.9) |
| Model Performance | |||
| C-statistic for receiver operating curve | 0.7 (0.64, 0.76) | 0.63 (0.57, 0.7) | 0.85 (0.78, 0.92) |
Phenotype 3 did not have any patients with bicycle as the mechanism of injury. AIS: abbreviated injury score.
Discussion
Using insurance claims data from the year after hospital discharge, we identified 4 outcome phenotypes in children who survived a hospitalization for TBI. The phenotypes were characterized by frequency of readmissions, medication use, therapy needs, DME, and morbidity domains affected. Phenotypes 3 and 4 had the highest rates of post-discharge health resource use and particularly high rates of feeding/communication and mobility morbidities, most pronounced for phenotype 4. Phenotypes 3 and 4 were characterized by higher injury severity, severe mechanisms of injury, longer durations of mechanical ventilation, ICU stays, and hospital stays, and high rates of seizures and transfusions during the index hospitalization. Phenotype 1 had the least post-discharge healthcare needs and was predicted by lack of seizures during the index hospitalization. Phenotype 2 represents an intermediate phenotype. Interestingly, injury severity, as defined by ED GCS, while generally related to phenotype did not directly correlate. (Supplemental Digital Content Figure 2)
Our results are consistent with previous reports suggesting mobility and feeding/communication morbidities are most common in severe TBI, particularly after inflicted injuries and motor vehicle crashes. [9 33] The detailed nature of insurance claims data suggests that the types of post-discharge healthcare needs reflective of these morbidities are different for the most severely injured phenotypes. Phenotype 4 morbidities were more frequently DME-related whereas phenotype 3 morbidities were more frequently therapy-related services. We speculate this may be associated with the higher rates of neurologic morbidities in phenotype 4 that make them poor rehabilitation candidates.
Insurance claims data also provide the ability to track domain-specific recovery trajectory. [34] Our results suggest that morbidities in the mobility, feeding/communication, and neurologic domains are more likely to improve during the year after discharge in contrast with the respiratory domain which remains stable. The recovery trajectory is similar to that seen in other studies: most significant recovery during the 3-6 months after discharge with subsequent plateauing during the year after discharge. [35 36]
Recent critical care publications have used latent class analysis (LCA), a clustering technique similar to k-medoids. [37–40] K-medoids and LCA differ in that LCA assumes a simple parametric model predicting cluster membership. K-medoids does not assume a model, instead minimizing distances between cluster centers (medoids) and maximizing cluster homogeneity. [41] LCA has recently been used on index hospitalization characteristics of children with TBI and, as this field of research develops, additional patient (e.g. socioeconomic status) and hospitalization (e.g. organ dysfunctions) characteristics could augment the accuracy to forecast long-term health resource utilization. [40]
Insurance claims offer an objective measure of post-discharge health resource use as a proxy of morbidity. Morbidity measurement after injury is challenging and often relies on subjective measurements related to health-related quality of life and functional abilities. [16 42–44] These assessments often require family or patient participation, can be time-consuming for families and researchers, and often result in limited data due to incomplete study enrollment and losses to follow-up. [16 42–45] Utilization of insurance claims to quantify functional morbidities is a novel method to improve our understanding of post-discharge health resource use and identify functional outcome phenotypes. Delineation of these phenotypes improves the ability to use hospitalization characteristics to predict post-discharge morbidities, some of which may not be apparent during the acute injury period (e.g. subtle feeding impairments, depression, anxiety). [35 43 44] An improved understanding of the patient’s risk profile will better prepare the patients’ families and team of outpatient providers who assume care for them. [35 46 47] Additionally, these categorizations help to identify a cohort at high risk of specific impairments allowing for prognostic enrichment of clinical trials.
To evaluate for characteristics predictive of outcome phenotype, we generated predictive models for outcome phenotypes 1, 2, and 3. (Table 3) These models showed good accuracy for phenotypes 1 (lowest health resource use) and 3 (higher health resource use) and nearly all variables selected for model inclusion are available early in the hospitalization. Phenotype 2’s model was less accurate with an AUROC of 0.63, likely because it represents an intermediate phenotype between 1 and 3. The characteristics that appear to differentiate phenotype 2 are seizures (versus phenotype 1) and a shorter ICU stay and inflicted injury mechanism (versus phenotype 3). The association between seizures and post-discharge morbidity is consistent with prior work showing a similar relationship between seizures and unplanned readmission. [48]
This study is limited by missing data because 51% of patients were not included in the APCD due to residence outside of Colorado (10-15% of CHCO trauma patients) or patients covered through self-insured entities (e.g. universities, state and local governments). The latter is evidenced by the higher proportion of patients in the unmatched cohort with commercial insurance compared to the matched cohort (68% versus 15%) which may limit generalizability to patients with commercial insurance. (Supplemental Digital Content Table 4) This contrasts many prospective pediatric critical care studies evaluating long-term outcomes which suffer from systematic bias associated with poor representation of lower socioeconomic status patients either due to low enrollment or high loss to follow-up. [43 44] Our dataset is also limited by the lack of detailed imaging findings which can provide valuable prognostication data. Additionally, we do not have post-discharge mortality data and are unable to account for death as a competing risk. We also lack access to the patients’ pre-hospitalization health resource use and cannot control for pre-injury status. However, studies consistently report children with TBI as a predominantly previously healthy population. [9 24 33] The two hospitals included in this cohort serve a broad population including CHCO as the region’s pediatric trauma referral center. While this is likely representative of patterns across Colorado and our cohort has a similar distribution of injury mechanism albeit slightly longer durations of hospitalization as compared to other large cohorts of hospitalized TBI patients, additional studies would need to determine the generalizability of these phenotypes geographically and during contemporary time periods. [49 50] Finally, claims data are likely to identify most significant morbidities, however, some morbidities and their recovery/deterioration trajectory may not be captured due to poor access or discontinuation of services that are not resulting in improvements or death.
Conclusions
Unsupervised machine learning can successfully identify clusters of post-discharge functional morbidities using insurance claims data in a two-center cohort of children hospitalized for TBI. This approach provides objective criteria to identify patients at high risk of domain-specific morbidities and patterns of health resource use, which could be compared with accuracy of predictions by clinicians. Furthermore, predictors of cluster membership are readily available early in the ICU course which provides the necessary information for prognostic enrichment of future clinical trials of interventions targeting mitigation or treatment of domain-specific morbidities. Future studies incorporating a diverse geographic location will serve to further refine the accuracy and generalizability of these cohorts.
Supplementary Material
Supplemental Table 1. Durable Medical Equipment claims by category
Supplemental Figure 1. Cohort identification.
Supplemental Figure 2. Emergency Department Glasgow Coma Score (ED GCS) across phenotypes.
Supplemental Table 2. Anatomical Therapeutic Chemical (ATC) 3 medication groupings
Supplemental Table 3. Variables Considered for Inclusion in Predictive Model
Supplemental Table 4. Index hospitalization characteristics of APCD- matched versus unmatched cohorts
Supplemental Table 5. Additional post-discharge phenotype cluster characteristics identified by insurance claims
Acknowledgements:
We acknowledge Carol Okada, MD, Assistant Professor of Pediatrics at the University of Colorado School of Medicine in the Section of Critical Care Medicine and the Director of Inpatient Pediatrics at Denver Health Medical Center for her collaboration. We acknowledge Michael Kahn, MD, PhD, Professor with Tenure, Section of Informatics and Data Science, Department of Pediatrics at the University of Colorado School of Medicine and Children’s Hospital Colorado for his infrastructure support and expertise.
Conflicts of Interest and Sources of Funding: Dr. Bennett has received a grant from the University of Colorado Data Science to Patient Value (D2V) program. Dr. Maddux has received grants from the Francis Family Foundation and the Eunice Kennedy Shriver National Institute for Child Health and Human Development (K23HD096018, Maddux). For the remaining authors, none were declared.
References:
- 1.Faul M, Zu L, Walk MM, Coronado VG Traumatic Brain Injury in the United States: Emergency Department Visits, Hospitalizations, and Deaths 2002-2006. . Atlanta, GA. , 2010. [Google Scholar]
- 2.Shi J, Xiang H, Wheeler K, et al. Costs, mortality likelihood and outcomes of hospitalized US children with traumatic brain injuries. Brain injury 2009;23(7):602–11 doi: 10.1080/02699050903014907[published Online First: Epub Date]|. [DOI] [PMC free article] [PubMed] [Google Scholar]
- 3.Consensus conference. Rehabilitation of persons with traumatic brain injury. NIH Consensus Development Panel on Rehabilitation of Persons With Traumatic Brain Injury. Jama 1999;282(10):974–83 [PubMed] [Google Scholar]
- 4.Max JE, Lansing AE, Koele SL, et al. Attention deficit hyperactivity disorder in children and adolescents following traumatic brain injury. Developmental neuropsychology 2004;25(1-2):159–77 doi: 10.1080/87565641.2004.9651926[published Online First: Epub Date]|. [DOI] [PubMed] [Google Scholar]
- 5.Anderson V, Catroppa C, Morse S, Haritou F, Rosenfeld J. Functional plasticity or vulnerability after early brain injury? Pediatrics 2005;116(6):1374–82 doi: 10.1542/peds.2004-1728[published Online First: Epub Date]|. [DOI] [PubMed] [Google Scholar]
- 6.Anderson V, Catroppa C, Morse S, Haritou F, Rosenfeld J. Attentional and processing skills following traumatic brain injury in early childhood. Brain injury 2005;19(9):699–710 doi: 10.1080/02699050400025281[published Online First: Epub Date]|. [DOI] [PubMed] [Google Scholar]
- 7.Hawley CA. Behaviour and school performance after brain injury. Brain injury 2004;18(7):645–59 doi: 10.1080/02699050310001646189[published Online First: Epub Date]|. [DOI] [PubMed] [Google Scholar]
- 8.Kirk S, Fallon D, Fraser C, Robinson G, Vassallo G. Supporting parents following childhood traumatic brain injury: a qualitative study to examine information and emotional support needs across key care transitions. Child: care, health and development 2015;41(2):303–13 doi: 10.1111/cch.12173[published Online First: Epub Date]|. [DOI] [PubMed] [Google Scholar]
- 9.Bennett TD, Dixon RR, Kartchner C, et al. Functional Status Scale in Children With Traumatic Brain Injury: A Prospective Cohort Study. Pediatric critical care medicine : a journal of the Society of Critical Care Medicine and the World Federation of Pediatric Intensive and Critical Care Societies 2016;17(12):1147–56 doi: 10.1097/pcc.0000000000000934[published Online First: Epub Date]|. [DOI] [PMC free article] [PubMed] [Google Scholar]
- 10.Chiaretti A, Piastra M, Pulitano S, et al. Prognostic factors and outcome of children with severe head injury: an 8-year experience. Child’s nervous system : ChNS : official journal of the International Society for Pediatric Neurosurgery 2002;18(3-4):129–36 doi: 10.1007/s00381-002-0558-3[published Online First: Epub Date]|. [DOI] [PubMed] [Google Scholar]
- 11.Keenan HT, Hooper SR, Wetherington CE, Nocera M, Runyan DK. Neurodevelopmental consequences of early traumatic brain injury in 3-year-old children. Pediatrics 2007;119(3):e616–23 doi: 10.1542/peds.2006-2313[published Online First: Epub Date]|. [DOI] [PMC free article] [PubMed] [Google Scholar]
- 12.Rosario BL, Horvat CM, Wisniewski SR, et al. Presenting Characteristics Associated With Outcome in Children With Severe Traumatic Brain Injury: A Secondary Analysis From a Randomized, Controlled Trial of Therapeutic Hypothermia. Pediatric critical care medicine : a journal of the Society of Critical Care Medicine and the World Federation of Pediatric Intensive and Critical Care Societies 2018;19(10):957–64 doi: 10.1097/pcc.0000000000001676[published Online First: Epub Date]|. [DOI] [PMC free article] [PubMed] [Google Scholar]
- 13.Babikian T, Merkley T, Savage RC, Giza CC, Levin H. Chronic Aspects of Pediatric Traumatic Brain Injury: Review of the Literature. Journal of neurotrauma 2015;32(23):1849–60 doi: 10.1089/neu.2015.3971[published Online First: Epub Date]|. [DOI] [PubMed] [Google Scholar]
- 14.Jiang JY, Gao GY, Li WP, Yu MK, Zhu C. Early indicators of prognosis in 846 cases of severe traumatic brain injury. Journal of neurotrauma 2002;19(7):869–74 doi: 10.1089/08977150260190456[published Online First: Epub Date]|. [DOI] [PubMed] [Google Scholar]
- 15.Nielson JL, Cooper SR, Yue JK, et al. Uncovering precision phenotype-biomarker associations in traumatic brain injury using topological data analysis. PLoS One 2017;12(3):e0169490 doi: 10.1371/journal.pone.0169490[published Online First: Epub Date]|. [DOI] [PMC free article] [PubMed] [Google Scholar]
- 16.Maddux AB, Pinto NP, Fink EL, et al. Post-discharge outcome domains in pediatric critical care and the instruments used to evaluate them: a scoping review. Crit Care Med 2020. (In press) [DOI] [PMC free article] [PubMed] [Google Scholar]
- 17.Steinley D K-means clustering: a half-century synthesis. The British journal of mathematical and statistical psychology 2006;59(Pt 1):1–34 doi: 10.1348/000711005x48266[published Online First: Epub Date]|. [DOI] [PubMed] [Google Scholar]
- 18.Williams JB, Ghosh D, Wetzel RC. Applying Machine Learning to Pediatric Critical Care Data. Pediatric critical care medicine : a journal of the Society of Critical Care Medicine and the World Federation of Pediatric Intensive and Critical Care Societies 2018;19(7):599–608 doi: 10.1097/pcc.0000000000001567[published Online First: Epub Date]|. [DOI] [PubMed] [Google Scholar]
- 19.Low Value Care in Colorado. Secondary Low Value Care in Colorado March 2020. https://www.civhc.org/wp-content/uploads/2020/03/Low-Value-Care-Public-Report_FINAL.pdf.
- 20.Bennett TD, Dean JM, Keenan HT, McGlincy MH, Thomas AM, Cook LJ. Linked Records of Children with Traumatic Brain Injury. Probabilistic Linkage without Use of Protected Health Information. Methods of information in medicine 2015;54(4):328–37 doi: 10.3414/me14-01-0093[published Online First: Epub Date]|. [DOI] [PMC free article] [PubMed] [Google Scholar]
- 21.McGlincy MH. A Bayesian Record Linkage Methodology for Multiple Imputation of Missing Links. ASA Section on Survey Research Methods 2004:4001–08 [Google Scholar]
- 22.Hammond FM, Giacino JT, Nakase Richardson R, et al. Disorders of Consciousness due to Traumatic Brain Injury: Functional Status Ten Years Post-Injury. Journal of neurotrauma 2019;36(7):1136–46 doi: 10.1089/neu.2018.5954[published Online First: Epub Date]|. [DOI] [PubMed] [Google Scholar]
- 23.Health NIoP. ATC: Structure and Principles. (November 26, 2018)
- 24.Bennett KS, DeWitt PE, Harlaar N, Bennett TD. Seizures in Children With Severe Traumatic Brain Injury. Pediatric critical care medicine : a journal of the Society of Critical Care Medicine and the World Federation of Pediatric Intensive and Critical Care Societies 2017;18(1):54–63 doi: 10.1097/pcc.0000000000000948[published Online First: Epub Date]|. [DOI] [PMC free article] [PubMed] [Google Scholar]
- 25.Bennett TD, DeWitt PE, Dixon RR, et al. Development and Prospective Validation of Tools to Accurately Identify Neurosurgical and Critical Care Events in Children With Traumatic Brain Injury. Pediatric critical care medicine : a journal of the Society of Critical Care Medicine and the World Federation of Pediatric Intensive and Critical Care Societies 2017;18(5):442–51 doi: 10.1097/pcc.0000000000001120[published Online First: Epub Date]|. [DOI] [PMC free article] [PubMed] [Google Scholar]
- 26.Kassambara A Practical Guide to Cluster Analysis in R: Unsupervised machine learning. 1 ed. France: STHDA, 2017:15–40. [Google Scholar]
- 27.Lebart LM, A. Piron M. Statistique Exploratoire Multidimensionnelle. 3rd ed. Paris: Dunod, 2000. [Google Scholar]
- 28.Charrad MGN, Boiteau V, Niknafs A. . NbClust: An R Package for Determining the Relevant Number of Clusters in a Data Set. Journal of Statistical Software 2014;61(6):1–36 [Google Scholar]
- 29.Firth D Bias Reduction of Maximum Likelihood Estimates. Biometrika 1993;80(1):27–38 [Google Scholar]
- 30.Friedman JH, T. Tibshirani R . Regularization Paths for Generalized Linear Models via Coordinate Descent. . Journal of Statistical Software 2010;33(1):1–22 [PMC free article] [PubMed] [Google Scholar]
- 31.logistf: Firth’s Bias-Reduced Logistic Regression [program]. 1.23 version: R (> 3.0.0), 2018.
- 32.Puhr R, Heinze G, Nold M, Lusa L, Geroldinger A. Firth’s logistic regression with rare events: accurate effect estimates and predictions? Statistics in medicine 2017;36(14):2302–17 doi: 10.1002/sim.7273[published Online First: Epub Date]|. [DOI] [PubMed] [Google Scholar]
- 33.Ahmed OZ, Holubkov R, Dean JM, et al. Change in functional status among children treated in the intensive care unit after injury. The journal of trauma and acute care surgery 2019;86(5):810–16 doi: 10.1097/ta.0000000000002120[published Online First: Epub Date]|. [DOI] [PMC free article] [PubMed] [Google Scholar]
- 34.Porter JLD, Costello A, Wilder A, Sullivan E. All-Payer Claims Database Council. 2009-2019;2019(June 4, 2019) [Google Scholar]
- 35.Herridge MS, Chu LM, Matte A, et al. The RECOVER Program: Disability Risk Groups and 1-Year Outcome after 7 or More Days of Mechanical Ventilation. American journal of respiratory and critical care medicine 2016;194(7):831–44 doi: 10.1164/rccm.201512-2343OC[published Online First: Epub Date]|. [DOI] [PubMed] [Google Scholar]
- 36.Zimmerman JJ, Banks R, Berg RA, et al. Trajectory of Mortality and Health-Related Quality of Life Morbidity Following Community-Acquired Pediatric Septic Shock. Critical care medicine 2020;48(3):329–37 doi: 10.1097/ccm.0000000000004123[published Online First: Epub Date]|. [DOI] [PMC free article] [PubMed] [Google Scholar]
- 37.Bhatraju PK, Zelnick LR, Herting J, et al. Identification of Acute Kidney Injury Subphenotypes with Differing Molecular Signatures and Responses to Vasopressin Therapy. American journal of respiratory and critical care medicine 2019;199(7):863–72 doi: 10.1164/rccm.201807-1346OC[published Online First: Epub Date]|. [DOI] [PMC free article] [PubMed] [Google Scholar]
- 38.Calfee CS, Delucchi K, Parsons PE, Thompson BT, Ware LB, Matthay MA. Subphenotypes in acute respiratory distress syndrome: latent class analysis of data from two randomised controlled trials. The Lancet. Respiratory medicine 2014;2(8):611–20 doi: 10.1016/s2213-2600(14)70097-9[published Online First: Epub Date]|. [DOI] [PMC free article] [PubMed] [Google Scholar]
- 39.Sinha P, Delucchi KL, Thompson BT, McAuley DF, Matthay MA, Calfee CS. Latent class analysis of ARDS subphenotypes: a secondary analysis of the statins for acutely injured lungs from sepsis (SAILS) study. Intensive care medicine 2018;44(11):1859–69 doi: 10.1007/s00134-018-5378-3[published Online First: Epub Date]|. [DOI] [PMC free article] [PubMed] [Google Scholar]
- 40.Keenan HT, Clark AE, Holubkov R, et al. Latent class analysis to classify injury severity in pediatric TBI. Journal of neurotrauma 2020. doi: 10.1089/neu.2019.6874[published Online First: Epub Date]|. [DOI] [PMC free article] [PubMed] [Google Scholar]
- 41.Papachristou N, Barnaghi P, Cooper BA, et al. Congruence Between Latent Class and K-Modes Analyses in the Identification of Oncology Patients With Distinct Symptom Experiences. Journal of pain and symptom management 2018;55(2):318–33. e4 doi: 10.1016/j.jpainsymman.2017.08.020[published Online First: Epub Date]|. [DOI] [PMC free article] [PubMed] [Google Scholar]
- 42.Aspesberro F, Fesinmeyer MD, Zhou C, Zimmerman JJ, Mangione-Smith R. Construct Validity and Responsiveness of the Pediatric Quality of Life Inventory 4.0 Generic Core Scales and Infant Scales in the PICU. Pediatric critical care medicine : a journal of the Society of Critical Care Medicine and the World Federation of Pediatric Intensive and Critical Care Societies 2016;17(6):e272–9 doi: 10.1097/pcc.0000000000000727[published Online First: Epub Date]|. [DOI] [PubMed] [Google Scholar]
- 43.Pinto NP, Rhinesmith EW, Kim TY, Ladner PH, Pollack MM. Long-Term Function After Pediatric Critical Illness: Results From the Survivor Outcomes Study. Pediatric critical care medicine : a journal of the Society of Critical Care Medicine and the World Federation of Pediatric Intensive and Critical Care Societies 2017;18(3):e122–e30 doi: 10.1097/pcc.0000000000001070[published Online First: Epub Date]|. [DOI] [PubMed] [Google Scholar]
- 44.Watson RS, Asaro LA, Hertzog JH, et al. Long-Term Outcomes after Protocolized Sedation versus Usual Care in Ventilated Pediatric Patients. American journal of respiratory and critical care medicine 2018;197(11):1457–67 doi: 10.1164/rccm.201708-1768OC[published Online First: Epub Date]|. [DOI] [PMC free article] [PubMed] [Google Scholar]
- 45.Maddux AB, Zimmerman JJ. Awake or Sedate … Do We Know the Best State? American journal of respiratory and critical care medicine 2018;197(11):1378–80 doi: 10.1164/rccm.201801-0044ED[published Online First: Epub Date]|. [DOI] [PubMed] [Google Scholar]
- 46.Brown SM, Wilson EL, Presson AP, et al. Understanding patient outcomes after acute respiratory distress syndrome: identifying subtypes of physical, cognitive and mental health outcomes. Thorax 2017;72(12):1094–103 doi: 10.1136/thoraxjnl-2017-210337[published Online First: Epub Date]|. [DOI] [PMC free article] [PubMed] [Google Scholar]
- 47.Herridge MS. Fifty Years of Research in ARDS. Long-Term Follow-up after Acute Respiratory Distress Syndrome. Insights for Managing Medical Complexity after Critical Illness. American journal of respiratory and critical care medicine 2017;196(11):1380–84 doi: 10.1164/rccm.201704-0815ED[published Online First: Epub Date]|. [DOI] [PubMed] [Google Scholar]
- 48.Maddux AB, DeWitt PE, Mourani PM, Bennett TD. Hospital Readmissions After Pediatric Trauma. Pediatric critical care medicine : a journal of the Society of Critical Care Medicine and the World Federation of Pediatric Intensive and Critical Care Societies 2018;19(1):e31–e40 doi: 10.1097/pcc.0000000000001383[published Online First: Epub Date]|. [DOI] [PMC free article] [PubMed] [Google Scholar]
- 49.Ewing-Cobbs L, Cox CS Jr., Clark AE, Holubkov R, Keenan HT. Persistent Postconcussion Symptoms After Injury. Pediatrics 2018;142(5) doi: 10.1542/peds.2018-0939[published Online First: Epub Date]|. [DOI] [PMC free article] [PubMed] [Google Scholar]
- 50.Rivara FP, Koepsell TD, Wang J, et al. Disability 3, 12, and 24 months after traumatic brain injury among children and adolescents. Pediatrics 2011;128(5):e1129–38 doi: 10.1542/peds.2011-0840[published Online First: Epub Date]|. [DOI] [PMC free article] [PubMed] [Google Scholar]
Associated Data
This section collects any data citations, data availability statements, or supplementary materials included in this article.
Supplementary Materials
Supplemental Table 1. Durable Medical Equipment claims by category
Supplemental Figure 1. Cohort identification.
Supplemental Figure 2. Emergency Department Glasgow Coma Score (ED GCS) across phenotypes.
Supplemental Table 2. Anatomical Therapeutic Chemical (ATC) 3 medication groupings
Supplemental Table 3. Variables Considered for Inclusion in Predictive Model
Supplemental Table 4. Index hospitalization characteristics of APCD- matched versus unmatched cohorts
Supplemental Table 5. Additional post-discharge phenotype cluster characteristics identified by insurance claims