

Abstract
Objective:
One barrier hindering high frequency brain signals (HFBS, >80 Hz) from wide clinical applications is that the brain generates both pathological and physiological HFBS. This study was to find specific biomarkers for localizing epileptogenic zones (EZs).
Methods:
Twenty three children with drug-resistant epilepsy and age/sex matched healthy controls were studied with magnetoencephalography (MEG). High frequency oscillations (HFOs, > 4 oscillatory waveforms) and high frequency spikes (HFSs, > 1 spiky or sharp waveforms) in 80–250 Hz and 250–600 Hz bands were blindly detected with an artificial intelligence method and validated with visual inspection. The magnitude of HFOs and HFSs were quantified with spectral analyses. Sources of HFSs and HFOs were localized and compared with clinical EZs determined by invasive recordings and surgical outcomes.
Results:
HFOs in 80–250 Hz and 250–600 Hz were identified in both epilepsy patients (18/23, 12/23, respectively) and healthy controls (6/23, 4/23, respectively). HFSs in 80–250 Hz and 250–600 Hz were detected in patients (16/23, 11/23, respectively) but not in healthy controls. A combination of HFOs and HFSs localized EZs for 22 (22/23, 96%) patients.
Conclusions:
The results indicate, for the first time, that HFSs are a newer and more specific biomarker than HFOs for localizing EZs because HFOs appeared in both epilepsy patients and healthy controls while HFSs appeared only in epilepsy patients.
Keywords: Epilepsy, Magnetoencephalography, High-Frequency Oscillation, High Frequency Spike, High Frequency Activity, Magnetic Source Imaging
1. Introduction
Recent advances in epilepsy research have revealed that the epileptic brain generates high frequency brain signals (HFBS, > 80 Hz), which can be detected invasively [1–5] and noninvasively [6–9]. Invasive recordings [1–5] have provided solid evidence that HFBS play an important role in epileptogenesis and epileptogenicity. The resection of the brain areas generating HFBS can predict favorable outcomes of epilepsy surgery [10–12]. Noninvasive technologies, such as magnetoencephalography (MEG) and scalp electroencephalography (EEG), have shown promising results for detection and localization of HFBS [6–9].
One barrier hindering HFBS from wide clinical applications [13, 14] is that the brain generates both epileptic (pathological) and physiological HFBS. The majority of previous reports [1–5] focus on oscillatory HFBS, which are typically called high frequency oscillations (HFOs, 80–600 Hz or 80–500 Hz, varying slightly among reports). HFOs are typically defined as four or more oscillatory waveforms standing out from background activity [1–5]. Unfortunately, epileptiform high frequency activities (HFAs) [15] or high frequency spikes (HFSs) [16, 17] may not have four or more oscillations. It seems that epileptiform HFBS may include both HFOs and HFSs [5, 18–20]. Though HFOs have attracted significant research interest and have been proposed as potential biomarkers of epilepsy [21, 22], characterization of HFSs is still in its infancy. To our knowledge, there is no MEG report on both HFOs and HFSs in pediatric epilepsy.
A recent report [23] has demonstrated that the kurtosis of high frequency neuromagnetic signals in MEG data is significantly elevated in epilepsy. Since kurtosis mainly reveals the spikiness of MEG signals, MEG HFBS may include both oscillatory HFOs and non-oscillatory HFSs. If MEG HFSs could be detected and localized to the epileptogenic zone (EZ), the clinical usefulness of MEG HFBS, which is assumed to include both HFOs and HFSs, can be significantly improved. For example, HFSs have been noticed in focal cortical dysplasia in animal studies [24, 25]. Some epilepsy patients may not have MEG HFOs [19, 26]. If MEG HFSs could be detected in those patients, sources of MEG HFSs might be used to guide epilepsy surgery for those patients. Needless to say, MEG HFSs provide important clues for guiding clinical invasive recordings for pre-operative workup for epilepsy patients. Of note, MEG detection of HFSs is important to expand the usefulness of HFBS as a biomarker for epilepsy surgery.
The objective of this study is to determine if HFSs are a more specific biomarker for localizing EZs by analyzing both HFOs and HFSs. To address this aim, we analyzed both HFSs and HFOs from a group of patients with drug-resistant epilepsy who underwent pre-surgical evaluation with MEG followed by surgical resection of pathologic brain areas. To characterize epileptic HFSs and HFOs, we also analyzed HFSs and HFOs from a group of age and sex matched healthy controls. To determine the usefulness of HFSs in epilepsy surgery, we compared MEG sources with EZs defined by clinical invasive recordings and surgical outcomes. Since no literature has investigated HFSs with MEG, particularly, for pediatric epilepsy [26, 27], the results of the present study can provide novel and important insight into epileptic biomarkers, expanding upon the conventional analysis of low frequency spikes for clinical management of epilepsy.
2. Methods
2.1. Patients
Twenty-three pediatric patients were identified and recruited from the epilepsy surgical database at Cincinnati Children’s Hospital Medical Center (CCHMC). The sample size was estimated with pilot data from our previous study [23]. All the 23 patients met the following criteria for the present research. The inclusion criteria for patients were: (1) Drug-resistant epilepsy and a surgical candidates; (2) Underwent clinical intracranial recordings; (3) Had epilepsy surgery, defined as resection or ablation of EZs; (4) Preoperative magnetic resonance imaging (MRI) scan and MEG; and (5) Post-operative assessments have been obtained at least one year after surgery. The control group included healthy children and adolescents. Controls were recruited to match the patients with epilepsy for age/gender and met inclusion criteria of: (1) Healthy without history of neurological disorder; (2) MRI normal; (3) Head movement during MEG recording was less than 5 mm; (4) At least 120 seconds of MEG recordings were clean (deflections of MEG signals in 3–80 Hz were within 6 pT). Exclusion criteria for all participants were: (1) Presence of an implant, such as cochlear implant devices, a pacemaker or neuro-stimulator, devices containing electrical circuitry, generating magnetic signals or having other metal that could produce visible magnetic noise in the MEG data; (2) Requiring sedation or unable to keep still. To avoid bias, data from all participants were de-identified. The characteristics and clinical information of all patients, who met inclusion/exclusion criteria, are shown in Table 1. The research protocol was reviewed by the Institutional Review Board (IRB) at CCHMC. Informed consents, formally approved by IRB at CCHMC, were obtained from each control subject in accordance with the Declaration of Helsinki. Informed consent was obtained from LAR/parents of the participants whose age was less than 18 years (minors).
Table 1.
Clinical Characteristics of Patients with Drug-Resistant Epilepsy
| ID | Sex/Age | Etiology | MRI | MEG (Spike) | Scalp EEG | iEEG (ictal) | Ripple | Fast Ripple | Spikelet | Fast Spikelets | Resect | ES |
|---|---|---|---|---|---|---|---|---|---|---|---|---|
| 1 | M/13 | FCD | L Hi | L TF | LT,LC | L TF | L TF | -- | L TF | -- | L TF | 1a |
| 2 | F/11 | TSC | R F | R F | R He | R F | R F | R F | R F | RF | R F | 1a |
| 3 | M/14 | FCD | L T | L T | L T | L T | L T | L T | L T | L T | L T | 1a |
| 4 | M/14 | FCD | L TO | L TO | L He | L TO | L TO | -- | -- | -- | L TO | 1a |
| 5 | F/16 | TSC | MT | L FT | L He | L FT | L FT | -- | -- | -- | L FT | 1a |
| 6 | F/9 | Unknown | R Hi | R T | Bi FT | R T | R T,D | R T | R T | R T | R T | 1a |
| 7 | M/13 | Stroke | L P | L P | L P | L P | L P | L P | L P,D | L P,D | L P | 1a |
| 8 | M/6 | Tumor | Neg | L F | L He | L F | L F | L F | L F | L F | L F | 1a |
| 9 | M/9 | TSC | MT | R FT | Bi FT | R FT | R FT | -- | R FT | -- | R FT | 1b |
| 10 | M/10 | TSC | MT | L FT | L FT | L FT | -- | -- | L FT | -- | L FT | 1a |
| 11 | M/11 | Stroke | Neg | L PO | L PO | L PO | -- | -- | -- | L PO | L PO | 1a |
| 12 | M/6 | TSC | MT | R FT | R FT | R FT | -- | -- | R FT | -- | R FT | 1a |
| 13 | M/14 | FCD | L F | L F | Bi F | L F | L F | L F | L F | -- | L F | 1a |
| 14 | M/14 | TSC | MT | L T | Bi FT | L FT | L T | L T | L T | L T | L T | 1a |
| 15 | F/16 | FCD | L F | RF,LT* | Bi T | RF,LT | L. F | L F,D | L. F | L. F | L. F | 1a |
| 16 | F/13 | FCD | Neg | LF,LC* | Bi F | LF, LC | L F | L F | L F | -- | L F | 1a |
| 17 | F/18 | FCD | Neg | L. T | L T | L T | L T | L T | L T | -- | L T | 1a |
| 18 | F/13 | Stroke | L P | L P | L P | L P | L P | L P | -- | LP | L P | 1a |
| 19 | F/15 | CA | L F | L F | L FT | L F | L F | -- | -- | LF | L F | 1a |
| 20 | F/8 | FCD | Neg | R TO* | R TPO | R TO | -- | RF,D* | RT | -- | R T | II |
| 21 | F/16 | TSC | MT | L FT* | MF | L FT | Bi F,D* | -- | -- | -- | L F | II |
| 22 | F/13 | Trauma | Neg | R O | R He | R O | -- | -- | -- | RO | R O | 1a |
| 23 | F/17 | TSC | MT | Bi FT* | MF | Bi FT | L F, D* | -- | RF,D* | -- | Bi F | II |
M = Male; F = Female; Neg = Negative; R = Right; L = Left; T = Temporal; F=Frontal; P = Parietal; O = Occipital; Bi = Bilateral; C = Center; He =hemisphere; Hi = Hippocampal; D = Deep brain area; MT = Multiple tubers; MF=Multi-focal; TSC = Tuberous sclerosis; FCD=Focal cortical dysplasia; MTS = Middle temporal sclerosis; CA = Cavernous Angiomas; ES = Engel Surgical Outcome Scale;
Mismatch with surgical resection;
No source.
2.2. MEG recording and MRI scan
The MEG recordings were obtained in a magnetically shielded room (MSR) using a whole head MEG system (VSM MedTech Systems Inc., Coquitlam, BC, Canada) in the MEG Center at CCHMC. Similar to our previous study [23], all MEG data were recorded with a noise cancellation of third order gradients. Before data acquisition commenced, a small coil was attached to the left and right pre-auricular points and nasion of each subject. These three coils were subsequently activated at different frequencies for measuring subjects’ head positions relative to the MEG sensors. The system allowed head localization to an accuracy of 1 mm [28, 29]. The tolerable limit of head movement during MEG recording was 5 millimeters (mm). The sampling rate of the MEG recordings for the present research was 4,000 Hz. At least two 120-second epochs of MEG data digitized at 4,000 Hz were recorded for each subject.
Three-dimensional Magnetization-Prepared Rapid Acquisition Gradient Echo (MP_RAGE) sequences were obtained for all participants with a 3T scanner (Siemens Medical Solutions, Malvern, PA). Similar our previous reports[28, 29], three fiduciary points were placed in identical locations to the positions of the three coils used in the MEG recordings to allow for an accurate co-registration of the two data sets. Subsequently, all anatomical landmarks digitized in the MEG study were made identifiable in the MR images.
2.3. Data preprocessing
MEG and clinical data were firstly de-identified for blind data analyses. Similar to previous reports [28, 29], all MEG data were visually inspected for artifacts and noise. For each subject, two minute data without artifacts were selected, preliminarily pre-processed and filtered (Butterworth filter, 3rd order, the slope was −24 dB/oct) for following quantitative analyses with MEG Processor [28, 29]. HFOs were analyzed in 80–250 Hz (ripples) and 250–600 Hz (fast ripples). Similarly, HFSs were analyzed in 80–250 Hz (spikelets) and 250–600 Hz (fast spikelets). Spikelets and fast spikelets are two new terms characterized in the present study for describing HFSs in two frequency bands. Figure 1 shows the workflow in details.
Figure 1. Workflow for preprocessing, analyzing, localizing and validating epileptic high frequency brain signals (HFBS) in MEG data.

After removing noise/artifacts and preprocessing, the left column shows the detection of non-oscillatory high frequency spikes (HFSs) while the right column shows the detection of oscillatory high frequency oscillations (HFOs). HFSs are analyzed and classified into spikelets and fast spikelets. HFOs are analyzed and classified into ripples and fast ripples. Spikelets/fast spikelets and ripples/fast ripples are localized and compared with epileptogenic zones (EZ) to identify and validate the epileptogenic signatures of HFBS.
2.4. Analyses of HFSs
HFSs were automatically detected with an artificial intelligence (AI) method[30]. Briefly, the MEG data, which included waveforms, spectrogram and source power, were used as input data for a stacked auto-encoding algorithms. The MEG input data were then recreated through hidden layers for the output data. The output data were then compared with clinical defined EZs (“gold standard”) to reinforce the weights to predict the accurate outcomes. The data analyses were performed blindly without supervising. To ensure the quality of the present study, we visually inspected all HFSs after AI detection. In this study, we used four criteria to detect HFSs: (1) Independent event with sharp waves; (2) peak amplitude was 3 times higher than the background activity; (3) No more than three oscillations in 10 milliseconds (5 ms before, 5 ms after); (4) predominantly appear in a group of sensors (not all sensors). We analyzed HFSs in two frequency bands, which were 80–250 Hz (spikelets) and 250–600 Hz (fast spikelets).
2.5. Analyses of HFOs
HFOs were automatically detected and quantified with an AI method, which has been described in a previous report [30]. To ensure the quality of the present study, we visually inspected all HFOs including ripples and fast ripples detected by AI for all subjects. The criteria for ripples and fast ripples were: (1) at least 4 oscillations standing out from the ongoing background activity; (2) oscillations were in the frequency ranges of 80–250 Hz (ripples) or 250–600 Hz (fast ripples); (3) having at least 10 ms inter-event interval;(4) visible in filtered and raw signals (without filtering). In accordance with the definition of HFOs proposed in previous reports[18, 31], if the ripples or fast ripples, which were automatically detected by AI, did not meet the aforementioned criteria, we manually excluded them from additional analysis.
2.6. Source localization
Sources of HFSs and HFOs were localized with accumulated source imaging [28, 29]. The details of the beamforming algorithms and steps were described in previous studies [28, 29]. Briefly, MEG and MRI were co-registered with three fiducial points. A 3D brain mask was created with MEG Processor for generating a realistic head model for computation of the forward solution [29]. The magnetic sources were then scanned and statistically determined with beamforming [28, 29].
2.7. Clinical EZs
EZs in epilepsy patients were preliminarily estimated by using clinical data obtained during preoperative workup for epilepsy surgery. Similar to previous reports [32], the clinical data included clinical history, scalp EEG, MRI, positron emission tomography-computed tomography (PET-CT) and invasive recordings. Invasive recordings included clinical stereo-electroencephalography (SEEG) and electrocorticography (ECoG) with subdural grid recordings to delineate the seizure onset zones. To confirm the seizure onset zones were the EZ, we also obtained post-operative assessments. Only seizure onset zones whose resection resulted in freedom from disabling seizures or almost seizure-free for at least one year after surgery (Engel Surgical Outcome Scale ≤ II; ILAE Outcome Scale ≤ 3) were considered to be clinical EZs.
2.8. Statistical analysis
Normality was checked with the Kolmogorov-Smirnov test, significance level was set at p < 0.05. False discovery rate (FDR) correction for multiple comparison was applied. The measurements of HFSs and HFOs were compared using the Student T-test. To exclude age/sex effect, we used analysis of variance (ANOVA) to analyze the measurements from the two groups of participants. All statistical analyses were performed in IBM SPSS software package version 22.0.0.0 and Microsoft Excel 2013.
3. Results
3.1. Characteristics of patients and controls
The demographic information for the 23 epilepsy patients in the present study are shown in Table 1(age range: 6–18 years; mean and standard deviation of age: 12.56±3.33 years; 12 females and 11 males). Though the patients had heterogeneous medical conditions, their EZs were clinically defined by invasive recordings and surgical outcomes. Healthy controls included age/gender matched children and adolescents (age range: 6–18 years; mean and standard deviation of age: 12.56±3.33 years; 12 females and 11 males). There were no significant differences between patient and control groups in age and gender (p > 0.05).
3.2. High frequency spikes
HFSs could be classified as spikelets (80–250 Hz) or fast spikelets (250–600 Hz). Spikelets were detected in 16 (16/23, 70%) epilepsy patients, and fast spikelets were detected in 11 (11/23, 48%) epilepsy patients. Figures 2 and 3 show examples of the waveforms and spectrograms of spikelets and fast spikelets in epilepsy patients. Figure 4 shows the spatial distribution of spectral power of spikelets and fast spikelets in an epilepsy patients. The spikelets were localized to EZs in 15 (15/16, 94%), and fast spikelets were localized to EZs in 11 (11/11, 100%) patients. Table 1 describes the exact locations of spikelets and fast spikelets. Figure 5 shows an example of sources of HFSs in an epilepsy patient.
Figure 2. Waveform of high frequency activity in MEG data recorded from a children with epilepsy (“Epilepsy”) and a typical developing child (“Normal”).
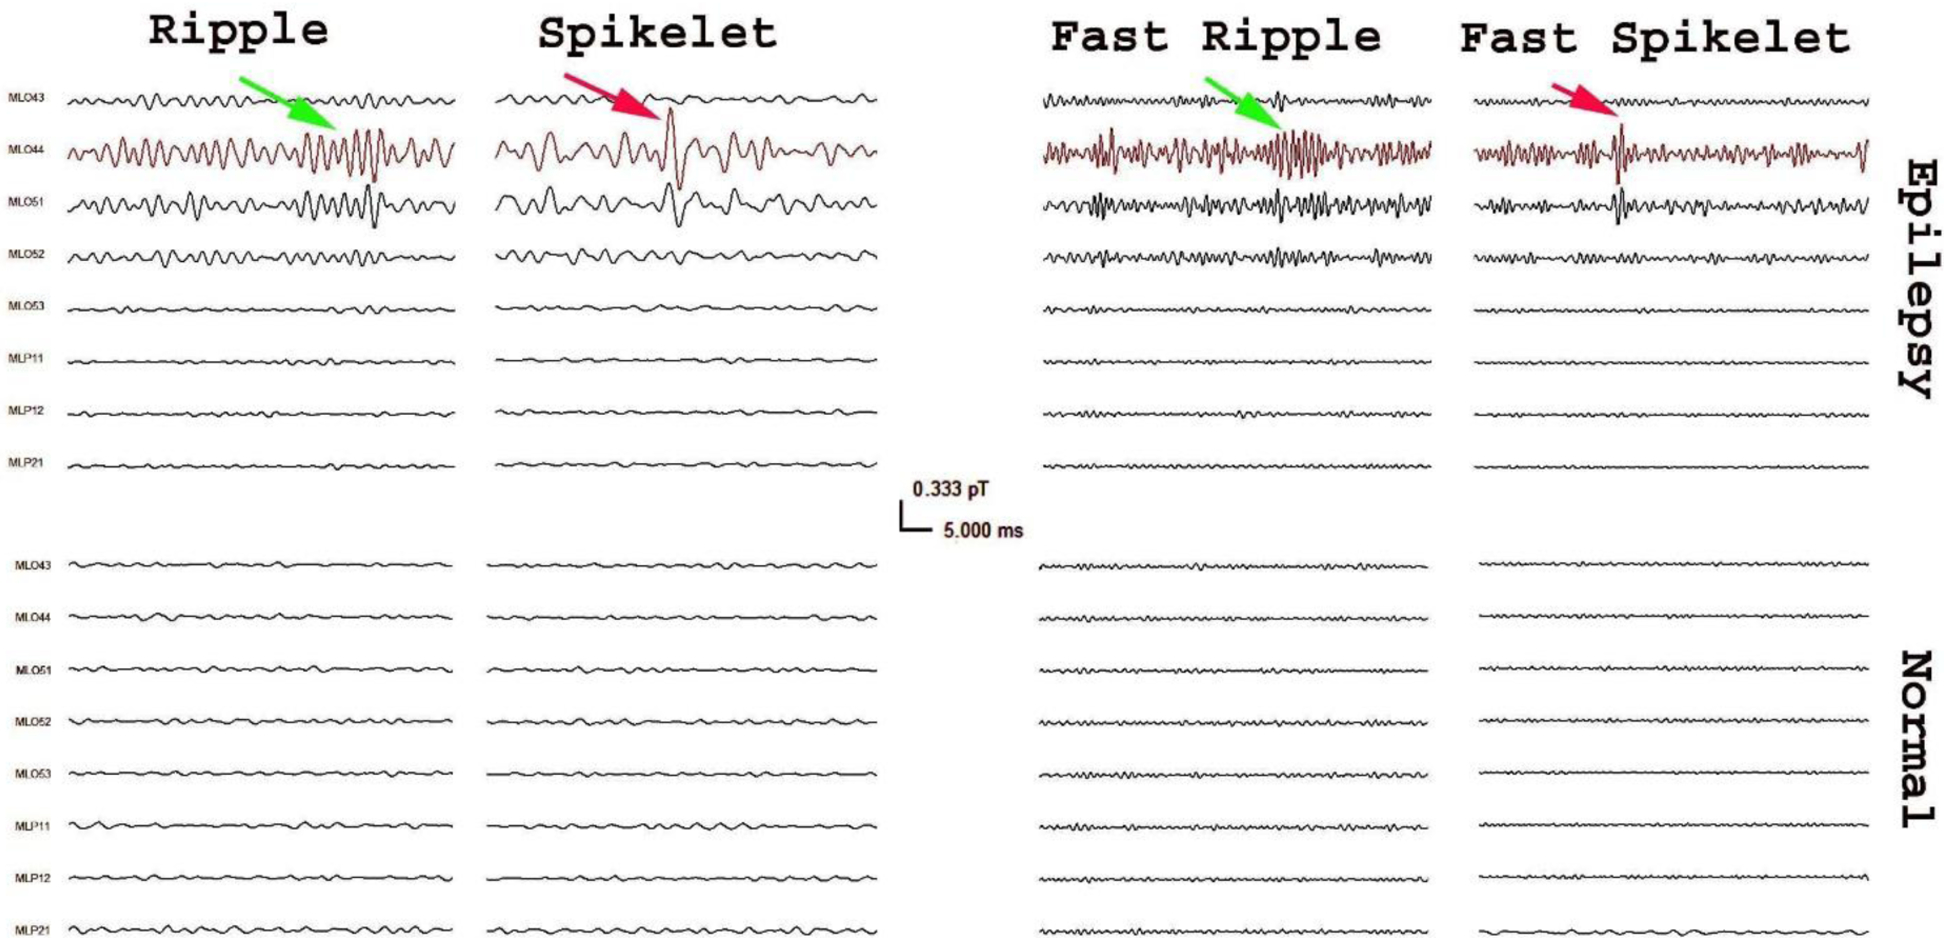
MEG signals in small group of sensors (e.g. ML044) from the epilepsy patient have high frequency activities that are visually identifiable (arrows). Careful observation can find that there are two types of high frequency activities: high frequency oscillations (green arrows) and spikes (red arrows). High frequency oscillations include ripples (80–250 Hz) and fast ripples (250–600 Hz). High frequency spikes also include spikelets (80–250 Hz) and fast spikelets (250–600Hz).
Figure 3. Time-frequency representation (spectrogram) of high frequency activity in MEG data from a children with epilepsy and a typical developing child.

In comparison to the healthy control (“Normal”), with the same color scale (in the middle), the spectrograms of MEG signals from the epilepsy patient (“Epilepsy”) show focal increases of spectral power. The spectrograms of ripples (80–250 Hz) and fast ripples (250–600 Hz) show fluctuation elevation of spectral power while spikelets (80–250 Hz) and fast spikelets (250–600 Hz) show bursts of spectral power.
Figure 4. Spectral contour maps of high frequency activity in MEG data from a children with epilepsy and a typical developing child.

In comparison to the healthy control (“Normal”), with the same color scale (in the bottom), the spectral contour maps of MEG signals from the epilepsy patient (“Epilepsy”) show focal increases of spectral power (green arrows). The contour maps of spikelets (80–250 Hz) and fast spikelets (250–600 Hz) are pointing to the similar regions. “L” indicates left; “R” indicates right; “F” indicates frontal.
Figure 5. Magnetic sources of high frequency spikes and high frequency oscillations in a patient with medically intractable epilepsy.

MEG waveform maps show that both spikelets (80–250 Hz) and ripples (80–250 Hz) are from the right occipital region. Magnetic source imaging of this patient show that the ripples and spikelets are localized to the right occipital cortex. Clinical invasive recordings and surgical outcomes indicate that the epileptogenic zone is also in the right occipital cortex. The magnetic sources of ripples and spikelets are overlapped with the epileptogenic zone.
There were no spikelets and fast spikelets detected in healthy controls (see Figures 2, 3 and 4). No source data of spikelets and fast spikes could be found for comparisons between epilepsy patients and healthy controls.
3.3. High frequency oscillations
HFOs could be classified into ripples (80–250 Hz) and fast ripples (250–600 Hz). Ripples were detected in 18 (18/23, 78%) epilepsy patients, and fast ripples were detected in 12 (12/23, 52%) epilepsy patients. The ripples were localized to EZs in 16 (16/18, 89%) patients, and fast ripples were localized to EZs in11 (11/12, 92%) patients. Table 1 describes the locations of HFOs.
Ripples were detected in 6 (6/23, 26%) healthy controls, and fast ripples were detected in 4 (4/23, 17%) healthy controls. The ripples and fast ripples in healthy subjects were localized to the precuneus (6/6, 100%; 2/4, 50%), the middle frontal cortices (4/6, 67%; 2/4, 50%), and deep brain areas (3/6, 50%; 2/4, 50%). Figures 2 and 3 show examples of the waveforms and spectrograms of ripples and fast ripples in epilepsy patients and normative waveforms in healthy subjects.
In comparison to healthy subjects, epilepsy patients have significantly higher odds ratio of having ripples (p < 0.0001) and fast ripples (p < 0.0002). The results of ANOVA indicated that the significant differences between epilepsy patients and healthy controls held even when the age, gender and channel group were taken as confounding factors for adjustment of statistical analysis.
3.4. Comparison of HFSs and HFOs
The waveform differences of HFSs and HFOs are shown in Figure 2. HFSs typically showed a sharp or spike wave while HFOs showed an oscillatory burst. The spectral differences of HFSs and HFOs are shown in Figures 3. In comparison to healthy controls, HFSs showed a single burst of spectral power while HFOs showed serial bursts of spectral power. Though both HFSs and HFOs were standing out from the ongoing background activity in terms of amplitude, HFSs appeared to be irregular and spiking signals, while HFOs appeared to be regular, oscillatory and periodic signals.
The major clinical difference between HFSs and HFOs was that HFSs were identified only in epilepsy patients while HFOs were identified in both epilepsy patients and healthy subjects. The observation is important because HFSs, which includes spikelets and fast spikelets, may be a more specific biomarkers for epilepsy in clinical applications. A combination of HFSs and HFOs localized EZs for 22 (22/23, 96%) epilepsy patients (Table 1). The results indicated that the combination of HFSs and HFOs provided complementary information for localization of EZs.
3.5. Comparison of HFSs and conventional low-frequency spikes
Conventional low-frequency epileptic spikes were identified in 23 (23/23, 100%) patients. Low-frequency epileptic spikes (3–80 Hz) were localized to EZs in 18 (18/23, 78%) patients using the traditional ECD (equivalent current dipole) localization. In comparison to the conventional low-frequency spikes, HFSs localized to EZs in 20 (20/23, 87%). Table 1 describes the localizations of conventional spikes and HFSs, which include spikelets and fast spikelets.
4. Discussion
The present study has systematically analyzed HFSs (spikelets/fast spikelets) and HFOs (ripples/fast ripples) in MEG data. The major findings of the present study are: (1) Epileptic brain generates both HFSs and HFOs; and (2) MEG HFSs are a new biomarker for epilepsy.
HFSs, which include spikelets and fast spikelets, are a new biomarker for epilepsy. HFOs, which include ripples and fast ripples, have been widely investigated and well characterized [22, 26, 27]. HFSs are significantly different from HFOs in terms of waveforms, spectrograms and clinical relevance. For example, HFSs occur irregularly, appearing as spike or poly spike waves standing out from the ongoing background activity. HFOs typically have at least four oscillations standing out from the ongoing background activity. In addition, HFOs can be identified in both epilepsy patients and healthy subjects. However, HFSs were only identified in epilepsy patients, not healthy subjects. We also have noted that HFSs and HFOs typically appear in the same group of MEG sensors. Source analyses have revealed that both HFSs and HFOs are highly localized to the EZs. Building on our observation, we consider HFSs and HFOs as two distinct types of epileptic biomarkers. A combination of HFSs and HFOs may provide complementary information for accurate localization of EZs.
The frequency-specific abnormalities have been noted in HFSs. We noted that fast spikelets in 250–600 Hz and spikelets in 80–250 Hz did not always appeared in the same time window or were localized to the same brain areas (see Table 1). It seems that fast spikelets in 250–600 Hz are more epileptogenic than spikelets in 80–250 Hz. Our observation is consistent with previous reports 7, 39–41. Previous invasive recordings have shown that the resection of electrical fast ripples correlates with favorable outcomes [33–36]. Our noninvasive MEG recording are consistent with these invasive findings, which indicate that MEG fast ripples are highly localized to EZs, whose removal is essential for favorable outcomes. To our knowledge, this is the first report showing that MEG fast spikelet are highly localized to EZs.
In comparison to many previous reports on HFBS in adult epilepsy[37, 38], the present study focused on high-frequency neuromagnetic signals in childhood epilepsy. Several features have been noted to be distinct in pediatric MEG data. First, high frequency epileptic activities are typically found within 10–15 minutes after the beginning of MEG recordings, which is probably due to children becoming drowsy or entering slow wave sleep. Second, HFSs and HFOs varied among channel groups in children with epilepsy. These variations might be a result of the variation of the spatial location of epileptic areas as well as the head position relative to the MEG sensor arrays. Third, HFSs and HFOs typically appear in a small groups of channels, which may be due to the weakness of MEG signals and/or the participants positioned their head closely to one side of dewar (sensor array). This suggests HFBS acquisition and characterization in children may differ from HFBS acquisition and characterization in adults.
HFBS have been well investigated in epilepsy with intracranial recordings[1–5]. Although invasive recordings provide solid and convincing HFBS data, this is an invasive surgical procedure, which can be burdensome and costly for patients. MEG recordings have several advantages. First, MEG is noninvasive, which is preferable to invasive intracranial recordings. Second, MEG tests enable the recordings of HFBS from healthy subjects, which provides the possibility to quantitatively investigate the abnormalities of HFBS in epilepsy by comparing to normative data. For example, the separation between physiological and pathological HFOs is an obstacle in applications of HFOs [34, 39–41]. Normative MEG data from healthy subjects may facilitate the separation between pathological (epileptic) and physiological HFOs. Of note, MEG detection of HFBS opens a new avenue for clinical applications of HFBS, including HFSs and HFOs, in pediatrics.
There is an increasing list of publications indicating that HFBS are a new biomarker for epilepsy[1–5], which may be superior to the conventional low frequency spikes (< 70 Hz) for guiding epilepsy surgery. However, conventional spikes are still the hallmark for epilepsy surgery [42]. If there was no conventional spike on MEG/EEG or invasive recordings, patients are typically not surgical candidates in current clinical practice. It is reasonable to postulate that HFSs and HFOs may contribute to the surgical treatment of epilepsy patients who do not have conventional spikes during routine clinical tests. The results of the present study support the notion that there is an urgent need for multi-center studies to determine if and how HFBS can be used with the conventional MEG spike for epilepsy surgery [3]. Multi-frequency analyses of spikes and HFBS may be the future for clinical management of epilepsy.
The present study detected HFOs and HFSs with methods developed in previous reports. Since in clinical practice, the recognition of HFOs sill mostly relies on visual inspection by trained experts. Therefore, we visually inspected all HFOs and HFSs. We noted that visual inspection was highly time-consuming. Therefore, strategies for automatic identification of HFSs and HFOs in MEG are necessary. An increasing list of publications on the development of methods for HFOs analysis and detection has been noted [31, 43, 44], there is a urgent need of developing methods for HFS analysis and detection.
5. Conclusions
The present study has demonstrated that MEG data recorded from children with epilepsy has HFSs, which can be sub-classified as spikelets (80–250 Hz) and fast spikelets (250–600 Hz). Sources of HFSs are highly localized to the clinical EZs, whose resection is essential for postoperative seizure freedom.
In comparison to HFOs, HFSs seems to be a more specific epileptogenic biomarker because HFSs were only detected in epilepsy patients while HFOs were detected in both epilepsy patients (pathological HFOs) and healthy controls (physiological HFOs). Pathological HFOs intermingling with physiological is a significant barrier hindering HFBS from wide clinical applications. If HFSs were specific pathological signals, which do not have the weakness of HFOs and shall play a key role in clinical management of epilepsy in the future.
Highlights.
Epileptic brain generates interictal high frequency spikes (HFSs) in 80–600 Hz
HFSs include spikelets (80–250 Hz) and fast spikelets (250–600 Hz)
HFSs are a new epileptogenic biomarker for localizing epileptogenic zones
HFSs can be noninvasively detected and localized by Magnetoencephalography
Acknowledgements
The authors would like to thank Drs. Douglas Rose and Nat Hemasilpin for MEG data acquisition and Drs. Kimberly Leiken, Yingying Wang and Mr. Kendall O’Brien for MRI scan.
Funding
This work is supported by Grant Number R21 NS104459 from the National Institute of Neurological Disorders and Stroke (NINDS), the National Institutes of Health (NIH). The normative database used in the present study was partially supported by Grant Numbers R21NS081420 and R21NS072817 from NINDS/NIH. This project described is partially supported by funding from the State of Ohio, Ohio Development Services Agency, Ohio Third Frontier, Grant Control No. TECG20170361 and TECG20190159. The software used in the project described is partially supported by Cincinnati Children’s Hospital Medical Center’s Innovation Fund.
Footnotes
Publisher's Disclaimer: This is a PDF file of an unedited manuscript that has been accepted for publication. As a service to our customers we are providing this early version of the manuscript. The manuscript will undergo copyediting, typesetting, and review of the resulting proof before it is published in its final form. Please note that during the production process errors may be discovered which could affect the content, and all legal disclaimers that apply to the journal pertain.
Declaration of Competing Interest
The authors declare that they have no conflict of interest related to the content of this article.
References
- [1].Worrell GA, Jerbi K, Kobayashi K, Lina JM, Zelmann R and Le Van Quyen M Recording and analysis techniques for high-frequency oscillations. Prog Neurobiol 2012; 98:265–278. [DOI] [PMC free article] [PubMed] [Google Scholar]
- [2].Bragin A, Engel J Jr. and Staba RJ High-frequency oscillations in epileptic brain. Current opinion in neurology 2010; 23:151–156. [DOI] [PMC free article] [PubMed] [Google Scholar]
- [3].Weiss SA, Berry B, Chervoneva I, Waldman Z, Guba J, Bower M, Kucewicz M, Brinkmann B, Kremen V, Khadjevand F, Varatharajah Y, Guragain H, Sharan A, Wu C, Staba R, Engel J Jr., Sperling M and Worrell G Visually validated semi-automatic high-frequency oscillation detection aides the delineation of epileptogenic regions during intraoperative electrocorticography. Clin Neurophysiol 2018; 129:2089–2098. [DOI] [PMC free article] [PubMed] [Google Scholar]
- [4].Zijlmans M, Huiskamp GM, Cremer OL, Ferrier CH, van Huffelen AC and Leijten FS Epileptic high-frequency oscillations in intraoperative electrocorticography: the effect of propofol. Epilepsia 2012; 53:1799–1809. [DOI] [PubMed] [Google Scholar]
- [5].Rampp S, Kaltenhauser M, Weigel D, Buchfelder M, Ingmar Blumcke I, Dorfler A and Stefan H MEG correlates of epileptic high gamma oscillations in invasive EEG. Epilepsia 2010; 51:1638–1642. [DOI] [PubMed] [Google Scholar]
- [6].Yin C, Zhang X, Chen Z, Li X, Wu S, Lv P and Wang Y Detection and localization of interictal ripples with magnetoencephalography in the presurgical evaluation of drug-resistant insular epilepsy. Brain Res 2019; 1706:147–156. [DOI] [PubMed] [Google Scholar]
- [7].Velmurugan J, Nagarajan SS, Mariyappa N, Mundlamuri RC, Raghavendra K, Bharath RD, Saini J, Arivazhagan A, Rajeswaran J, Mahadevan A, Malla BR, Satishchandra P and Sinha S Magnetoencephalography imaging of high frequency oscillations strengthens presurgical localization and outcome prediction. Brain 2019; 142:3514–3529. [DOI] [PMC free article] [PubMed] [Google Scholar]
- [8].van Klink N, Mooij A, Huiskamp G, Ferrier C, Braun K, Hillebrand A and Zijlmans M Simultaneous MEG and EEG to detect ripples in people with focal epilepsy. Clin Neurophysiol 2019; 130:1175–1183. [DOI] [PubMed] [Google Scholar]
- [9].Xiang J, Holowka S, Qiao H, Sun B, Xiao Z, Jiang Y, Wilson D and Chuang S Automatic localization of epileptic zones using magnetoencephalography. Neurol Clin Neurophysiol 2004; 2004:98. [PubMed] [Google Scholar]
- [10].Tamilia E, Park EH, Percivati S, Bolton J, Taffoni F, Peters JM, Grant PE, Pearl PL, Madsen JR and Papadelis C Surgical resection of ripple onset predicts outcome in pediatric epilepsy. Ann Neurol 2018; 84:331–346. [DOI] [PubMed] [Google Scholar]
- [11].van ‘t Klooster MA, van Klink NEC, Zweiphenning W, Leijten FSS, Zelmann R, Ferrier CH, van Rijen PC, Otte WM, Braun KPJ, Huiskamp GJM and Zijlmans M Tailoring epilepsy surgery with fast ripples in the intraoperative electrocorticogram. Ann Neurol 2017; 81:664–676. [DOI] [PubMed] [Google Scholar]
- [12].Zijlmans M, Jiruska P, Zelmann R, Leijten FS, Jefferys JG and Gotman J High-frequency oscillations as a new biomarker in epilepsy. Ann Neurol 2012; 71:169–178. [DOI] [PMC free article] [PubMed] [Google Scholar]
- [13].Engel J Jr., Bragin A, Staba R and Mody I High-frequency oscillations: what is normal and what is not? Epilepsia 2009; 50:598–604. [DOI] [PubMed] [Google Scholar]
- [14].Roehri N and Bartolomei F Are high-frequency oscillations better biomarkers of the epileptogenic zone than spikes? Curr Opin Neurol 2019; 32:213–219. [DOI] [PubMed] [Google Scholar]
- [15].Melani F, Zelmann R, Mari F and Gotman J Continuous High Frequency Activity: a peculiar SEEG pattern related to specific brain regions. Clin Neurophysiol 2013; 124:1507–1516. [DOI] [PMC free article] [PubMed] [Google Scholar]
- [16].Traub RD, Schmitz D, Maier N, Whittington MA and Draguhn A Axonal properties determine somatic firing in a model of in vitro CA1 hippocampal sharp wave/ripples and persistent gamma oscillations. Eur J Neurosci 2012; 36:2650–2660. [DOI] [PMC free article] [PubMed] [Google Scholar]
- [17].Valiante TA, Perez Velazquez JL, Jahromi SS and Carlen PL Coupling potentials in CA1 neurons during calcium-free-induced field burst activity. J Neurosci 1995; 15:6946–6956. [DOI] [PMC free article] [PubMed] [Google Scholar]
- [18].Tamilia E, Madsen JR, Grant PE, Pearl PL and Papadelis C Current and Emerging Potential of Magnetoencephalography in the Detection and Localization of High-Frequency Oscillations in Epilepsy. Front Neurol 2017; 8:14. [DOI] [PMC free article] [PubMed] [Google Scholar]
- [19].van Klink N, van Rosmalen F, Nenonen J, Burnos S, Helle L, Taulu S, Furlong PL, Zijlmans M and Hillebrand A Automatic detection and visualisation of MEG ripple oscillations in epilepsy. Neuroimage Clin 2017; 15:689–701. [DOI] [PMC free article] [PubMed] [Google Scholar]
- [20].Migliorelli C, Alonso JF, Romero S, Nowak R, Russi A and Mananas MA Automated detection of epileptic ripples in MEG using beamformer-based virtual sensors. Journal of neural engineering 2017; 14:046013. [DOI] [PubMed] [Google Scholar]
- [21].Toole C, Martinez-Juarez IE, Gaitanis JN, Sunderam S, Ding L, DiCecco J and Besio WG Source localization of high-frequency activity in tripolar electroencephalography of patients with epilepsy. Epilepsy Behav 2019; 101:106519. [DOI] [PubMed] [Google Scholar]
- [22].Jacobs J, Staba R, Asano E, Otsubo H, Wu JY, Zijlmans M, Mohamed I, Kahane P, Dubeau F, Navarro V and Gotman J High-frequency oscillations (HFOs) in clinical epilepsy. Prog Neurobiol 2012; 98:302–315. [DOI] [PMC free article] [PubMed] [Google Scholar]
- [23].Xiang J, Maue E, Fan Y, Qi L, Mangano FT, Greiner H and Tenney J Kurtosis and skewness of high-frequency brain signals are altered in paediatric epilepsy. Brain Communications 2020; 2. [DOI] [PMC free article] [PubMed] [Google Scholar]
- [24].Dyhrfjeld-Johnsen J, Berdichevsky Y, Swiercz W, Sabolek H and Staley KJ Interictal spikes precede ictal discharges in an organotypic hippocampal slice culture model of epileptogenesis. J Clin Neurophysiol 2010; 27:418–424. [DOI] [PMC free article] [PubMed] [Google Scholar]
- [25].Williams AJ and Sun QQ Cortical Layer and Spectrotemporal Architecture of Epileptiform Activity in vivo in a Mouse Model of Focal Cortical Malformation. Front Neural Circuits 2019; 13:2. [DOI] [PMC free article] [PubMed] [Google Scholar]
- [26].Jacobs J and Schonberger J In search of epileptic scalp high-frequency oscillations. Clin Neurophysiol 2019; 130:1172–1174. [DOI] [PubMed] [Google Scholar]
- [27].Jacobs J, LeVan P, Chander R, Hall J, Dubeau F and Gotman J Interictal high-frequency oscillations (80–500 Hz) are an indicator of seizure onset areas independent of spikes in the human epileptic brain. Epilepsia 2008; 49:1893–1907. [DOI] [PMC free article] [PubMed] [Google Scholar]
- [28].Xiang J, Korman A, Samarasinghe KM, Wang X, Zhang F, Qiao H, Sun B, Wang F, Fan HH and Thompson EA Volumetric imaging of brain activity with spatial-frequency decoding of neuromagnetic signals. J Neurosci Methods 2015; 239:114–128. [DOI] [PubMed] [Google Scholar]
- [29].Xiang J, Luo Q, Kotecha R, Korman A, Zhang F, Luo H, Fujiwara H, Hemasilpin N and Rose DF Accumulated source imaging of brain activity with both low and high-frequency neuromagnetic signals. Front Neuroinform 2014; 8:57. [DOI] [PMC free article] [PubMed] [Google Scholar]
- [30].Guo J, Yang K, Liu H, Yin C, Xiang J, Li H, Ji R and Gao Y A Stacked Sparse Autoencoder-Based Detector for Automatic Identification of Neuromagnetic High Frequency Oscillations in Epilepsy. IEEE transactions on medical imaging 2018; 37:2474–2482. [DOI] [PMC free article] [PubMed] [Google Scholar]
- [31].Zijlmans M, Worrell GA, Dumpelmann M, Stieglitz T, Barborica A, Heers M, Ikeda A, Usui N and Le Van Quyen M How to record high-frequency oscillations in epilepsy: A practical guideline. Epilepsia 2017; 58:1305–1315. [DOI] [PubMed] [Google Scholar]
- [32].Xiang J, Wang Y, Chen Y, Liu Y, Kotecha R, Huo X, Rose DF, Fujiwara H, Hemasilpin N, Lee K, Mangano FT, Jones B and DeGrauw T Noninvasive localization of epileptogenic zones with ictal high-frequency neuromagnetic signals. J Neurosurg Pediatr 2010; 5:113–122. [DOI] [PubMed] [Google Scholar]
- [33].Thomschewski A, Hincapie AS and Frauscher B Localization of the Epileptogenic Zone Using High Frequency Oscillations. Front Neurol 2019; 10:94. [DOI] [PMC free article] [PubMed] [Google Scholar]
- [34].Lee S, Issa NP, Rose S, Tao JX, Warnke PC, Towle VL, van Drongelen W and Wu S DC shifts, high frequency oscillations, ripples and fast ripples in relation to the seizure onset zone. Seizure 2020; 77:52–58. [DOI] [PMC free article] [PubMed] [Google Scholar]
- [35].Holler Y, Kutil R, Klaffenbock L, Thomschewski A, Holler PM, Bathke AC, Jacobs J, Taylor AC, Nardone R and Trinka E High-frequency oscillations in epilepsy and surgical outcome. A meta-analysis. Frontiers in human neuroscience 2015; 9:574. [DOI] [PMC free article] [PubMed] [Google Scholar]
- [36].Jacobs J, Zijlmans M, Zelmann R, Chatillon CE, Hall J, Olivier A, Dubeau F and Gotman J High-frequency electroencephalographic oscillations correlate with outcome of epilepsy surgery. Annals of neurology 2010; 67:209–220. [DOI] [PMC free article] [PubMed] [Google Scholar]
- [37].Gonzalez Otarula KA, von Ellenrieder N, Cuello-Oderiz C, Dubeau F and Gotman J High-Frequency Oscillation Networks and Surgical Outcome in Adult Focal Epilepsy. Ann Neurol 2019; 85:485–494. [DOI] [PubMed] [Google Scholar]
- [38].Frauscher B, Bartolomei F, Kobayashi K, Cimbalnik J, van ‘t Klooster MA, Rampp S, Otsubo H, Holler Y, Wu JY, Asano E, Engel J Jr., Kahane P, Jacobs J and Gotman J High-frequency oscillations: The state of clinical research. Epilepsia 2017; 58:1316–1329. [DOI] [PMC free article] [PubMed] [Google Scholar]
- [39].Matsumoto A, Brinkmann BH, Matthew Stead S, Matsumoto J, Kucewicz MT, Marsh WR, Meyer F and Worrell G Pathological and physiological high-frequency oscillations in focal human epilepsy. Journal of neurophysiology 2013; 110:1958–1964. [DOI] [PMC free article] [PubMed] [Google Scholar]
- [40].Frauscher B, von Ellenrieder N, Zelmann R, Rogers C, Nguyen DK, Kahane P, Dubeau F and Gotman J High-Frequency Oscillations in the Normal Human Brain. Ann Neurol 2018; 84:374–385. [DOI] [PubMed] [Google Scholar]
- [41].Cimbalnik J, Brinkmann B, Kremen V, Jurak P, Berry B, Gompel JV, Stead M and Worrell G Physiological and pathological high frequency oscillations in focal epilepsy. Ann Clin Transl Neurol 2018; 5:1062–1076. [DOI] [PMC free article] [PubMed] [Google Scholar]
- [42].Weiss SA Are spikes noninferior to high-frequency oscillations? Ann Neurol 2018; 83:870. [DOI] [PubMed] [Google Scholar]
- [43].Staba RJ, Wilson CL, Bragin A, Fried I and Engel J Jr. Quantitative analysis of high-frequency oscillations (80–500 Hz) recorded in human epileptic hippocampus and entorhinal cortex. Journal of neurophysiology 2002; 88:1743–1752. [DOI] [PubMed] [Google Scholar]
- [44].Roehri N, Pizzo F, Bartolomei F, Wendling F and Benar CG What are the assets and weaknesses of HFO detectors? A benchmark framework based on realistic simulations. PLoS One 2017; 12:e0174702. [DOI] [PMC free article] [PubMed] [Google Scholar]