

Abstract
The intestinal barrier is an essential component of innate host defense. The single layer of epithelial cells that line the intestine must balance barrier function with active, transcellular and diffusive, paracellular transport. Tight junctions, which link adjacent cells, form a selectively-permeable seal that defines both paracellular transport and barrier properties. Molecules can cross tight junctions by either of two distinct routes, termed pore and the leak pathways, that differ in capacity, charge-selectivity, size-selectivity, and responses to physiological and pathophysiological stimuli. A third intestinal permeability route, the unrestricted pathway, reflects loss of the epithelial barrier, as occurs with mucosal damage, is independent of paracellular and transcellular pathways, and is neither charge- nor size-selective. The most commonly-used approach for measuring intestinal permeability in vivo involves gavage of FITC-4 kDa dextran and analysis of the quantity recovered in serum. Unfortunately, this method cannot distinguish between leak and unrestricted pathways, as 4 kDa dextran can cross both. Moreover, 4 kDa dextran is too large to cross the pore pathway and, therefore, provides no information regarding this paracellular flux route. Here we describe a multiplex method that allows simultaneous, independent analysis of each pathway.
Keywords: intestinal permeability, gavage, barrier dysfunction, ion flux, macromolecular flux, paracellular flux, tight junction, pore pathway, leak pathway, unrestricted pathway, claudins
1. Introduction
The intestinal epithelial barrier is created by the single layer of epithelial cells that line the gastrointestinal tract [1]. This interface, which is the largest mucosal surface within the body, is the primary site at which the developing immune system interacts with foreign elements, including the microbiome [2–5]. Epithelial cells, whose lipid membranes are impermeant to many types of foreign materials, control contact between luminal materials and mucosal immune cells by regulating flux across the paracellular, or shunt, pathway [6–10] and by transcellular transport mediated by transcytosis [11, 12].
Although barrier function is emphasized most frequently, tight junctions within many organs, including the gut, must also be selectively-permeable. Paracellular ion and water flux are mediated by small trans-tight junction channels created by some members of the claudin protein family [13–16]. The critical nature of this selective permeability is demonstrated by perinatal death of knockout mice lacking claudins 2 and 15, which are essential for intestinal paracellular Na+ flux [17]. This high-capacity flux route (Fig. 1) through tight junction channels has been termed the pore pathway and is both charge- and size-selective [1, 18]. The charge-selectivity of channels formed by different claudins varies, but, most claudins form channels with maximal diameters of 6 – 8 Å [19–24].
Figure 1. Mechanisms of intestinal permeability.

Paracellular flux across tight junctions occurs by two different routes termed pore and the leak pathways. The pore pathway is a high-capacity, charge-selective route that regulates the passage of small molecules less than 8 Å in diameter. The leak pathway is a low-capacity, non-charge selective route for molecules up to 100 Å in diameter. When epithelial damage occurs the tight junction-independent, size-nonselective, charge-nonselective unrestricted pathway becomes the dominant route of intestinal permeability.
Functional modulation of the intestinal pore pathway occurs during development and disease as a consequence of regulated claudin isoform expression. For example, claudin-2 is normally expressed at high levels prior to weaning but is replaced by claudin-15 after transition to a solid diet [25, 26]. Claudin-2 expression is, however, elevated once again in the context of intestinal disease, including inflammatory and infectious disorders [27–30]. Although incompletely studied, this claudin-2 upregulation can be selectively induced by IL-13 and IL-22 [27, 28, 31] and can both promotes pathogen clearance, which is beneficial during enteric infection [28], and amplify immune responses, which is detrimental in immune-mediated colitis [32].
In contrast to the pore pathway, the leak pathway (Fig. 1) is not charge-selective and has a relatively low capacity. Although it is size-selective, the maximum diameter of the leak pathway is estimated to be ~100 Å, far greater than the pore pathway. Thus, small proteins and bacterial products, e.g., albumin and lipopolysaccharide, can traverse the epithelial barrier via the leak pathway but intact bacteria and viruses cannot. Intestinal epithelial leak pathway permeability is primarily regulated via the cytoskeleton as a result of myosin light chain kinase activation, which leads to phosphorylation of perijunctional myosin II regulatory light chain [33–36]. Unlike the pore pathway, a physical channel that defines the leak pathway has not been identified.
The final flux route that must be considered is the tight junction-independent unrestricted pathway (Fig. 1). This route exists only in the context of epithelial damage, i.e., there are no intercellular junctions when epithelial cells are lost. As might be expected, the unrestricted pathway has a high-capacity and is neither size- nor charge-selective [37].
In vivo assessment of intestinal permeability in rodents has relied on oral gavage of tracer molecules and subsequent detection of these within the blood [38–44]. These studies have primarily relied on low molecular weight, i.e., 3 kDa or 4 kDa dextrans, conjugated to fluorescent molecules such as fluorescein. Fluorescein itself has been used as a smaller probe [45]. Because fluorescein and small dextrans cross both leak and unrestricted pathways, increased serum recovery cannot distinguish between increased leak pathway permeability and mucosal damage, i.e., unrestricted pathway flux. Moreover, because these probes are too large to cross the pore pathway, they provide no information on regulation of this paracellular route. Thus, although many studies have noted a correlation between claudin-2 upregulation and increased flux of FITC-4 kDa dextran and therefore concluded that claudin-2 upregulation mediates 4 kDa dextran flux [46–49], this is incorrect.
This protocol uses 3 separate probes: creatinine (6 Å diameter), FITC-4 kDa dextran (28 Å diameter), and rhodamine-70 kDa dextran (120 Å diameter). Creatinine can traverse all three pathways, 4 kDa dextran is restricted to leak and unrestricted pathways, and 70 kDa dextran is limited to the unrestricted pathway. Thus, an increase in 4 kDa dextran flux accompanied by comparably increases in 70 kDa dextran flux can be recognized as representing increased unrestricted pathway permeability. In this case, where both probes cross the unrestricted pathway, it is important to recognize that increases in 4 kDa dextran serum recovery may be greater than those for 70 kDa dextran due to sieving properties, i.e., a very small object passes through a large channel more readily than an object only slightly smaller than the channel.
In contrast, increased 4 kDa dextran flux without increased 70 kDa dextran flux reflects leak pathway permeability. Changes in creatinine flux must similarly be interpreted in the context of 4 kDa and 70 kDa dextran recoveries. By using these 3 probes, it is possible to discriminate between tight junction-dependent pore and leak pathways as well as the tight junction-independent unrestricted pathway as mechanisms underlying changes in intestinal permeability in vivo.
2. Materials
2.1. Reagents
Anhydrous creatinine; Millipore-Sigma C4255
Fluorescein isothiocyanate (FITC)-4 kDa dextran; Millipore-Sigma FD4
Rhodamine B isothiocyanate-70 kDa dextran; Millipore-Sigma R9379
Enzyme-based creatinine assay kit (see Note 1)
10 kDa spin columns (see Note 2)
Ultrapure (18 MΩ) water
Sterile PBS: 140 mM NaCl, 10 mM sodium phosphate, pH 7.4
1” 22 Ga stainless-steel gavage needle with 1.25 mm ball tip; Braintree Scientific N-PK 002
Sterile 0.22 μm syringe filter
Sterile 10 ml and 1 ml syringes
Sterile 50 ml tubes
Sterile disposable glass micropipettes; Drummond 1-000-0500
Micro plasma collection tubes with 3.2% citrate anticoagulant; Sarstedt, 41.1506.002 (see Note 3)
96-well solid black polystyrene microplates (see Note 4)
Sterile anesthetic solution: 10 mg/ml ketamine, 1 mg/ml xylazine in 0.9% saline
2.2. Equipment
Microcentrifuge
Fluorescent plate reader (see Note 5)
37°C water bath
3. Methods
3.1. Probe preparation
Calculate the total volume required and the quantity needed for each probe. The probe stock, prepared in water, contains 100 mg/ml creatinine, 80 mg/ml FITC-4 kDa dextran, and 40 mg/ml rhodamine-70 kDa dextran (see Note 6).
Add probes and ultrapure water to a 50 ml conical tube and place in 37°C water bath (see Note 7).
Incubate the tube in the water bath. Swirl gently every 2–3 minutes to mix until the probes are completely dissolved, typically ~15 min.
Centrifuge the 50 ml tube at 500 × g for 5 minutes. Use a Pasteur pipette to resuspend and solubilize, if possible, any particulate pellet.
Filter into a fresh, sterile 50 ml tube using the 10 ml syringe and 0.22 μm filter.
Centrifuge the 50 ml tube at 500 × g for 1 minute to bring all of the probe solution to the tube bottom.
Remove 20 μl of probe for later use in standard preparation.
Use within 2 –3 hours of preparation. Do not store for later use.
3.2. Gavage (see Note 8 and Note 9)
Select mice for study (see Note 10).
In order to clear gastrointestinal contents, place mice in a fresh cage, without chow or bedding (see Note 11), 4 hours prior to gavage. Water should be provided during this time.
Draw 0.25 ml of gavage solution into a 1 ml syringe and attach a clean gavage needle. Point the needle upward and gently press the plunger to expel any air.
Scruff a mouse by holding the tail with one hand while grasping the skin at the nape of the neck (see Note 12).
Gently retract the neck and hold the mouse vertically.
Hold the syringe, with needle pointed upward, next to the mouse to assess the distance from the mouth to the xiphoid process (Fig. 2A). This is the distance to which the needle should be inserted into the mouse (see Note 13).
Carefully tilt the head of the mouse backwards so that the head, body and esophagus are aligned (see Note 14).
Gently push the needle over the tongue and to the back of the oral cavity. The mouse may try to lick the needle; continue advancing the needle until the ball tip touches the pharynx (see Note 15).
The mouse will start swallowing by reflex. It is important not to manually force the needle beyond the pharynx, as this will cause tissue damage (see Note 16). The gavage needle should easily slide along the esophagus (Fig. 2B).
Instill probe solution (see Note 17).
Record the exact time of gavage (see Note 18).
Gently withdraw the gavage needle.
Return the mouse to the cage. Water, but not chow, should be provided.
Watch the mouse until normal respiration and activity have returned (see Note 19).
Repeat with the next mouse (see Note 20).
Chow can be returned to the cage 90 minutes after gavage.
Figure 2. Probe gavage.

A. After restraining the mouse, hold the syringe with the needle pointed upward in order to assess the length to be inserted. B. The needle should be inserted into the proximal stomach.
3.3. Blood collection and plasma separation
-
1
30 minutes before blood collection, label plasma collection tubes with the identifier for each mouse and mark the level to which blood should be collected (see Note 21).
-
2
Anesthetize the mouse (see Note 22) about 2 hours and 50 minutes after gavage (see Note 23).
-
3
Hold the mouse tightly by the back of the neck, with sufficient force to slightly retract the skin of the head, with the thumb and either the index or middle finger.
-
4
Retract the eyelid and proptose the eye.
-
5
Place a glass micropipette at the lateral canthus of the eye under the nictitating membrane (Figure 3A).
-
6
Gently, press the micropipette against the orbital bone until blood begins to flow.
-
7
Fill the collection tube to the indicated line (Figure 3B; see Note 24).
-
8
Apply slight pressure on the eye after using a clean gauze pad (see Note 25).
-
9
To prevent coagulation, immediately mix the blood with the buffered sodium citrate solution by gently and thoroughly by inverting the tube 5–10 times. Do not mix vigorously, as this can result in hemolysis (see Note 26).
-
10
After blood has been collected from all mice, spin the collection tubes at 1,500 × g for 10 minutes at room temperature.
-
11
Transfer the plasma to new tubes. Take care not to disturb the cell pellet.
-
12
It is best to proceed with analysis immediately (see Note 27).
Figure 3. Blood collection.
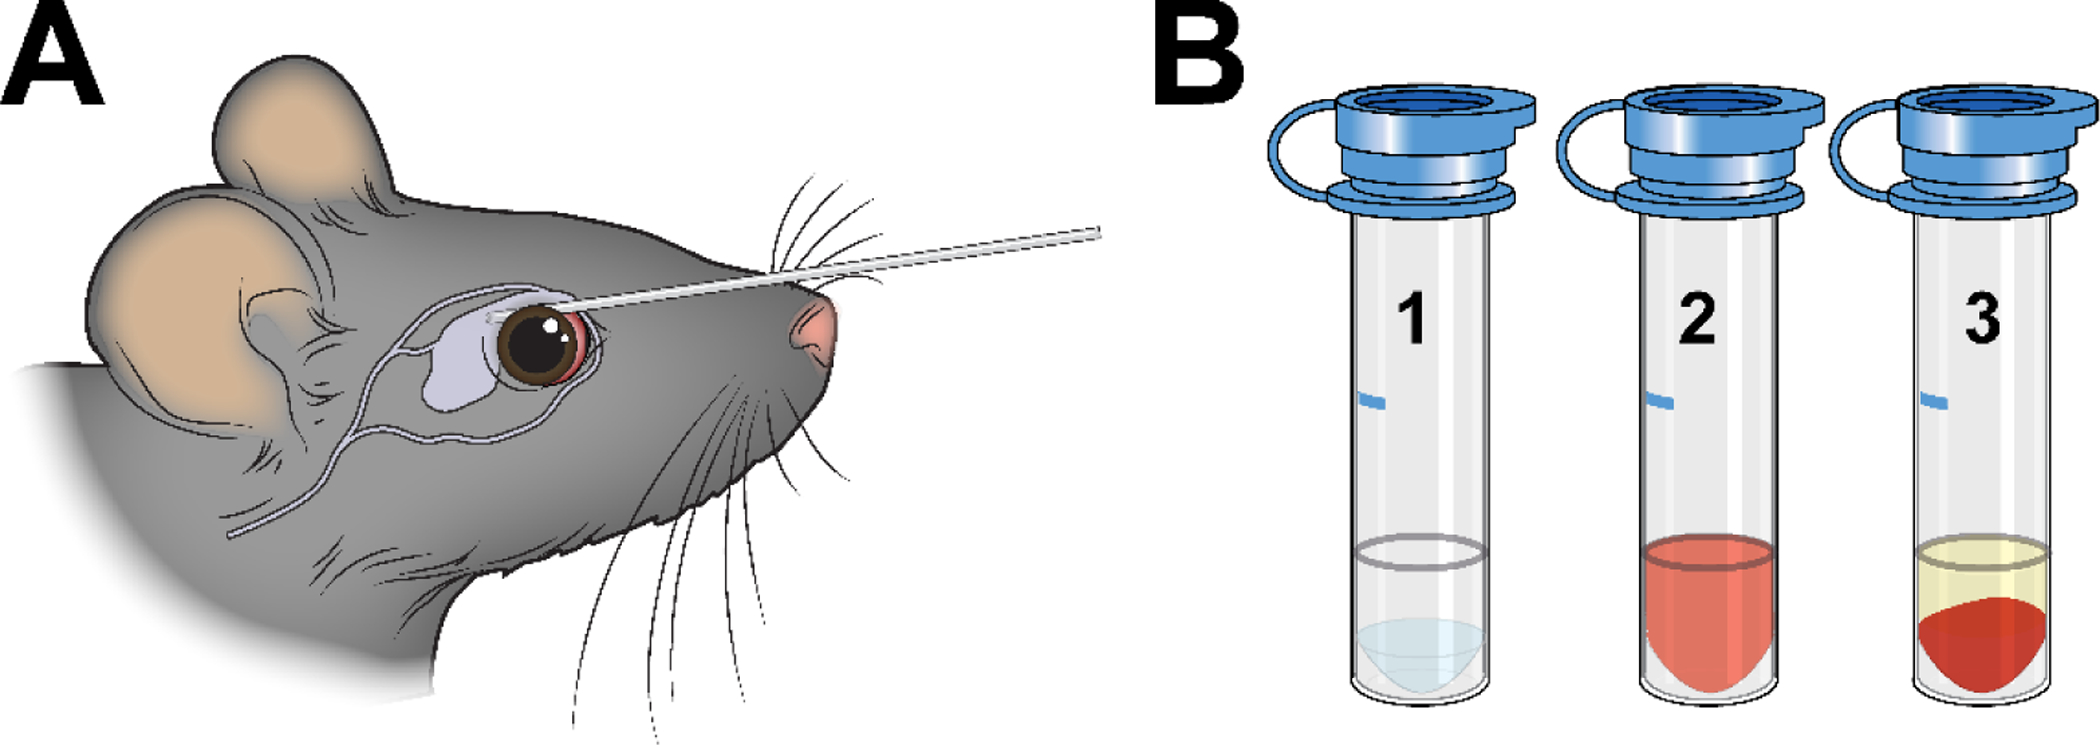
A. The tail vein and retro-orbital sinus can both be used as sites for blood collection. To retrieve blood from the retro-orbital sinus, a sterile micropipette is placed at the medial canthus and inserted. B. The volume of blood needed should be marked in advance on the side of each sodium citrate collection tube (1). After blood collection, the tube should be gently inverted to mix the blood and anticoagulant (2). Centrifugation leaves transparent, straw-colored plasma above a cellular pellet (3). If the plasma is red-tinged, hemolysis has occurred and the sample may yield inaccurate results.
3.4. Measuring plasma fluorescein and rhodamine B fluorescence
-
13
Prepare a standard curve from the probe stock solution (see Note 28). Add 435 μl of ultrapure water to 15 μl of probe stock to create a 1:30 dilution. Add 450 μl of water to 50 μl of the 1:30 dilution to create a 1:300 dilution. Use this to create a 1:3,000 dilution and repeat until 1:30,000, 1:300,000, and 1:3,000,000 dilutions have been prepared. Add 133 μl of water to 67 μl of the 1:30 dilution to create a 1:100 dilution. Add 450 μl of water to 50 μl of the 1:100 dilution to create a 1:1,000 dilution. Dilute this serially to 1:10,000, 1:100,000, and 1:1,000,000.
-
14
Pipette exactly 100 μl of each standard dilution into one well within the solid black microplate. Include water to determine background for the standard samples (see Note 29).
-
15
Pipette exactly 100 μl of each plasma sample into one well within the solid black microplate (see Note 30). Include plasma from the mouse, or mice, gavaged with water to determine background for the serum samples.
-
16
Read fluorescein and rhodamine B fluorescence at Ex/Em of 495 nm/525 nm and 555nm/585 nm, respectively, at gains of 50, 60, 70, 80, 90 and 100 for fluorescein, and 80, 90, 100, 110, 120 and 130 for rhodamine B (see Note 31).
3.5. Measuring plasma creatinine concentration
-
17
Prepare a 1 nmol/μl creatinine standard (see Note 32). Dilute 5 μl of the 100 mM creatinine standard provided in the kit with 495 μl of assay buffer (see Note 33 and Note 34).
-
18
Prepare a 0.1 nmol/μl dilution by adding 100 μl of the 1 nmol/μl standard to 900 μl of assay buffer.
-
19
Use the 0.1 nmol/μl standard to prepare a standard curve. Pipette 150 μl, 144 μl, 138 μl, 132 μl, 126 μl, and 120 μl of assay buffer into successive tubes or microplate wells and add 0 μl, 6 μl, 12 μl, 18 μl, 24 μl, and 30 μl of the 0.1 nmol/μl standard to the wells, respectively, to generate standards containing 0 nmol, 0.2 nmol, 0.4 nmol, 0.6 nmol, 0.8 nmol, and 1.0 nmol per 50 μl. Pipette 50 μl of each standard into successive wells of a solid black microplate (see Note 35).
-
20
Remove 75 μl of plasma from each well of the microplate and dilute 1:4 with 225 μl of water.
-
21
Load the diluted plasma into the 10 kDa spin columns and centrifuge at 10,000 × g for 10 minutes at 4 °C (see Note 36).
-
22
Recover 10 μl of filtered plasma and dilute 1:20 with 190 μl of room temperature assay buffer.
-
23
Pipette 50 μl of 1:20 diluted plasma into a well for the creatinine assay (see Note 37).
-
24
Prepare the creatinine reaction master mix. For each sample, add 43.6 μl of assay buffer, 2 μl of creatininase, 2 μl of creatinase, 2 μl of enzyme mix, and 0.4 μl of creatinine probe (see Note 38).
-
25
Add 50 μl of reaction master mix to each sample and standard well (see Note 39).
-
26
Mix gently using an orbital rotator.
-
27
Incubate for 1 hour at 37 °C (see Note 40).
-
28
Analyze the samples using the plate reader set to Ex/Em of 538 nm/587 nm (see Note 41) with gains of 50, 60, 70, 80, 90, and 100.
3.6. Calculations
-
29
Select readings to be used for each probe. Use results from the gain setting that resulted in RFU values of ~200 for the samples from the water-gavaged control mice (see Note 42).
-
30
Subtract the blank (water) value (background) from all standards.
-
31
For each probe, use the background-subtracted standard values and linear regression analysis to generate a straight line defining the relationship between fluorescent signal and probe concentration (see Note 43).
-
32
Use the regression equation to determine the concentration of each probe in each sample.
-
33
Subtract the values calculated for the control plasma sample from the mouse gavaged with water only from each experimental sample. If more than one control mouse was gavaged with water, the mean of these values should be used (see Note 44).
-
34
Calculate the mean and standard deviation of each probe’s concentration for the mice in the healthy control, probe-gavaged group (see Note 45).
-
35
Normalize the value of each probe in each mouse to the mean of the healthy control group.
-
36
Use the normalized values to calculate, for each mouse, the ratios of creatinine:70 kDa-dextran, 4 kDa-dextran:70 kDa-dextran, and creatinine:4 kDa-dextran (see Note 46).
-
37
Plot the normalized values for each probe and the three ratios for each mouse.
3.7. Data interpretation
Ideally, multiplex flux data should be assessed quantitatively and the apparent permeability coefficient, Papp, plotted as a function of probe size [53]. This calculation involves, at minimum, 3 variables; the measured probe transport rate, the initial concentration of probe at the apical cell surface, and the surface area assessed. Although transport, i.e., flux, rate can be measured, neither the initial concentration at the apical surface nor the surface area can be determined in this assay. Thus, in contrast to Ussing chamber analyses, Papp cannot be accurately calculated and plotted as a function of probe size [53–56]. We, therefore, typically present data normalized to values obtained in healthy control mice. It is, nevertheless, important to consider flux of each probe in concert with fluxes of the other probes.
After normalization, both individual values for each probe as well as ratios should be assessed. For example, increased creatinine flux without changes in 4 kDa or 70 kDa dextran fluxes would result in increased ratios of creatinine-to-70 kDa dextran and creatinine-to-4 kDa dextran but should have no effect on the 4 kDa dextran-to-70 kDa dextran ratio. These changes can be seen early in the course of C. rodentium infection (Fig. 4) [28]. This is accompanied by selective increases in expression of claudin-2, which forms paracellular channels that mediate pore pathway flux [1, 13–16, 28]. Notably, perijunctional myosin II regulatory light chain phosphorylation is not affected at this early time point.
Figure 4. Pore pathway upregulation after C. rodentium infection.

A. Colonic histology before and 2 days after C. rodentium infection. Bar= 20 μm. B. Pseudocolor image showing that C. rodeuntium infection increases both the number of cells expressing claudin-2 and the amount of claudin-2 expressed by each cell (arrows). Bar= 20 μm. C. Merged image of the same fields as B showing claudin-2 (red), phosphorylated MLC (white), Na-K ATPase (green), and nuclei (blue). Bar= 20 μm. D. In the absence of infection, flux of all three probes is limited. E. C. rodentium infection increases pore pathway permeability, which can be measured as creatinine flux. F. Creatinine flux before and 2 days after C. rodentium infection. G. 4 kDa dextran flux before and 2 days after C. rodentium infection. H. 70 kDa dextran flux before and 2 days after C. rodentium infection. I. The creatinine-to-70 kDa dextran ratio is increased, indicating pore pathway upregulation in this context. J. The 4 kDa dextran-to-70 kDa dextran ratio is unchanged. K. The creatinine-to-4 kDa dextran ratio is increased, indicating that the increase in creatinine flux does not reflect leak pathway upregulation. Mean ± SD, *p< 0.05.
In contrast to C. rodentium infection, flux across the leak pathway is dramatically upregulated in response to acute T cell activation (Fig. 5). This TNF-dependent permeability change is accompanied by increases in both creatinine and 4 kDa dextran flux without any change in 70 kDa dextran flux. The creatinine-to-70 kDa dextran and 4 kDa dextran-to-70 kDa dextran ratios are both increased, but, at most, only modest changes are seen in the creatinine-to-4 kDa dextran ratio. In this example, pore pathway permeability may be upregulated but cannot be readily detected, as creatinine and 4 kDa dextran can both traverse the leak pathway, and increased creatinine flux is therefore expected in isolated leak pathway upregulation. Thus, even if claudin-2 expression and pore pathway permeability were increased, those changes were functionally overwhelmed by the magnitude of leak pathway permeability increases. Small increases in the creatinine-to-4 kDa dextran ratio are expected due to the relative sizes of these probes and leak pathway sieving properties, but marked increases could indicate functionally significant increases in permeability of both pore and leak pathways. In vivo, TNF-induced diarrhea, which peaks at 2 – 3 hours and resolves within 5 hours [33, 34], is accompanied by increases in myosin II regulatory light chain phosphorylation (Fig. 5). Claudin-2 expression is not affected, consistent with other data indicating that claudin-2 upregulation does not occur until 12 –18 hours after administration of exogenous cytokines [28, 31, 32].
Figure 5. Leak pathway upregulation after T cell activation.
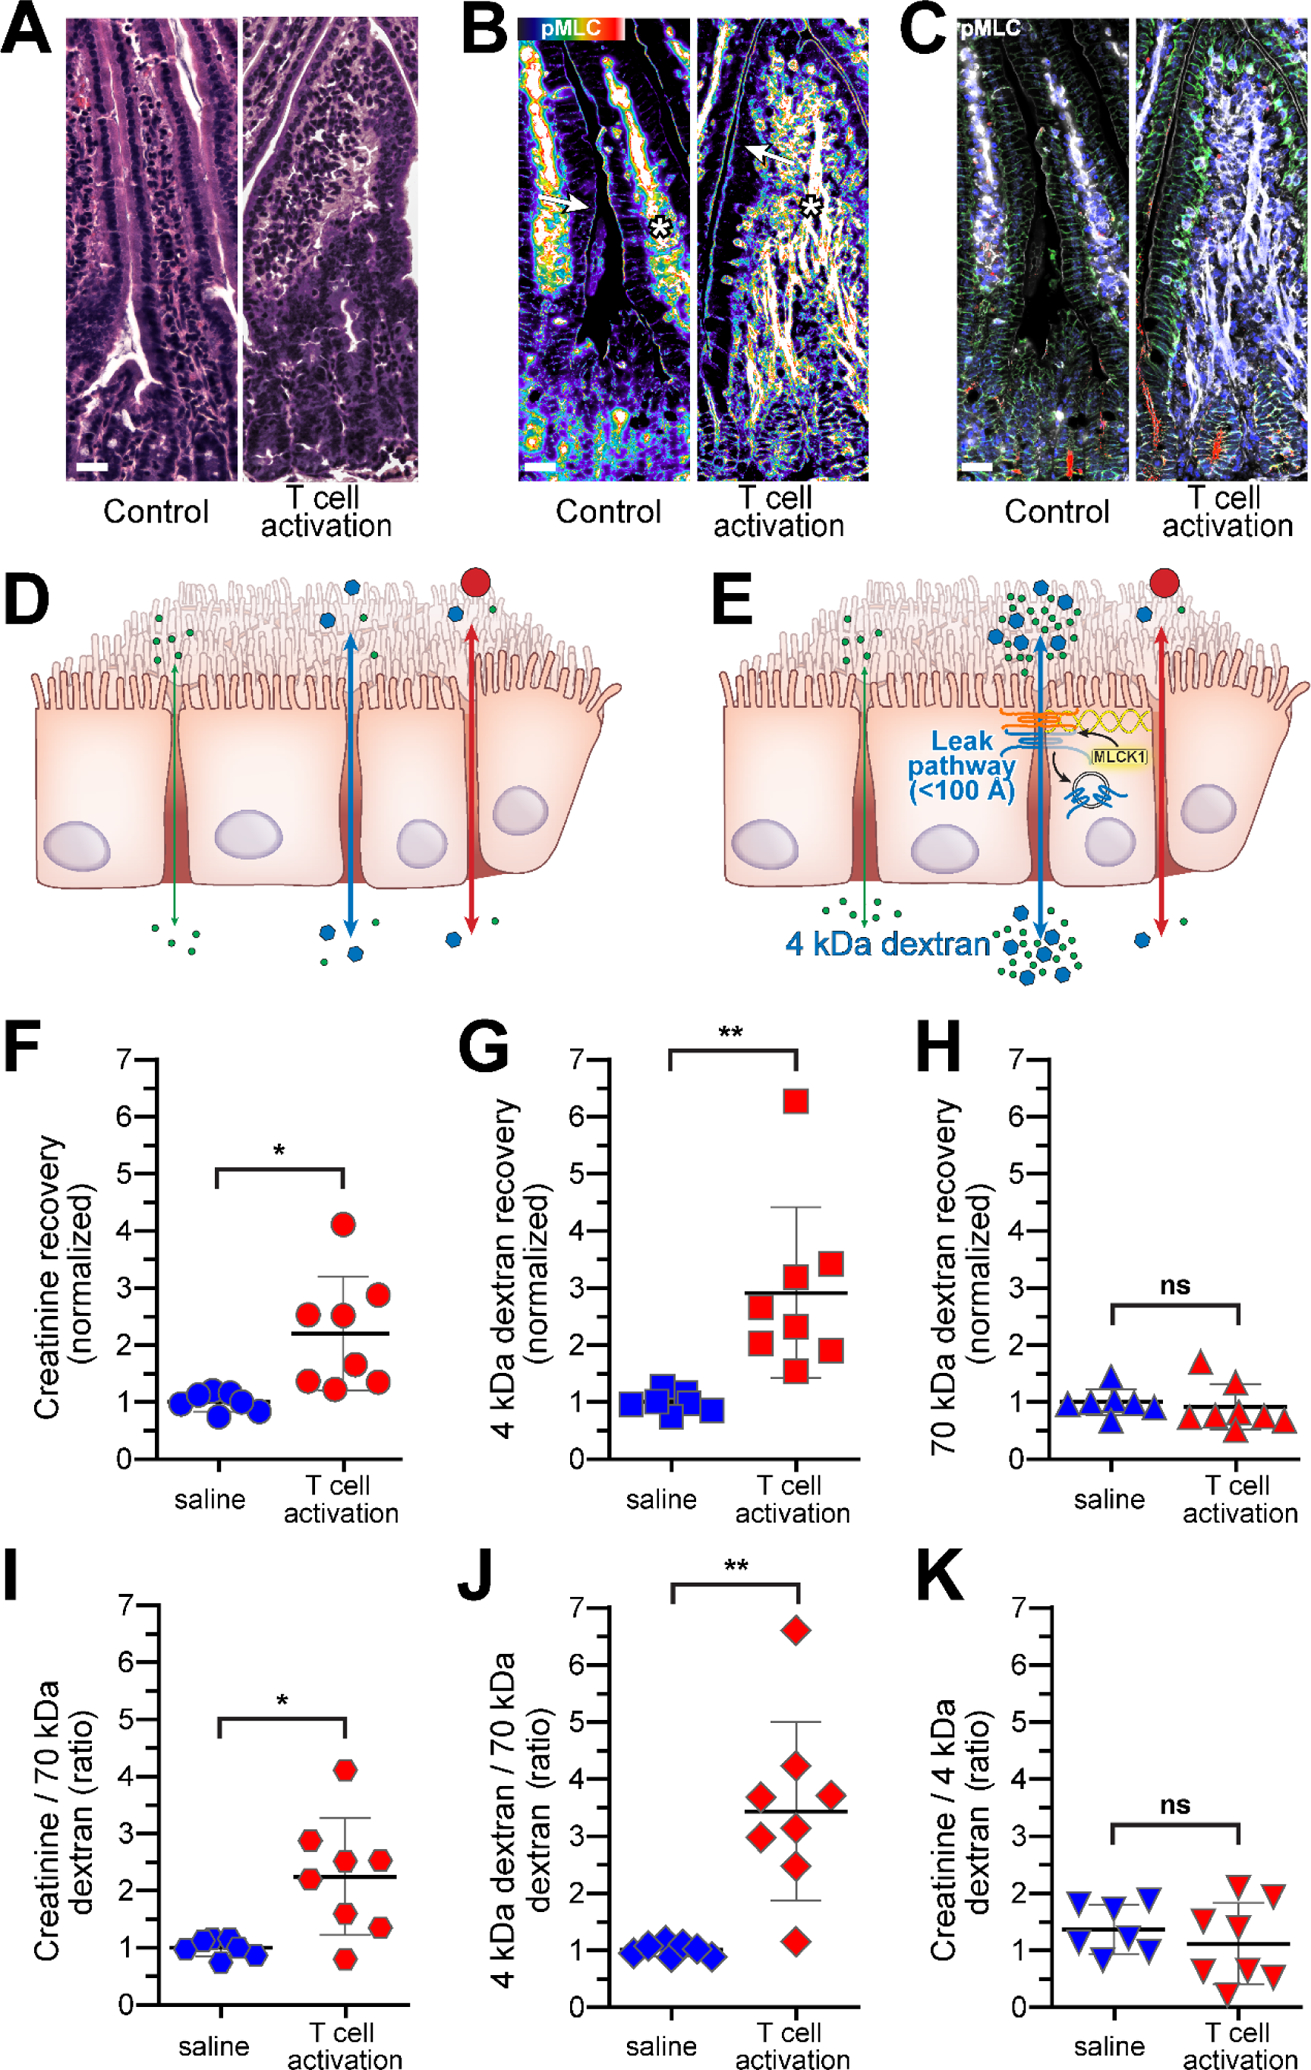
A. Jejunal histology before and 3 hours after anti-CD3 treatment. Bar= 20 μm. B. Pseudocolor image showing increased phosphorylated MLC (phosphoMLC) within epithelial cells, particularly at the perijunctional actomyosin ring (arrows). MLC phosphorylation is also increased within vascular endothelium (asterisks). Bar= 20 μm. C. Merged image of the same fields as B showing claudin-2 (red), phosphorylated MLC (white), Na-K ATPase (green), and nuclei (blue). Bar= 20 μm. D. Before T cell activation, flux of all three probes is limited. E. T cell activation increases leak pathway permeability, which can be measured as 4 kDa dextran flux. F. Creatinine flux before and 3 hours after T cell activation. G. 4 kDa dextran flux before and 3 hours after T cell activation. H. 70 kDa dextran flux before and 3 hours after T cell activation. I. The creatinine-to-70 kDa dextran ratio is increased. J. The 4 kDa dextran-to-70 kDa dextran ratio is increased, indicating leak pathway upregulation. K. The creatinine-to-4 kDa dextran ratio is not changed, indicating that the increase in creatinine flux reflects leak pathway upregulation. Mean ± SD, **p< 0.01, *p< 0.05.
Finally, the severe mucosal ulceration induced by dextran sulfate sodium (DSS) increases flux of all 3 probes (Fig. 6) but only small changes in the calculated ratios. Because the small probes creatinine and 4 kDa dextran, cross the unrestricted pathway more readily than 70 kDa dextran, changes in creatinine-to-70 kDa dextran and 4 kDa dextran to-70 kDa dextran fluxes be seen, but are smaller than increases in creatinine or 4 kDa dextran fluxes (Fig. 6). This pattern of change reflects increased unrestricted pathway permeability. Although pore and leak pathway permeabilities may be increased at sites without epithelial damage, these cannot typically be measured, as their impact is masked by the large changes in unrestricted pathway permeability and, as a result of sieving properties, much greater increases in flux of creatinine and 4 kDa dextran across the unrestricted pathway. Thus, when evaluating studies in which only 4 kDa dextran was used as a probe, large recovery increases should be interpreted as most likely representing damage rather than tight junction regulation.
Figure 6. Intestinal unrestricted pathway permeability increases after DSS-induced damage.

A. Colonic histology before and after 7 days of DSS treatment. Note the regenerative crypt epithelium (arrow) and area of ulceration (asterisk) associated with DSS-induced damage. Bar= 20 μm. B. Merged image showing CD3-positive (red) T cell infiltration after DSS-induced damage (asterisk) and early re-epithelialization of the ulcer (arrow). ZO-1 (white), occludin (green), and nuclei (blue) are shown for reference. Bar= 20 μm. C. Merged image showing early ulcer re-epithelialization (arrow) and reduced occludin (red) expression within damaged epithelium [60]. Phosphorylated MLC (white) is visible in endothelial cells within the ulcer bed (asterisk). Na-K ATPase (green) and nuclei (blue) are also shown. Bar= 20 μm. D. In the absence of damage, flux of all three probes is limited. E. DSS-induced mucosal damage increases unrestricted pathway permeability, which can be measured as 70 kDa dextran flux. F. Creatinine flux before and after DSS treatment. G. 4 kDa dextran flux before and after DSS treatment. H. 70 kDa dextran flux before and after DSS treatment. I. The creatinine-to-70 kDa dextran ratio is increased, but, because 70 kDa dextran flux is increased, the fold-increase is proportionally smaller than that of creatinine. This indicates that creatinine is permeating via the unrestricted pathway; it crosses this pathway far more efficiently than the much larger 70 kDa dextran probe. J. The 4 kDa dextran-to-70 kDa dextran ratio is increased nonsignificantly. This may have been statistically significant with a greater number of mice. The mean increase in the ratio is smaller than the mean increase in 4 kDa dextran flux. K. The creatinine-to-4 kDa dextran ratio is unchanged, indicating that the increases in both creatinine and 4 kDa dextran are both due to unrestricted pathway upregulation. Mean ± SD, **p< 0.01, *p< 0.05.
A final consideration is that these measurements can be affected by intestinal and extra-intestinal factors, including intestinal tissue architecture [57, 58], luminal flow rate [54, 59], and probe clearance by the kidneys and mononuclear phagocyte system. Changes in any of these factors may, therefore, impact measurements independent of changes in tight junction permeability or mucosal damage. Thus, while in vivo multiplex analysis of intestinal permeability is a powerful tool, it is critical that data be interpreted in the context of the underlying biology.
4. Notes
The colorimetric alkaline picrate-creatinine (Jaffe) reaction [50] can also be used to measure creatinine. However, this reaction is not entirely specific, and several substances present in blood, including glucose, ketones, protein, and bilirubin, can affect results [51]. We have, therefore, used an enzymatic assay in which creatininase (EC 3.5.2.10) converts creatinine to creatine, and creatinase (EC 3.5.3.3) generates sarcosine. Sarcosine is then is oxidized by sarcosine oxidase (EC 1.5.3.1) to produce hydrogen peroxide, glycine, and 5,10-CH2-tetrahydrofolate. The hydrogen peroxide then interacts with a colorimetric/fluorometric probe. Commercial versions of this kit are available from Millipore-Sigma (MAK079), Abcam (ab65340), and other vendors.
High protein concentrations can interfere with the creatinine assay. Plasma should be deproteinized using 10 kDa spin columns, e.g., Millipore-Sigma CLS431478 or Abcam ab93349.
Other anticoagulants, e.g., EDTA, can interfere with the creatinine enzymatic reaction and should not be used. Plasma, rather than serum, collection tubes should also be avoided as clotting activators can interfere with creatinine detection.
Solid wall black plates, e.g., Corning 3915, should be used to avoid crosstalk between wells during measurements.
The fluorescent plate reader should have adjustable gain and be equipped with monochromators or filters to allow fluorescent measurements at Ex/Em of 495 nm/525 nm, 555 nm/585 nm, and 538 nm/587 nm for detection of fluorescein, rhodamine B, and the creatinine assay reaction product.
Calculate the amount of probe solution required for the mice (0.25 ml/mouse) and add 0.5 ml to determine the total probe stock volume that should be prepared. The extra 0.5 ml of probe stock solution will allow for a small aliquot to be retained for preparing standards as well as loss during filtration and gavage.
Cover the tube with foil to protect the stock solution from light. From this point on, tubes containing probe solution should always be covered with foil.
Fasting, gavage, retro-orbital blood collection, and probe use must be approved by the Institutional Animal Care and Use Committee (IACUC). Blood can also be collected from the tail vein.
This method cannot be used to study mice with altered renal blood flow or clearance, as these will affect plasma probe concentrations.
If possible, a preliminary experiment should be performed at least one week prior to the actual experiment. Chow should be removed for 4 hours, after which the mice are gavaged with water instead of probe. Chow can be returned to the cage 90 minutes later. Mice can be returned to normal housing conditions 3 hours after gavage. This process acclimatizes the mice to handling, fasting, and gavage and will help minimize experimental noise due to stress [52].
Gastrointestinal chow, bedding, and other materials must be depleted because probe absorption by these substances can reduce the concentration available for flux. Although mice are coprophagic, the amount of stool ingested over this short period is not problematic. A wire-bottom cage should not be used because it causes significant stress that can affect intestinal permeability [52].
Staff must be trained in handling and gavage of mice. Improper techniques can induce stress that alters intestinal permeability and other physiological responses.
A 1” gavage needle will not reach the xyphoid process but is typically just long enough for use in adult C57BL/6 mice. Use of this needle prevents accidental over-insertion. Measuring the distance is critical if a longer needle or smaller mice are used.
For gavage, the head should be immobilized. To confirm proper restraint, hold a chow pellet next to the cheek. The mouse should not be able to turn its head to reach the pellet. Firm manual restraint reduces animal distress and also facilitates proper gavage technique.
The ball tip limits tissue damage and prevents accidental passage of the gavage needle into the trachea. Sedation or anesthesia should not be used, as they can increase the risk of aspiration pneumonia.
If the animal has difficulty breathing or there are any other signs of distress, the needle may be incorrectly placed. Withdraw and reposition the gavage needle before injecting the probe solution.
At least one healthy control mouse should be gavaged with water, without probes. If there is concern that the experimental model may affect basal plasma creatinine levels, separate water-only control(s) should be generated for these mice. Similarly, when genetically-modified mice are being studied, separate water-only controls should be created for each genotype until it is determined that basal plasma creatinine levels are unaffected by the genetic change(s).
Retro-orbital blood must be collected exactly 3 hours after gavage.
Mice that fail to recover completely may have aspirated probes. This can happen due to gavage needle misplacement or regurgitation. These mice cannot be used for the assay, as they did not receive a full probe dose and may need to be sacrificed.
Because both gavage and phlebotomy require time, allow at least 3 minutes between mice and keep track of exactly when each mouse was gavaged. The minimal interval between mice should be determined by the time required for phlebotomy.
Because the tubes contain 50 μl of citrate buffer, which dilutes the plasma, it is important that the volume collected be consistent between mice. The fill line should be drawn between 175 μl and 250 μl total volume, including the citrate buffer, depending on the size of the mice studied.
The anesthetic must be approved by the Institutional Animal Care and Use Committee and used under appropriate DEA permits. We typically induce anesthesia and analgesia using an i.p. injection containing ketamine (75 mg/kg) and xylazine (16 mg/kg).
The anesthetic dose should establish surgical plane anesthesia within ~ 8 minutes and maintain this until at least 15 minutes after administration. Surgical plane anesthesia can be assessed by the absence of reaction to toe or ear pinch.
If necessary, the small amount of blood that remains in the micropipette can be expelled into the collection tube using the bulb provided by the manufacturer.
A triple antibiotic ophthalmic ointment should be applied to the eye after phlebotomy.
Handle blood samples carefully to avoid hemolysis, which can release heme that fluoresces and interferes with measurements.
If the creatinine assay cannot be performed immediately, fluorescein and rhodamine fluorescences should be determined and plasma processed by dilution and spin column filtration before freezing. After filtration, samples can be stored at −80°C for up to 2 weeks and then thawed on ice before creatinine analysis. Because some creatinine degradation can occur, this approach should only be used if absolutely necessary.
-
The initial concentration of FITC-4 kDa dextran is 20 μM (80 mg/ml). Final concentrations of standards for fluorescein are 667 nM (1:30), 200 nM (1:100), 67 (1:300), 20 nM (1:1,000), 6.7 nM (1:3,000), 2 nM (1:10,000), 0.67 nM (1:30,000), 0.2 nM (1:100,000), 0.067 nM (1:300,000), 0.02 nM (1:1,000,000), 0.007 nM (1:3,000,000).
The initial concentration of rhodamine-70 kDa dextran is ~570 μM (40 mg/ml). Final concentrations of the standards are 19,000 nM (1:30), 5,700 nM (1:100), 1,900 nM (1:300), 570 nM (1:1,000), 190 nM (1:3,000), 57 nM (1:10,000), 19 nM (1:30,000), 5.7 nM (1:100,000), 1.9 nM (1:300,000), 0.57 nM (1:1,000,000), 0.19 nM (1:3,000,000).
Ideally, the standards should be diluted in plasma. However, the quantity of plasma needed would require exsanguination of more mice than is practical. Instead, a water blank is subtracted from the standards, and a plasma blank from the mouse gavaged with water is subtracted from the plasma samples.
In our experience, the variance between technical replicates is minimal in these assays. In order to limit the amount of blood taken from each mouse, technical replicates are not included. In contrast, permeabilities of mice can vary significantly and biological replicates are essential.
The wavelengths and gains used for measurements may need to be optimized for the plate reader used. We use a Biotek Synergy HT with dual monochromators. Preliminary experiments should be performed to confirm the absence of bleed-through between channels.
Skip ahead to plasma dilution and filtration if the creatinine assay will not be performed immediately. The standards should be prepared fresh at time of assay.
The creatinine assay buffer is provided in the kit. It must be stored at −20°C but thawed and warmed to room temperature before use. To avoid multiple freeze-thaw cycles, store the assay buffer in aliquots equal to the volume needed for one experiment.
The creatinine assay buffer is very viscous. Take care to pipette from just below the meniscus to prevent buffer accumulation on the outside of the tip. Pipette slowly to avoid inaccurate measurements.
It is best to plan the layout of standards and samples in the plate before beginning. Because the standards can be very bright, it may be helpful to have an empty row or column between standards and samples.
The spin columns eliminate larger proteins, which can interfere with the creatinine assay. It is critical to process the samples only after fluorescent dextrans have been measured since 70 kDa dextran will not pass freely through the spin column filter.
As noted above, technical replicates are not typically performed. New users may wish to verify consistency of technical replicates.
Prepare enough master mix for one extra reaction to allow for loss while pipetting the viscous solution.
New users may wish to prepare a small amount of master mix without creatininase (add 2 μl extra assay buffer instead) to assess background reactivity due to creatine or sarcosine within one or more samples. In our experience, this is not necessary routinely.
Cover the plate with foil to protect the fluorescent reaction product.
Although the creatinine assay reaction product fluorescence is qualitatively similar to rhodamine B, the creatinine assay reaction product intensity is far greater than that of any residual rhodamine B fluorescence that was not eliminated by the spin column.
RFU values for creatinine in probe-gavaged healthy mice are typically between 500 and 1,500. RFU values for fluorescent dextran in probe-gavaged healthy mice typically exceed ~1,000. The RFU of higher concentration standards may exceed the maximum measurable values for the gain settings selected as long as no experimental samples exceed maximum measurable values.
Because background has already been subtracted, the regression line should pass through the origin. The equation defining the relationship between fluorescent signal (x) and concentration (y) is defined by y=mx, where m represents the slope. If R2 is not 0.95 or greater, an error has been made, and the standard curve should be regenerated. Because creatinine standards are generated separately from the combined 4 kDa and 70 kDa dextran standards, errors should be present in the creatinine regression analysis only or both the fluorescein and rhodamine regression analyses. Problems with all three regression analyses indicate a global problem, such as plate reader malfunction or pipetting inaccuracy.
If more than one type of control, water-gavaged mouse is used, e.g., genetically-modified mice, the appropriate control should be used for each experimental sample, including healthy controls.
These values will be normalized in the next step. If raw values, i.e., actual probe concentrations, are needed, corrections for dilution with citrate buffer at time of blood collection and each subsequent dilution must be included.
Because normalized values are used, the healthy control group should have a mean of 1.0 for each ratio.
Acknowledgements
We thank Drs. Pei-Yun Tsai, Preeti Raju, Pawin Pongkorpsakol, Peter Steinhagen, Daniel R. Clayburgh, and other previous members of our laboratory for their contributions to development of these methods. We are indebted to Ms. Tiffany S. Davanzo (Slaybaugh Studios) for her beautiful illustrations and Ms. Heather Marlett (Nationwide Histology) for her outstanding tissue preparation.
Support
This work was supported by NIH grants to JRT (R01DK61931, R01DK68271, R24DK099803) and the Harvard Digestive Disease Center (P30DK034854).
Footnotes
Conflicts of interest
JRT is a cofounder of and hold shares in Thelium Therapeutics.
References
- 1.Turner JR. (2009) Intestinal mucosal barrier function in health and disease. Nat Rev Immunol; 9:799–809. doi: 10.1038/nri2653 [DOI] [PubMed] [Google Scholar]
- 2.Peterson LW, Artis D. (2014) Intestinal epithelial cells: regulators of barrier function and immune homeostasis. Nat Rev Immunol; 14:141–53. doi: 10.1038/nri3608 [DOI] [PubMed] [Google Scholar]
- 3.McDole JR, Wheeler LW, McDonald KG et al. (2012) Goblet cells deliver luminal antigen to CD103+ dendritic cells in the small intestine. Nature; 483:345–9. doi: 10.1038/nature10863 [DOI] [PMC free article] [PubMed] [Google Scholar]
- 4.Niess JH, Brand S, Gu X et al. (2005) CX3CR1-mediated dendritic cell access to the intestinal lumen and bacterial clearance. Science; 307:254–8. doi: 10.1126/science.1102901 [DOI] [PubMed] [Google Scholar]
- 5.Lai NY, Musser MA, Pinho-Ribeiro FA et al. (2020) Gut-innervating nociceptor neurons regulate Peyer’s patch microfold cells and SFB levels to mediate salmonella host defense. Cell; 180:33–49 e22. doi: 10.1016/j.cell.2019.11.014 [DOI] [PMC free article] [PubMed] [Google Scholar]
- 6.Farquhar M, Palade G. (1963) Junctional complexes in various epithelia. J Cell Biol; 17:375–412 [DOI] [PMC free article] [PubMed] [Google Scholar]
- 7.Kottra G, Fromter E. (1983) Functional properties of the paracellular pathway in some leaky epithelia. J Exp Biol; 106:217–29 [DOI] [PubMed] [Google Scholar]
- 8.Furuse M, Hata M, Furuse K et al. (2002) Claudin-based tight junctions are crucial for the mammalian epidermal barrier: a lesson from claudin-1-deficient mice. J Cell Biol; 156:1099–111. doi: 10.1083/jcb.200110122 [DOI] [PMC free article] [PubMed] [Google Scholar]
- 9.Umeda K, Ikenouchi J, Katahira-Tayama S et al. (2006) ZO-1 and ZO-2 independently determine where claudins are polymerized in tight-junction strand formation. Cell; 126:741–54. doi: 10.1016/j.cell.2006.06.043 [DOI] [PubMed] [Google Scholar]
- 10.Otani T, Nguyen TP, Tokuda S et al. (2019) Claudins and JAM-A coordinately regulate tight junction formation and epithelial polarity. J Cell Biol; 218:3372–3396. doi: 10.1083/jcb.201812157 [DOI] [PMC free article] [PubMed] [Google Scholar]
- 11.Nelms B, Dalomba NF, Lencer W. (2017) A targeted RNAi screen identifies factors affecting diverse stages of receptor-mediated transcytosis. J Cell Biol; 216:511–525. doi: 10.1083/jcb.201609035 [DOI] [PMC free article] [PubMed] [Google Scholar]
- 12.Ko SY, Pegu A, Rudicell RS et al. (2014) Enhanced neonatal Fc receptor function improves protection against primate SHIV infection. Nature; 514:642–5. doi: 10.1038/nature13612 [DOI] [PMC free article] [PubMed] [Google Scholar]
- 13.Amasheh S, Meiri N, Gitter AH et al. (2002) Claudin-2 expression induces cation-selective channels in tight junctions of epithelial cells. J Cell Sci; 115:4969–76. doi: 10.1242/jcs.00165 [DOI] [PubMed] [Google Scholar]
- 14.Van Itallie CM, Fanning AS, Anderson JM. (2003) Reversal of charge selectivity in cation or anion-selective epithelial lines by expression of different claudins. Am J Physiol Renal Physiol; 285:F1078–84. doi: 10.1152/ajprenal.00116.2003 [DOI] [PubMed] [Google Scholar]
- 15.Weber CR, Liang GH, Wang Y et al. (2015) Claudin-2-dependent paracellular channels are dynamically gated. Elife; 4:e09906. doi: 10.7554/eLife.09906 [DOI] [PMC free article] [PubMed] [Google Scholar]
- 16.Li J, Zhuo M, Pei L et al. (2014) Comprehensive cysteine-scanning mutagenesis reveals claudin-2 pore-lining residues with different intrapore locations. J Biol Chem; 289:6475–84. doi: 10.1074/jbc.M113.536888 [DOI] [PMC free article] [PubMed] [Google Scholar]
- 17.Wada M, Tamura A, Takahashi N et al. (2013) Loss of claudins 2 and 15 from mice causes defects in paracellular Na+ flow and nutrient transport in gut and leads to death from malnutrition. Gastroenterology; 144:369–80. doi: 10.1053/j.gastro.2012.10.035 [DOI] [PubMed] [Google Scholar]
- 18.Anderson JM, Van Itallie CM. (2009) Physiology and function of the tight junction. Cold Spring Harb Perspect Biol; 1:a002584. doi: 10.1101/cshperspect.a002584 [DOI] [PMC free article] [PubMed] [Google Scholar]
- 19.Colegio OR, Van Itallie C, Rahner C et al. (2003) Claudin extracellular domains determine paracellular charge selectivity and resistance but not tight junction fibril architecture. Am J Physiol Cell Physiol; 284:C1346–54. doi: 10.1152/ajpcell.00547.2002 [DOI] [PubMed] [Google Scholar]
- 20.Colegio OR, Van Itallie CM, McCrea HJ et al. (2002) Claudins create charge-selective channels in the paracellular pathway between epithelial cells. Am J Physiol Cell Physiol; 283:C142–7. doi: 10.1152/ajpcell.00038.2002 [DOI] [PubMed] [Google Scholar]
- 21.Van Itallie CM, Holmes J, Bridges A et al. (2008) The density of small tight junction pores varies among cell types and is increased by expression of claudin-2. J Cell Sci; 121:298–305. doi: 10.1242/jcs.021485 [DOI] [PubMed] [Google Scholar]
- 22.Angelow S, Yu AS. (2009) Structure-function studies of claudin extracellular domains by cysteine-scanning mutagenesis. J Biol Chem; 284:29205–17. doi: 10.1074/jbc.M109.043752 [DOI] [PMC free article] [PubMed] [Google Scholar]
- 23.Tanaka H, Yamamoto Y, Kashihara H et al. (2016) Claudin-21 has a paracellular channel role at tight junctions. Mol Cell Biol; 36:954–64. doi: 10.1128/MCB.00758-15 [DOI] [PMC free article] [PubMed] [Google Scholar]
- 24.Rosenthal R, Gunzel D, Piontek J et al. (2020) Claudin-15 forms a water channel through the tight junction with distinct function compared to claudin-2. Acta Physiol (Oxf); 228:e13334. doi: 10.1111/apha.13334 [DOI] [PubMed] [Google Scholar]
- 25.Holmes JL, Van Itallie CM, Rasmussen JE et al. (2006) Claudin profiling in the mouse during postnatal intestinal development and along the gastrointestinal tract reveals complex expression patterns. Gene Expr Patterns; 6:581–8. doi: 10.1016/j.modgep.2005.12.001 [DOI] [PubMed] [Google Scholar]
- 26.Ong M, Yeruva S, Sailer A et al. (2020) Differential regulation of claudin-2 and claudin-15 expression in children and adults with malabsorptive disease. Lab Invest; 100:483–490. doi: 10.1038/s41374-019-0324-8 [DOI] [PMC free article] [PubMed] [Google Scholar]
- 27.Heller F, Florian P, Bojarski C et al. (2005) Interleukin-13 is the key effector Th2 cytokine in ulcerative colitis that affects epithelial tight junctions, apoptosis, and cell restitution. Gastroenterology; 129:550–64. doi: 10.1016/j.gastro.2005.05.002 [DOI] [PubMed] [Google Scholar]
- 28.Tsai PY, Zhang B, He WQ et al. (2017) IL-22 upregulates epithelial claudin-2 to drive diarrhea and enteric pathogen clearance. Cell Host Microbe; 21:671–681 e4. doi: 10.1016/j.chom.2017.05.009 [DOI] [PMC free article] [PubMed] [Google Scholar]
- 29.Luettig J, Rosenthal R, Barmeyer C et al. (2015) Claudin-2 as a mediator of leaky gut barrier during intestinal inflammation. Tissue Barriers; 3:e977176. doi: 10.4161/21688370.2014.977176 [DOI] [PMC free article] [PubMed] [Google Scholar]
- 30.Wu RL, Vazquez-Roque MI, Carlson P et al. (2017) Gluten-induced symptoms in diarrhea-predominant irritable bowel syndrome are associated with increased myosin light chain kinase activity and claudin-15 expression. Lab Invest; 97:14–23. doi: 10.1038/labinvest.2016.118 [DOI] [PMC free article] [PubMed] [Google Scholar]
- 31.Weber CR, Raleigh DR, Su L et al. (2010) Epithelial myosin light chain kinase activation induces mucosal interleukin-13 expression to alter tight junction ion selectivity. J Biol Chem; 285:12037–46. doi: 10.1074/jbc.M109.064808 [DOI] [PMC free article] [PubMed] [Google Scholar]
- 32.Raju P, Shashikanth N, Tsai PY et al. (2020) Inactivation of paracellular cation-selective claudin-2 channels attenuates immune-mediated experimental colitis in mice. J Clin Invest; 130:5197–5208. doi: 10.1172/JCI138697 [DOI] [PMC free article] [PubMed] [Google Scholar]
- 33.Marchiando AM, Shen L, Graham WV et al. (2010) Caveolin-1-dependent occludin endocytosis is required for TNF-induced tight junction regulation in vivo. J Cell Biol; 189:111–26. doi: 10.1083/jcb.200902153 [DOI] [PMC free article] [PubMed] [Google Scholar]
- 34.Clayburgh DR, Barrett TA, Tang Y et al. (2005) Epithelial myosin light chain kinase-dependent barrier dysfunction mediates T cell activation-induced diarrhea in vivo. J Clin Invest; 115:2702–15. doi: 10.1172/JCI24970 [DOI] [PMC free article] [PubMed] [Google Scholar]
- 35.Zolotarevsky Y, Hecht G, Koutsouris A et al. (2002) A membrane-permeant peptide that inhibits MLC kinase restores barrier function in in vitro models of intestinal disease. Gastroenterology; 123:163–72. doi: 10.1053/gast.2002.34235 [DOI] [PubMed] [Google Scholar]
- 36.Wang F, Graham WV, Wang Y et al. (2005) Interferon-gamma and tumor necrosis factor-alpha synergize to induce intestinal epithelial barrier dysfunction by up-regulating myosin light chain kinase expression. Am J Pathol; 166:409–19. doi: 10.1016/s0002-9440(10)62264-x [DOI] [PMC free article] [PubMed] [Google Scholar]
- 37.Su L, Nalle SC, Shen L et al. (2013) TNFR2 activates MLCK-dependent tight junction dysregulation to cause apoptosis-mediated barrier loss and experimental colitis. Gastroenterology; 145:407–15. doi: 10.1053/j.gastro.2013.04.011 [DOI] [PMC free article] [PubMed] [Google Scholar]
- 38.Purandare S, Offenbartl K, Westrom B et al. (1989) Increased gut permeability to fluorescein isothiocyanate-dextran after total parenteral nutrition in the rat. Scand J Gastroenterol; 24:678–82. doi: 10.3109/00365528909093108 [DOI] [PubMed] [Google Scholar]
- 39.Dawson PA, Huxley S, Gardiner B et al. (2009) Impaired intestinal function in the hyposulphataemic NaS1 null mouse. Gut. 10.1136/gut.2007.147595 [DOI] [PubMed] [Google Scholar]
- 40.Novosad VL, Richards JL, Phillips NA et al. (2013) Regional susceptibility to stress-induced intestinal injury in the mouse. Am J Physiol Gastrointest Liver Physiol; 305:G418–26. doi: 10.1152/ajpgi.00166.2013 [DOI] [PubMed] [Google Scholar]
- 41.Roxas JL, Koutsouris A, Bellmeyer A et al. (2010) Enterohemorrhagic E. coli alters murine intestinal epithelial tight junction protein expression and barrier function in a Shiga toxin independent manner. Lab Invest. 10.1038/labinvest.2010.91 [DOI] [PMC free article] [PubMed] [Google Scholar]
- 42.Gerlach K, Hwang Y, Nikolaev A et al. (2014) TH9 cells that express the transcription factor PU.1 drive T cell-mediated colitis via IL-9 receptor signaling in intestinal epithelial cells. Nat Immunol; 15:676–86. doi: 10.1038/ni.2920 [DOI] [PubMed] [Google Scholar]
- 43.Rawat M, Nighot M, Al-Sadi R et al. (2020) IL1B Increases Intestinal Tight Junction Permeability by Up-regulation of MIR200C-3p, Which Degrades Occludin mRNA. Gastroenterology; 159:1375–1389. doi: 10.1053/j.gastro.2020.06.038 [DOI] [PMC free article] [PubMed] [Google Scholar]
- 44.Meisel M, Hinterleitner R, Pacis A et al. (2018) Microbial signals drive pre-leukaemic myeloproliferation in a Tet2-deficient host. Nature; 557:580–584. doi: 10.1038/s41586-018-0125-z [DOI] [PMC free article] [PubMed] [Google Scholar]
- 45.Nalle SC, Zuo L, Ong M et al. (2019) Graft-versus-host disease propagation depends on increased intestinal epithelial tight junction permeability. J Clin Invest; 129:902–914. doi: 10.1172/JCI98554 [DOI] [PMC free article] [PubMed] [Google Scholar]
- 46.Bird L (2014) T cells: IL-9 breaks down barriers. Nat Rev Immunol; 14:432. doi: 10.1038/nri3709 [DOI] [PubMed] [Google Scholar]
- 47.Kissoon-Singh V, Moreau F, Trusevych E et al. (2013) Entamoeba histolytica exacerbates epithelial tight junction permeability and proinflammatory responses in Muc2(−/−) mice. Am J Pathol; 182:852–65. doi: 10.1016/j.ajpath.2012.11.035 [DOI] [PubMed] [Google Scholar]
- 48.Zhang YG, Lu R, Xia Y et al. (2018) Lack of Vitamin D Receptor Leads to Hyperfunction of Claudin-2 in Intestinal Inflammatory Responses. Inflamm Bowel Dis. doi: 10.1093/ibd/izy292 [DOI] [PMC free article] [PubMed] [Google Scholar]
- 49.Ahmad R, Chaturvedi R, Olivares-Villagomez D et al. (2014) Targeted colonic claudin-2 expression renders resistance to epithelial injury, induces immune suppression, and protects from colitis. Mucosal Immunol; 7:1340–53. doi: 10.1038/mi.2014.21 [DOI] [PMC free article] [PubMed] [Google Scholar]
- 50.Folin O, Morris JL. (1914) On the determination of creatinine and creatine in urine. Journal of Biological Chemistry; 17:469–473. doi: 10.1016/s0021-9258(18)88386-7 [DOI] [Google Scholar]
- 51.den Elzen WPJ, Cobbaert CM, Klein Gunnewiek JMT et al. (2018) Glucose and total protein: unacceptable interference on Jaffe creatinine assays in patients. Clin Chem Lab Med; 56:e185–e187. doi: 10.1515/cclm-2017-1170 [DOI] [PubMed] [Google Scholar]
- 52.Meddings JB, Swain MG. (2000) Environmental stress-induced gastrointestinal permeability is mediated by endogenous glucocorticoids in the rat. Gastroenterology; 119:1019–28. doi: 10.1053/gast.2000.18152 [DOI] [PubMed] [Google Scholar]
- 53.Pongkorpsakol P, Turner JR, Zuo L. (2020) Culture of intestinal epithelial cell monolayers and their use in multiplex macromolecular permeability assays for in vitro analysis of tight junction size selectivity. Curr Protoc Immunol; 131:e112. doi: 10.1002/cpim.112 [DOI] [PMC free article] [PubMed] [Google Scholar]
- 54.Fihn BM, Sjoqvist A, Jodal M. (2000) Permeability of the rat small intestinal epithelium along the villus-crypt axis: effects of glucose transport. Gastroenterology; 119:1029–36. doi: 10.1053/gast.2000.18148 [DOI] [PubMed] [Google Scholar]
- 55.Pappenheimer JR, Renkin EM, Borrero LM. (1951) Filtration, diffusion and molecular sieving through peripheral capillary membranes; a contribution to the pore theory of capillary permeability. Am J Physiol; 167:13–46. doi: 10.1152/ajplegacy.1951.167.1.13 [DOI] [PubMed] [Google Scholar]
- 56.Bassingthwaighte JB. (2006) A practical extension of hydrodynamic theory of porous transport for hydrophilic solutes. Microcirculation; 13:111–8. doi: 10.1080/10739680500466384 [DOI] [PMC free article] [PubMed] [Google Scholar]
- 57.Menzies IS, Laker MF, Pounder R et al. (1979) Abnormal intestinal permeability to sugars in villous atrophy. Lancet; 2:1107–9. doi: 10.1016/s0140-6736(79)92507-8 [DOI] [PubMed] [Google Scholar]
- 58.Arrieta MC, Bistritz L, Meddings JB. (2006) Alterations in intestinal permeability. Gut; 55:1512–20. doi: 10.1136/gut.2005.085373 [DOI] [PMC free article] [PubMed] [Google Scholar]
- 59.Hollander D (1992) The intestinal permeability barrier. A hypothesis as to its regulation and involvement in Crohn’s disease. Scand J Gastroenterol; 27:721–6. doi: 10.3109/00365529209011172 [DOI] [PubMed] [Google Scholar]
- 60.Kuo WT, Shen L, Zuo L et al. (2019) Inflammation-induced occludin downregulation limits epithelial apoptosis by suppressing caspase-3 expression. Gastroenterology; 157:1323–1337. doi: 10.1053/j.gastro.2019.07.058 [DOI] [PMC free article] [PubMed] [Google Scholar]