

Abstract
Studies of occipital cortex plasticity in blindness provide insight into how intrinsic constraints interact with experience to determine cortical specialization. We tested the cognitive nature and anatomical origins of occipital responses during non-verbal, non-spatial auditory tasks. In a go/no-go task, congenitally blind (N=23) and sighted (N=24) individuals heard rapidly occurring (<1/sec) non-verbal sounds and made one of two button presses (frequent-go 50%, infrequent-go 25%) or withheld a response (no-go, 25%). Rapid and frequent button presses heighten response selection/inhibition demands on the no-go trials: In sighted and blind adults a right-lateralized prefrontal (PFC) network responded most to no-go trials, followed by infrequent-go and finally frequent-go trials. In the blind group only, a right-lateralized occipital network showed the same response profile and laterality of occipital and PFC responses was correlated across blind individuals. A second experiment with spoken sentences and equations (N=16) found that the no-go sensitive occipital network is distinct from previously identified occipital responses to spoken language. Finally, in resting-state data (N=30 blind, N=31 blindfolded sighted), no-go responsive ‘visual’ cortex of blind relative to sighted participants was more synchronized with PFC and less synchronized with primary auditory and sensory-motor cortices. No-go responsive occipital cortex showed higher synchrony with no-go responsive PFC than language responsive inferior frontal cortex. We conclude that in blindness, a right-lateralized occipital network responds to non-verbal executive processes, including response selection. These results suggest that connectivity with fronto-parietal executive networks is a key mechanism for plasticity in blindness.
Keywords: Plasticity, Blindness, Executive Function, Executive Demand, Response Selection, Pluripotency
Introduction
Studies of sensory loss provide insight into how experience and intrinsic constraints shape cortical function. In blindness, ‘visual’ cortices are active during auditory and tactile tasks (e.g., Sadato et al., 1996; Wanet-Defalque et al., 1988). The precise cognitive and anatomical nature of these effects remain uncertain. A growing number of studies find that ‘visual’ cortices of blind individuals respond to linguistic stimuli (Abboud and Cohen, 2019; Amedi et al., 2003; Amalric et al., 2017; Bedny et al., 2011; Crollen et al., 2019; Kanjlia et al., 2016; Lane et al., 2015; Röder et al., 2002). For example, in blind individuals, ‘visual’ cortices are active during verb production and sentence comprehension and activity increases with the grammatical complexity of sentences (Amedi, Raz, Pianka, Malach, & Zohary, 2003; Lane et al., 2015; Röder et al., 2002). Language-responsive ‘visual’ areas also show enhanced resting-state functional connectivity with language-responsive frontal regions in blindness (Liu et al., 2007; Yu et al., 2008; Bedny et al., 2011; Burton et al., 2014; Wang et al., 2014; Deen et al., 2015; Kanjlia et al., 2016; Abboud and Cohen, 2019; Crollen et al., 2019).
At the same time, subsets of the ‘visual’ cortex are also active during tasks that involve non-verbal and non-symbolic stimuli (Kujala et al., 1995a, 1995b, 1997; Liotti et al., 1998; Weaver and Stevens, 2007). A classic example comes from oddball target detection paradigms, in which participants hear a series of tones and respond when they detect an occasional deviant (e.g., Huettel and McCarthy, 2004). In such tasks, ‘visual’ cortices of blind but not sighted individuals, respond to oddball stimuli (Kujala et al., 1995a, 1995b, 1997; Liotti et al., 1998; Weaver and Stevens, 2007). The cognitive nature of these responses and their relationship to occipital responses to language is uncertain.
One possibility is that activity in oddball-responsive ‘visual’ regions during oddball detection tasks reflect low-level sensory processing of the deviant stimuli, such as auditory processing for deviant tones. Since oddball tones are highly salient, sensory processing may be enhanced for these stimuli in early auditory cortices (A1) and these enhancements may then be transmitted to deafferented ‘visual’ networks (Opitz et al., 2002; Liebenthal et al., 2003; Weaver and Stevens, 2007; Klinge et al., 2010). Alternatively, since most prior studies in blindness require participants to respond to oddball stimuli (e.g. with a button press), ‘visual’ cortex responses to oddball stimuli could reflect sensorimotor feedback emanating from sensorimotor cortices (Kujala et al., 1995a, 1995b, 1997; Liotti et al., 1998; Weaver and Stevens, 2007). Finally, oddball responses in visual cortices could be related to executive demands of the oddball detection paradigm, rather than auditory stimulus processing or sensorimotor feedback. Previous studies in sighted individuals find that stimuli that are infrequent and require a distinct response tax response selection demands and elicit heightened activity in executive demand networks in fronto-parietal cortices (Konishi et al., 1998; Garavan et al., 1999; Liddle et al., 2001; Menon et al., 2001; Mostofsky et al., 2003; Barber et al., 2013). Heightened ‘visual’ cortex responses to oddball stimuli could, therefore, reflect response selection demands stemming from fronto-parietal executive function networks.
Preliminary support for the response selection hypothesis comes from the observation that, in oddball detection paradigms, subsets of the ‘visual’ cortex in blind individuals respond more to behaviorally relevant (attended) than unattended oddball stimuli, suggesting that higher-cognitive processes are at play (Kujala et al., 1995a, 1995b; Mitchell et al., 2005; Weaver and Stevens, 2007). In addition, ERP studies with blind individuals find that, like prefrontal and parietal cortices, the timing of occipital responses to oddball stimuli is late relative to the auditory cortex (300–400 ms post-stimulus compared to 150 ms post-stimulus) (Kujala et al., 1995b). Moreover, peak responses to oddball stimuli shift posteriorly from frontal (200 ms post-stimulus) to parietal (200–300 ms) to occipital (300–450 ms) regions in blind individuals, suggesting that occipital responses to oddball stimuli may stem from top-down feedback (Liotti et al., 1998).
In the current study, we used task-based and resting-state fMRI to test the hypothesis that in blindness, parts of the ‘visual’ cortex become sensitive to response selection demands and enhance functional connectivity with fronto-parietal executive control networks. We chose go/no-go variant of the auditory oddball detection paradigm (Chikazoe et al., 2009) to test the predictions that regions of the ‘visual’ cortex of blind individuals are sensitive to response selection demands 1) above and beyond stimulus saliency and 2) even in the absence of sensorimotor feedback resulting from a button press. In this paradigm, participants hear rapidly occurring (>1/sec) non-verbal sounds to which they press a button as quickly as possible (‘go’ condition). On a subset of trials (25%), participants hear a ‘no-go’ sound to which they withhold a button press (‘no-go’ condition). Rapid frequent button presses result in a prepotent tendency to press the button and tax response selection mechanisms on no-go trials. In such tasks in sighted groups, participants make more errors of commission (going on no-go trials) than omission (not going on go-trials), and no-go trials produce elevated activity in a right-lateralized prefrontal network (Konishi et al., 1998; Garavan et al., 1999; Liddle et al., 2001; Menon et al., 2001; Mostofsky et al., 2003; Barber et al., 2013). By contrast, sensorimotor cortices are more active during ‘go’ trials, since only these trials require a button press (Garavan et al., 1999; Liddle et al., 2001; Mostofsky et al., 2003). If the functional profile of blind individuals’ ‘visual’ cortex is more similar to that of prefrontal response selection networks, as opposed to sensorimotor cortices, this would support the hypothesis that ‘visual’ cortex activity in the go/no-go task is related to executive demands and not to sensorimotor feedback related to the button press.
To dissociate the effects of saliency and response selection, the current variant of the go/no-go paradigm included an infrequent-go condition (25%), in which participants hear a sound that occurs just as infrequently as the no-go sound but requires the frequent response (i.e., a button press rather than withholding a button). Previous studies find that, in sighted individuals, the ‘infrequent-go’ condition elicits intermediate levels of response in prefrontal executive function networks, since it involves a salient infrequent stimulus but does not tax response selection demands (Chikazoe et al., 2009). We predicted that, analogously, parts of deafferented ‘visual’ cortex would respond more to no-go than infrequent-go trials in blind but not sighted individuals, suggesting sensitivity to response selection demands above and beyond stimulus frequency/saliency.
We next used laterality analyses as a window into the cognitive nature of ‘visual’ cortex responses to the go/no-go paradigm. Previous studies found that fronto-parietal no-go responses are right-lateralized in sighted individuals (Simmonds et al., 2008; Criaud and Boulinguez, 2013). We therefore predicted that occipital no-go responses would, likewise, be right-lateralized and, furthermore, that the degree of right-lateralization in prefrontal and occipital networks would be correlated across blind individuals (see Lane et al., 2016 for analogous co-lateralization of language responses).
To determine whether occipital no-go responses are functionally distinct from previously identified occipital responses to language, a subset of the same blind participants (N=16) completed a second experiment, in which sentence comprehension was compared to a mathematical control task. If responses in the occipital cortex of blind individuals are organized according to modality, with activity during auditory tasks simply reflecting low-level processing of auditory stimuli, spoken language and non-verbal go/no-go sounds should recruit overlapping “sound-responsive” occipital regions. Responses to spoken language and no-go sounds might also overlap if occipital regions in blindness are more generally sensitivity to cognitive load in both tasks. By contrast, if occipital regions of blind individuals are sensitive to distinct processes, (e.g., response selection vs. language processing), we would expect sensitivity to the go/no-go task and spoken language to dissociate anatomically within occipital cortex. We predicted that ‘visual’ regions responding to no-go trials would not preferentially respond to sentences over math equations, unlike previously identified language-responsive ‘visual’ cortices in blind individuals (e.g., Lane et al., 2015).
Finally, we used resting-state data to test whether, in blindness, no-go responsive ‘visual’ cortices become functionally connected with auditory cortices, sensorimotor cortices or prefrontal executive networks. Previous studies have found that, in blind individuals, language-responsive ‘visual’ cortices show elevated resting-state functional connectivity with language-responsive prefrontal cortices and reduced functional connectivity with auditory and sensorimotor cortices (Liu et al., 2007, 2017; Yu et al., 2008; Bedny et al., 2011; Burton et al., 2014; Wang et al., 2014; Deen et al., 2015; Striem-Amit et al., 2015; Kanjlia et al., 2016; Sabbah et al., 2016). Whether an analogous functional connectivity profile holds in deafferented ‘visual’ regions that are sensitive to response selection demands in non-verbal tasks not known. We predicted that, if no-go-responsive ‘visual’ areas are processing response selection demands in blindness, these regions would show enhanced resting-state functional connectivity with no-go-responsive prefrontal regions in blind individuals. By contrast, if no-go responsive ‘visual’ regions are involved in low-level auditory or sensorimotor processing, we might expect them to show enhanced resting-state functional connectivity with early auditory or sensorimotor cortices. Finally, we predicted that the upregulation of resting-state functional connectivity between ‘visual’ and prefrontal cortices would be functionally selective among prefrontal areas: activity in no-go-responsive ‘visual’ cortices would be more correlated with no-go-responsive (executive) than language-responsive prefrontal regions.
Materials and Methods
Participants
24 sighted controls and 23 congenitally blind individuals (sighted 17 female; 22 right-handed; age: M=41.53, SD=14.62; years of education: M=18.19, SD=3.70; blind 14 female; 16 right-handed, 3 ambidextrous; age: M=42.94, SD=16.72; years of education: M=16.54, SD=2.49) contributed data to the go/no-go task. Sixteen of the blind participants also contributed data to the language task. Sighted and blind participants were matched on average age (t(45)=0.31, p>0.5) and education level (t(45)=1.78, p=0.08).
All but one of the sighted and all of the blind participants contributed resting-state data. To increase statistical power, resting-state data from an additional 7 sighted and 7 blind participants were included, resulting in the following group-wise resting-state data demographics (sighted N=31; 20 females; age: M=43.78, SD=12.48; blind N=30; 19 females; age: M=44.23, SD=16.41; blind vs. sighted age, t(59)=0.12, p>0.5). During the resting-state scan, participants were instructed to relax but remain awake.
Blind and sighted participants wore light exclusion blindfolds for the duration of the scan to equate light conditions during the scan across groups. All blind participants reported having minimal-to-no light perception since birth and having never seen colors, shapes, or motion. At the time of the study half of the blind participants had minimal light perception, the remainder had none. One blind participant was excluded from all analyses (and all above reported statistics) after subsequently reporting having had some functional vision in childhood. Blind and sighted participants had no known neurological disorders, head injuries, or brain damage. For all blind participants, the causes of blindness excluded pathology posterior to the optic chiasm (see Table 1 for details). All participants gave written informed consent under a protocol approved by the Institutional Review Board of Johns Hopkins University and were compensated $30 an hour for taking part in the study.
Table 1.
Number of participants with each cause of blindness and with light perception (LP No.) included in each analysis (go/no-go task, language and math task, and resting-state analyses).
| Go/No-Go | Language | Rest | |
|---|---|---|---|
| Blindness Etiology | |||
| Leber Congenital Amaurosis | 6 | 5 | 9 |
| Retinopathy of Prematurity | 10 | 7 | 14 |
| Optic Nerve Hypoplasia | 3 | 1 | 3 |
| Retinitis Pigmentosa | 1 | 0 | 1 |
| Anophthalmia | 1 | 1 | 1 |
| Unknown | 2 | 2 | 2 |
| Total | 23 | 16 | 30 |
Experimental design and statistical analyses
Go/No-Go Task
Participants heard complex non-verbal sounds (450 msec with 450 msec ISI), each representing 1 of 3 conditions: frequent-go (50% of trials), no-go (25% of trials), and infrequent-go (25% of trials) and were asked to make speeded button presses in response to the go sounds and to withhold responding to the no-go sounds. Each run was comprised of 400 trials and four 20-second rest periods, spaced equidistantly, for a total time of 7.67 minutes per run. Presentation order was constrained so that each infrequent condition – i.e., infrequent-go and no-go – could not occur on more than 3 consecutive trials. Feedback on performance accuracy was given after every run. The frequent-go and infrequent-go conditions were referred to as “go 1” and “go 2,” respectively, to avoid explicitly labeling the two “go” conditions by their degree of frequency. Prior to taking part in the main experiment, participants performed 400 practice trials (100 inside the scanner) with auditory feedback after each trial.
Sounds were matched to each other on subjectively perceived volume using a pilot experiment on Amazon Mechanical Turk (AMT). AMT participants (N=79) heard versions of the sounds matched to each other on root mean squared amplitude (RMS). The ratings were used to adjust volume for fMRI experiment (sound 1 RMS amplitude=0.103, frequency=3303, sound 2 RMS amplitude=0.114, frequency=257, sound 3 RMS amplitude=0.059, frequency=5759) (sox.sourceforge.net). Note that assignment of sounds to conditions was counterbalanced across participants and matched across blind and sighted groups such that condition effects could not be relate to sound properties. The 3 stimulus sounds were chosen to be easily and immediately discerned from each other. All 3 sounds differed from each other at the sound onset and remained relatively homogenous throughout the sound duration. To discourage chunking of sounds across conditions, sounds were selected to be equally dissimilar (Amazon Mechanical Turk pre-experiment pilot testing revealed no one sound as the “odd one out”; chi-sqd(2)=1.66, N=49, p>0.5). Experimental code and stimuli are available online (https://github.com/NPDL/Go-NoGo).
Language Task
Participants heard 2 sentences (each 3.5 seconds long and separated by a 2.75 second delay) and indicated whether their meanings were the same during a 4 second response period. Each pair of sentences was preceded by a 0.25 second tone to indicate the beginning of that trial. One of the sentences was always in active voice and the other in passive voice. On “different” trials, who-did-what-to-whom was switched from one sentence to the other while all nouns and verbs remained identical. To enhance variation, half of the sentence pairs were object-relative and half were subject-relative. In a control condition, participants heard pairs of math equations (e.g. 7–2=x, 9–7=x) and indicated whether the value of x was the same across the two equations. Although equations varied in difficulty, this variable was of no interest for the present study and was not analyzed (see Kanjlia et al., 2016 for further task details). Using this and similar paradigms, previous studies have demonstrated that inferior frontal and lateral temporal language regions respond more to sentences than math equations, whereas inferior parietal and dorsolateral prefrontal areas respond more to equations (e.g. Monti et al., 2012; Amalric & Dehaene, 2016). Anatomically separable responses to sentence > math equations and equations > sentences have been documented in ‘visual’ cortex of congenitally blind individuals using this task (Lane et al., 2015).
For both experiments, auditory stimuli were presented over Sensimetrics MRI-compatible earphones (http://www.sens.com/products/model-s14/) at the maximum comfortable volume for each participant. Participants were free to make responses with their preferred hand (right hand for all but 1 sighted and 4 blind participants).
fMRI data acquisition
MRI structural and functional data of the whole brain were collected on a 3 Tesla Philips scanner. T1-weighted structural images were collected in 150 axial slices with 1 mm isotropic voxels using a magnetisation-prepared rapid gradient-echo (MP-RAGE). T2*-weighted functional images were collected in 36 axial slices with 2.4 × 2.4 × 3 mm voxels and a 2 second TR. For each participant, there were 3 runs of task-based go/no-go data, 4 to 6 runs of task-based language data and between 1 and 4 runs of resting-state data (number of runs: sighted M=1.23, SD=0.43; blind M=1.83, SD=0.95; t(59) = 3.14, p=0.003). Resting-state analyses were also performed matching groups on run number and qualitatively similar effects were observed. Similar effects were also observed when resting-state analyses were performed only on the subset of participants that completed the go/no-go task. Acquisition parameters were identical for resting and task-based data.
fMRI task-based analyses
Data analyses were performed using FSL, FreeSurfer, the HCP workbench, and custom software (Dale et al., 1999; Smith et al., 2004; Glasser et al., 2013). Functional data were motion corrected, slice-time corrected, high pass filtered with a 128 s cutoff, pre-whitened, and resampled to the cortical surface (discarding subcortical structures and the cerebellum). The data were smoothed on the surface with a Gaussian kernel of 12 mm FWHM for whole brain analyses and 6 mm FWHM for individual regional of interest analysis and fMRI data was scaled to a median intensity of 10,000 (Pauli et al., 2016). Note that smoothing on the surface results in less smooth data than smoothing in the volume (Hagler et al., 2006; Jo et al., 2007; Anticevic et al., 2008; Tucholka et al., 2012).
For the go/no-go task for each subject, we defined a GLM to predict BOLD activity according to the following event types: successful frequent-go, successful infrequent-go, successful no-go, failed frequent-go, failed infrequent-go, failed no-go, false starts, and extra button presses. Results report only successful trials. All trial events began at the onset of the auditory stimulus and ended at the offset of the auditory stimulus or the participant’s button press (whichever sensory event ended last).
The language task GLM included two language regressors and four math regressors, each modeling events that were 9.75 seconds long. Additionally there was a 4 second response regressor and a .25 second tone regressor. Results from the two language regressors and four math regressors were collapsed in all analyses. (For further details on language task see Lane et al., 2015; Kanjlia et al., 2016).
For both the go/no-go and language tasks, regressors were convolved with the standard FSL canonical double gamma hemodynamic response function, in the language task we also included the first temporal derivative of the HRF. Note that we used the standard HRF for modeling the go/no-go rapid event related design because conditions in the current design were randomized with respect to each other. This analysis approach has been validated in numerous previous go/no-go designs as having sufficient power to find condition effects (Liddle et al., 2001; Mostofsky et al., 2003; Goldstein et al., 2007; Chikazoe et al., 2009; Barber et al., 2013). Within the GLM, a covariate of no interest was included to account for motion. Timepoints with framewise-displacement (relative movement) greater than 1.5 mm were excluded by modeling each timepoint as an individual regressor with a value of 1 at the time point and 0 everywhere else (go/no-go drops per run: sighted M=0.10, SD=0.23; blind M=0.26, SD=0.73; difference between groups t(45)=1.04, p=0.30; language drops per run: blind M=0.44, SD=0.83). Fixed-effects analyses were used to combine runs within each subject, which were then submitted to a group analyses with subject represented as a random-effect.
In a whole-cortex analysis, we controlled for vertex-wise multiple comparisons across cortex (familywise error, FWE) using a combined vertex-wise cluster defining threshold (CDT) and cluster-wise permutation analysis (Nichols and Holmes, 2002; Nichols and Hayasaka, 2003; Hagler et al., 2006). Whole-brain maps were first thresholded at p<0.001 CDT and resulting cluster-sizes tested against a cluster-size null distribution generated from 5,000 permutations. This approach corrects for multiple comparisons across the cortex because each permutation’s null value is determined by the highest cluster size, across the whole brain. Non-parametric corrections for multiple comparisons, which permute the data themselves rather than relying on random field theory (RFT), have been shown to yield more accurate multiple comparison corrections (Eklund et al., 2016; Kessler et al., 2017) with the more conservative CDT used in the current study (Kessler et al., 2017). All reported whole-brain maps are thresholded at p<0.001 vertex-wise and p<0.05 cluster-corrected, one-sided tests.
Code for fMRI analyses are available online (https://github.com/NPDL/Go-NoGo).
fMRI task-based ROI Analysis
We defined regions of interest (ROIs) using the following search-spaces: 1) a right prefrontal (PFC) executive function responsive ROI, 2) a right occipital cortex (OC) executive function responsive ROI, and 3) a bilateral sensory-motor cortex control region (SMC). Within these search-spaces, ROIs were defined functionally, using a leave-one-run out procedure in individual participants within group-wise search-spaces (e.g. Kanwisher et al., 1997; Kriegeskorte et al., 2009; Saxe et al., 2006; Vul et al., 2009). Group-wise search-spaces were selected as follows: 1) response selection PFC search-space was defined based on previous studies reporting response selection effects in lateral prefrontal cortex, anterior to the pre-central gyrus, using neurosynth.org (term “response inhibition”) (Yarkoni et al., 2011). The volumetric search-space was projected to the surface, thresholded at z > 1.65, dilated and eroded by 12 mm (to fill small holes). 2) The occipital cortex (OC) search-space consisted of the FreeSurfer occipital lobe parcel (PALS-B12 atlas, Van Essen, 2005) eroded by 20 mm on the lateral surface to exclude any potential parietal or temporal territory. 3) The sensorimotor cortex (SMC) search-space was defined based on previous work finding hand-movement related activity in bilateral central sulcus and pre- and post- central gyri, using the same methods as the PFC search-space (Destrieux et al., 2010). PFC and OC ROIs were defined in the right hemisphere because of previously observed right-lateralization of no-go effects in prefrontal cortex (Konishi et al., 1998; Garavan et al., 1999; Liddle et al., 2001; Menon et al., 2001; Mostofsky et al., 2003; Barber et al., 2013).
Within each search-space, we used a leave-one-run out procedure to define subject-specific functional ROIs, by selecting the top 5% contrast-responsive vertices. Vertices were selected based on data from all but one run and Beta values were extracted from the left-out run, ensuring orthogonality (Kanwisher et al., 1997; Kriegeskorte et al., 2009; Nieto-Castañón and Fedorenko, 2012). For this key test of no-go sensitivity in occipital cortex, we additionally tested the robustness or results across ROI sizes to ensure that any group differences were not specific to a particular threshold. In addition to a ROI of the top 5% of vertices (reported in the Results section), we also had ROIs of the top 20 vertices, top 10% of vertices, and top 20% of vertices (Figure 2b).
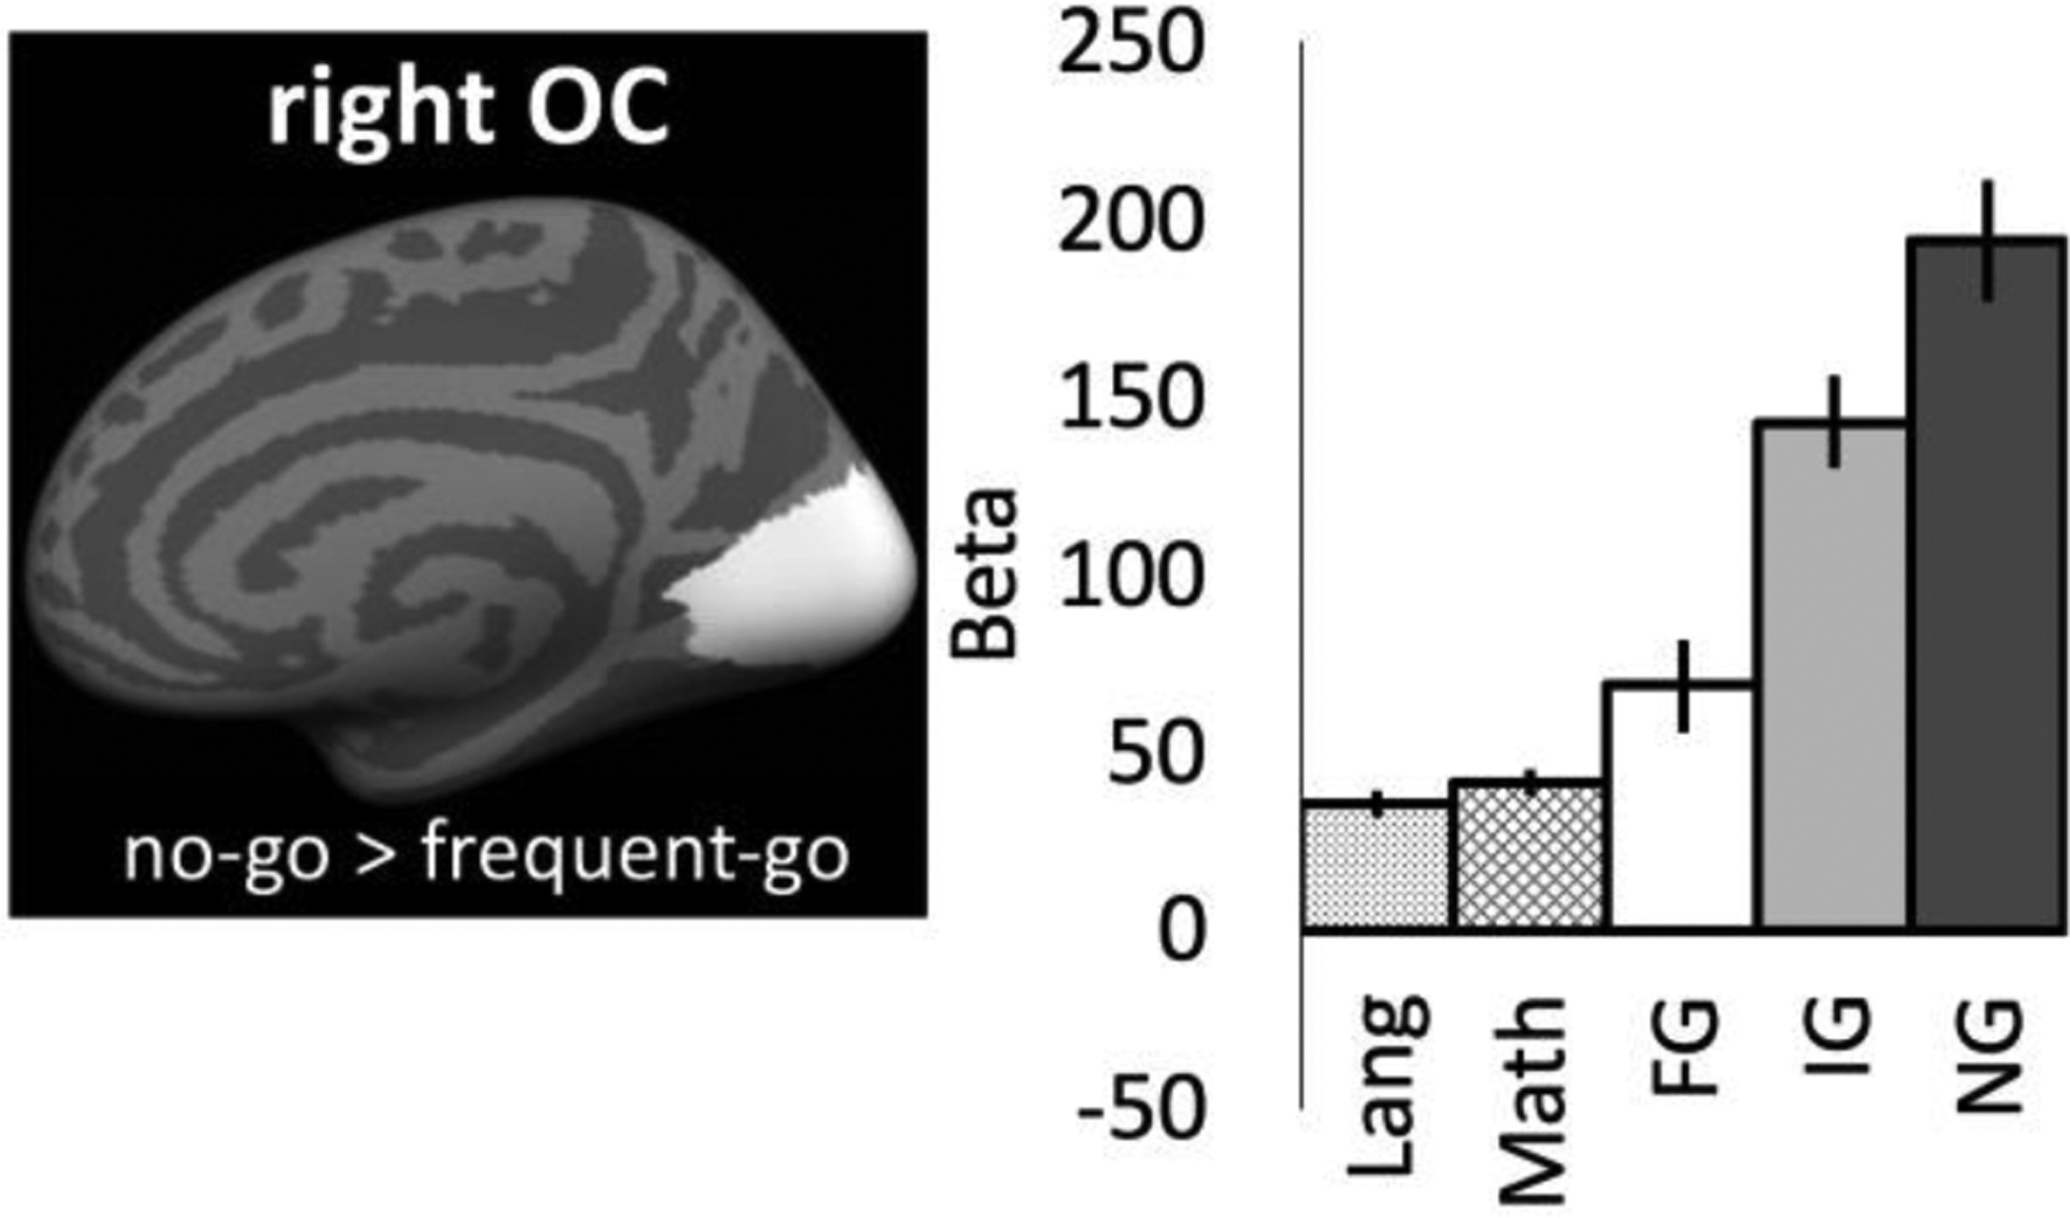
Figure 2.
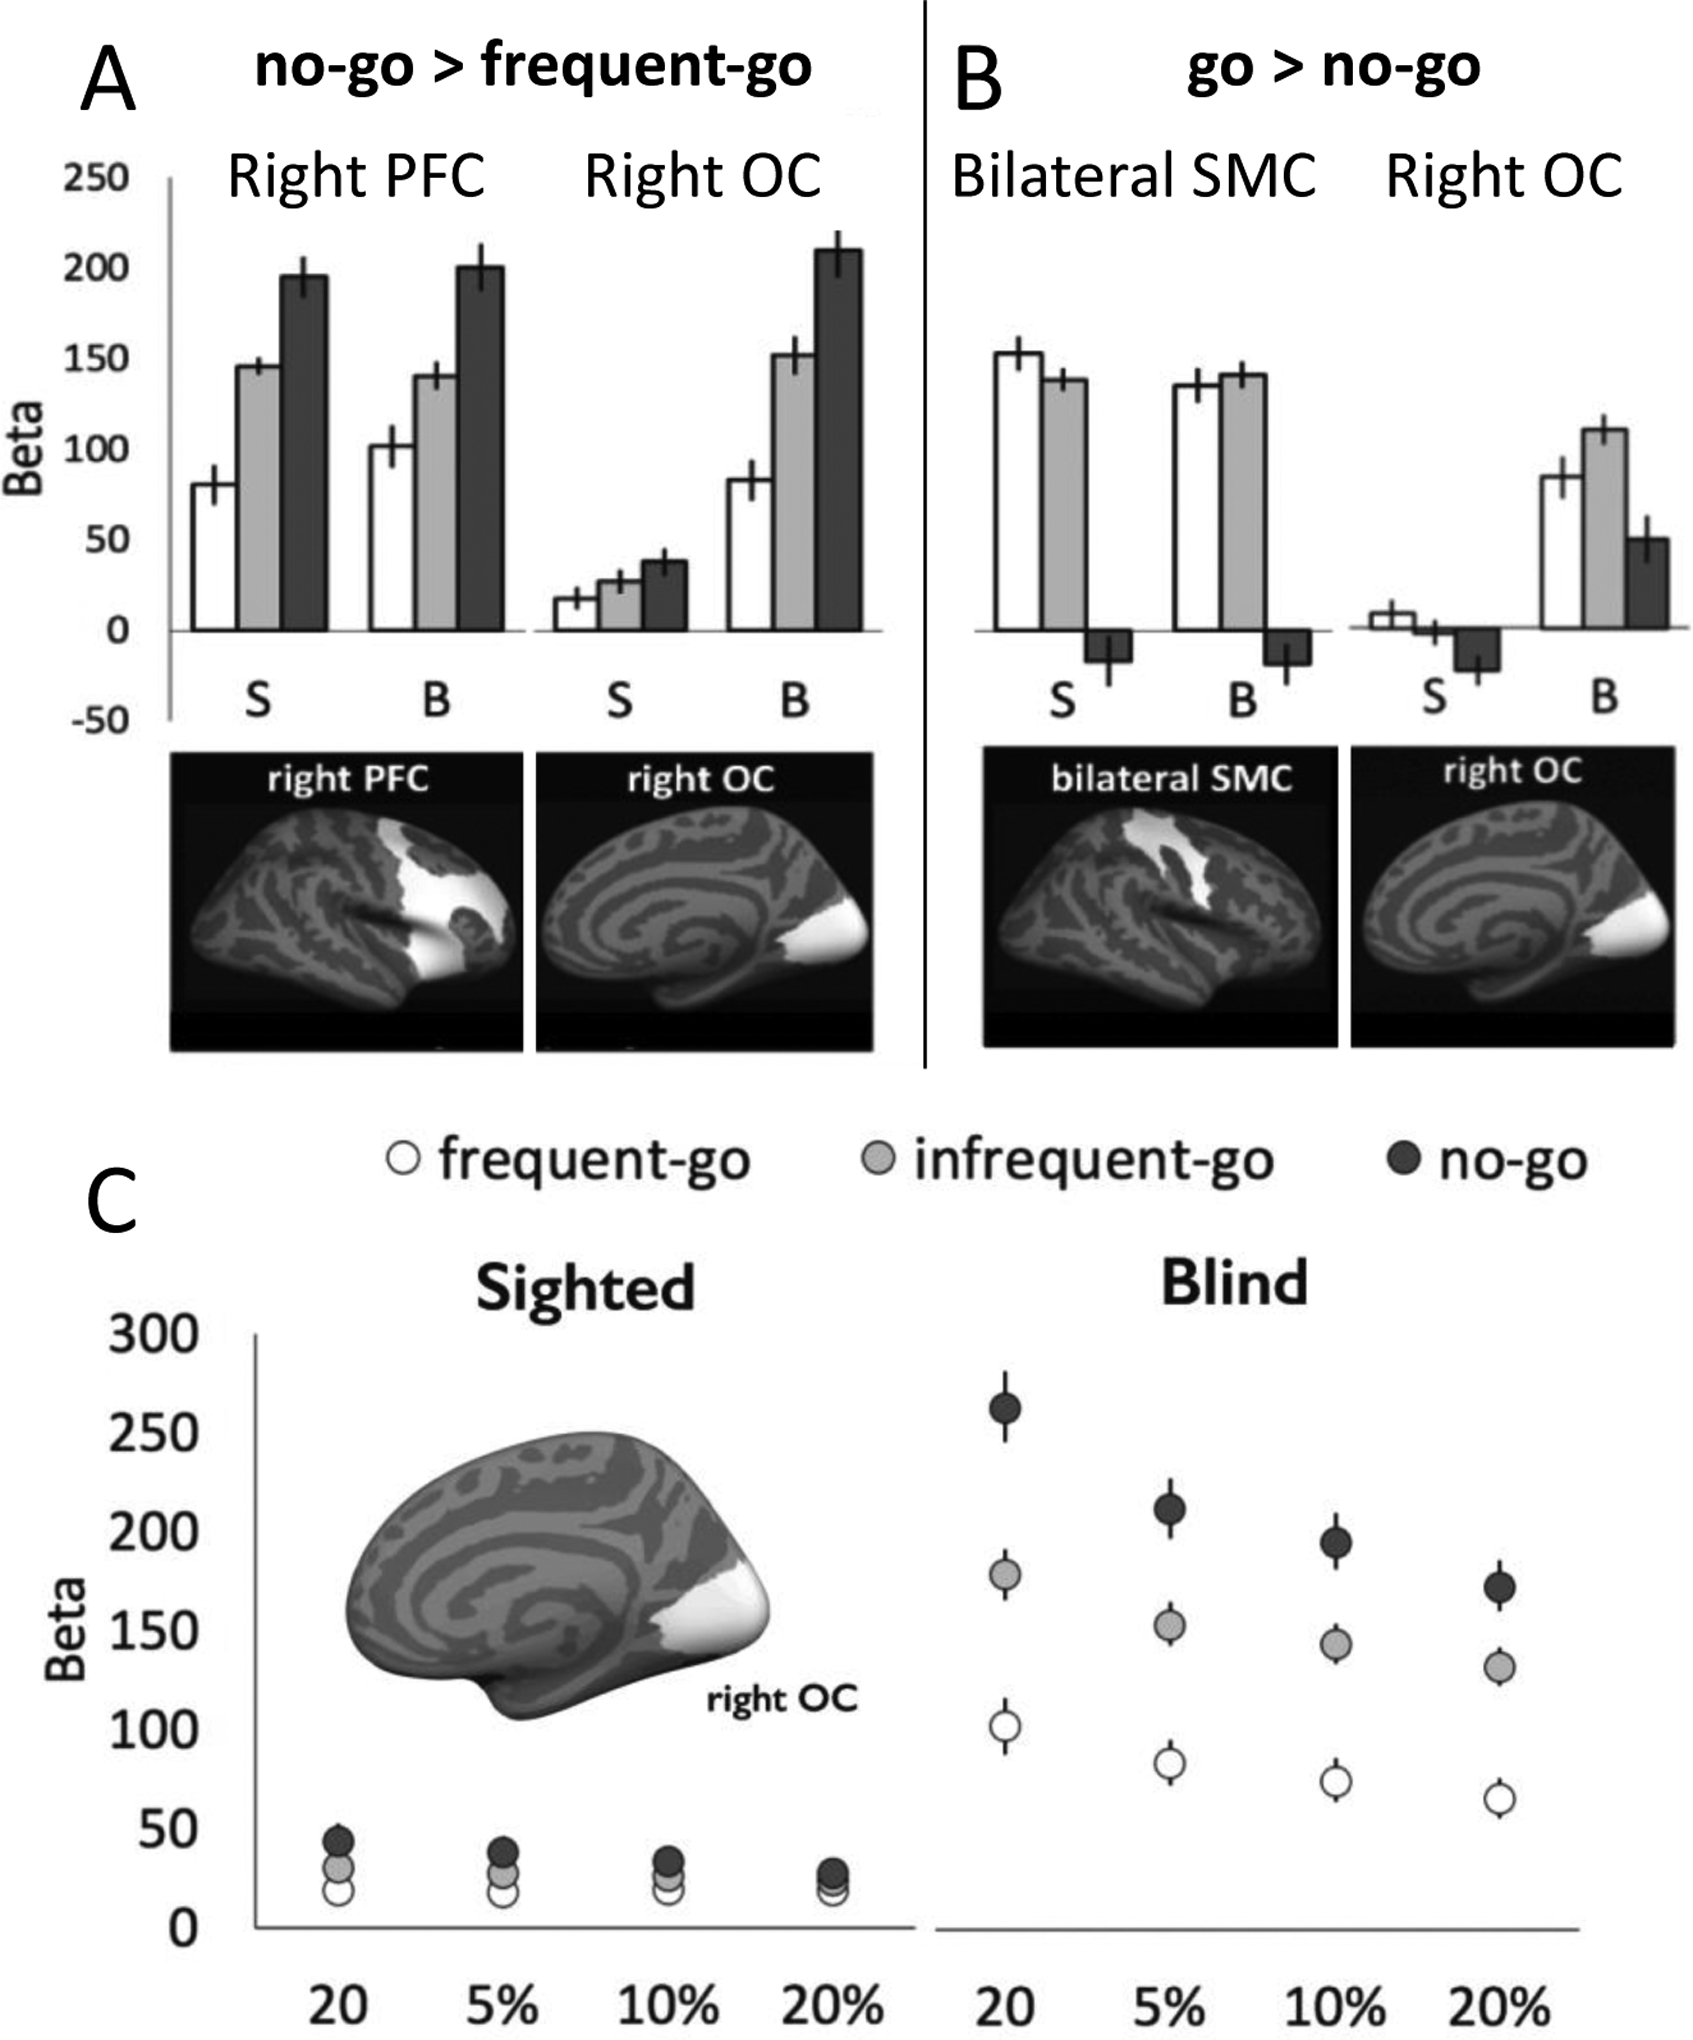
Beta values for task conditions within sighted (S) and congenitally blind (B) participants’ right prefrontal cortex (PFC), right occipital cortex (OC), bilateral sensorimotor cortex (SMC) ROIs. Error bars indicate the within-subjects SEM. Panel A shows vertices selected using the no-go > frequent-go contrast, Panel B shows vertices selected using the frequent-go + infrequent-go > no-go contrast. Search-spaces within which vertices (individual-subject ROIs) were selected shown in white below ROI results. See Figure S3 for overlap of individual-subject ROIs. (Panel C) Beta values from all conditions in go/no-go task for functional regions of interest of varying sizes defined as no-go > frequent-go vertices within the right occipital cortex (OC) search-space. ROI size ranges from 20 vertices (smallest) to 20% of entire ROI (largest). ROIs are defined according to a leave-one out analysis for response selective vertices.
The PFC and OC response selection ROIs were defined based on the no-go > frequent-go contrast. The sensory-motor SMC ROI was defined by comparing trials with a button press to those without one (frequent-go + infrequent-go > no-go contrast). For completeness, we additionally searched for sensory-motor responsive vertices in the occipital cortex (OC). Beta-values were extracted from all selected vertices and then averaged across vertices and across leave-one-out iterations. Betas were extracted for all conditions in the go/no-go experiment and for the language and math conditions in the language experiment. Note that the leave-one-run out cross-validation procedure was only necessary to ensure orthogonality of go/no-go analyses. However, this procedure was maintained even for the language experiment to ensure that the same exact functional regions were being interrogated for go/no-go and language responses.
Statistical significance for the effect of condition in each group was assessed using one way repeated-measures ANOVAs within each group and ROI. This was followed by 2 t-tests comparing 1) the no-go condition to the infrequent-go condition and 2) the infrequent-go condition to the frequent-go condition. Bonferroni adjusted p-values (correcting for 2 tests) are provided for t-tests with p values < 0.05. T-tests are two sample, two-tailed Welch’s t-tests.
To supplement the ROI analysis and provide a sense of the anatomical distribution of vertices with different functional profiles in occipital cortices across groups, we also plot un-thresholded occipital maps in which each vertex is color coded according to whether it responds most to the frequent-go, infrequent-go, or no-go condition. We first identified, in each subject, the condition that produced the highest beta value at each vertex. We then computed the mode across subjects at each vertex to identify the condition that most frequently produced the highest response and then color-coded the vertex accordingly (Figure 3).
Figure 3.
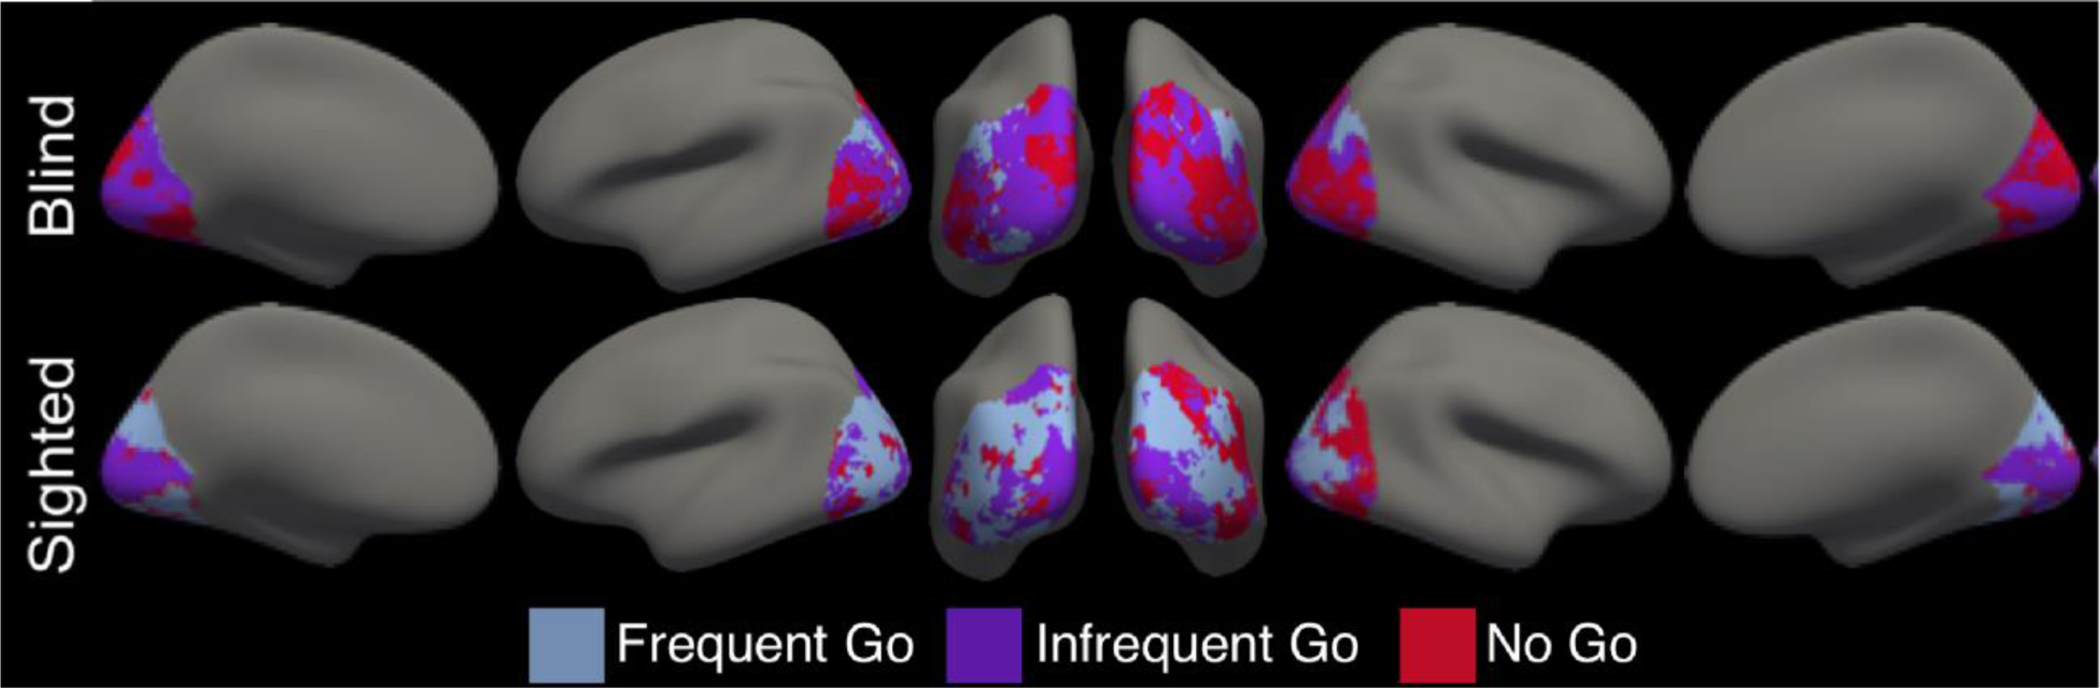
Vertices within occipital lobe color-coded according to which condition it responded to most across subjects in that group (condition producing the highest Beta-value).
Laterality Index Analysis
We used a laterality index (LI) to quantify the lateralization of responses to go/no-go conflict (no-go > frequent-go contrast) in prefrontal and occipital cortices: (L − R) / (L + R), where L is the z-statistic sum within the left hemisphere and R is the z-statistic sum within the right hemisphere. LIs range from −1 to 1 and negative values indicate right lateralization. We calculated LIs based on the no-go > frequent-go contrast for each participant using the combined bootstrap/histogram method (Wilke and Schmithorst, 2006). This approach has previously been used to compare language lateralization across groups of blind and sighted individual (Lane et al., 2016).
Bootstrapped LIs were computed across 20 evenly spaced thresholds ranging from z=0.00 to z=3.00 (corresponding to one-sided p=0.50 to p=0.00135, uncorrected). For each threshold, the participant’s z statistic map (smoothed 6mm) for the contrast was masked to include only the voxels within the region-of-interest (ROI) that were at or above threshold. Next, we sampled the suprathreshold voxels (with replacement) 100 times in each hemisphere with a sampling ratio of k=1.0. The z statistics of the sampled voxels were then summated. Each sum within a hemisphere was paired with every sum in the other hemisphere, and the LI was computed, yielding 10,000 LIs for that threshold.
Following the calculation of the bootstrapped LIs, a single, threshold-specific LI was calculated by removing the upper and lower 25% of the 10,000 values and averaging those that remained. To obtain each participant’s final LI, their LIs were averaged across thresholds.
LIs were computed in a frontal lobe ROI for both the sighted and blind participants. LIs were also computed in the occipital lobe for the blind participants. The frontal lobe ROI was a FreeSurfer frontal lobe parcel (PALS-B12 atlas, Van Essen, 2005). The occipital lobe was the same occipital lobe search-space used for all ROI analysis i.e. the FreeSurfer occipital lobe parcel eroded by 20mm (PALS-B12 atlas, Van Essen, 2005). LIs were also computed in a functionally-defined STG/STS ROI that showed sensitivity to response selection demands in a whole-cortex analysis (Figure 5; see Supplementary Results; Figure S6).
Figure 5.
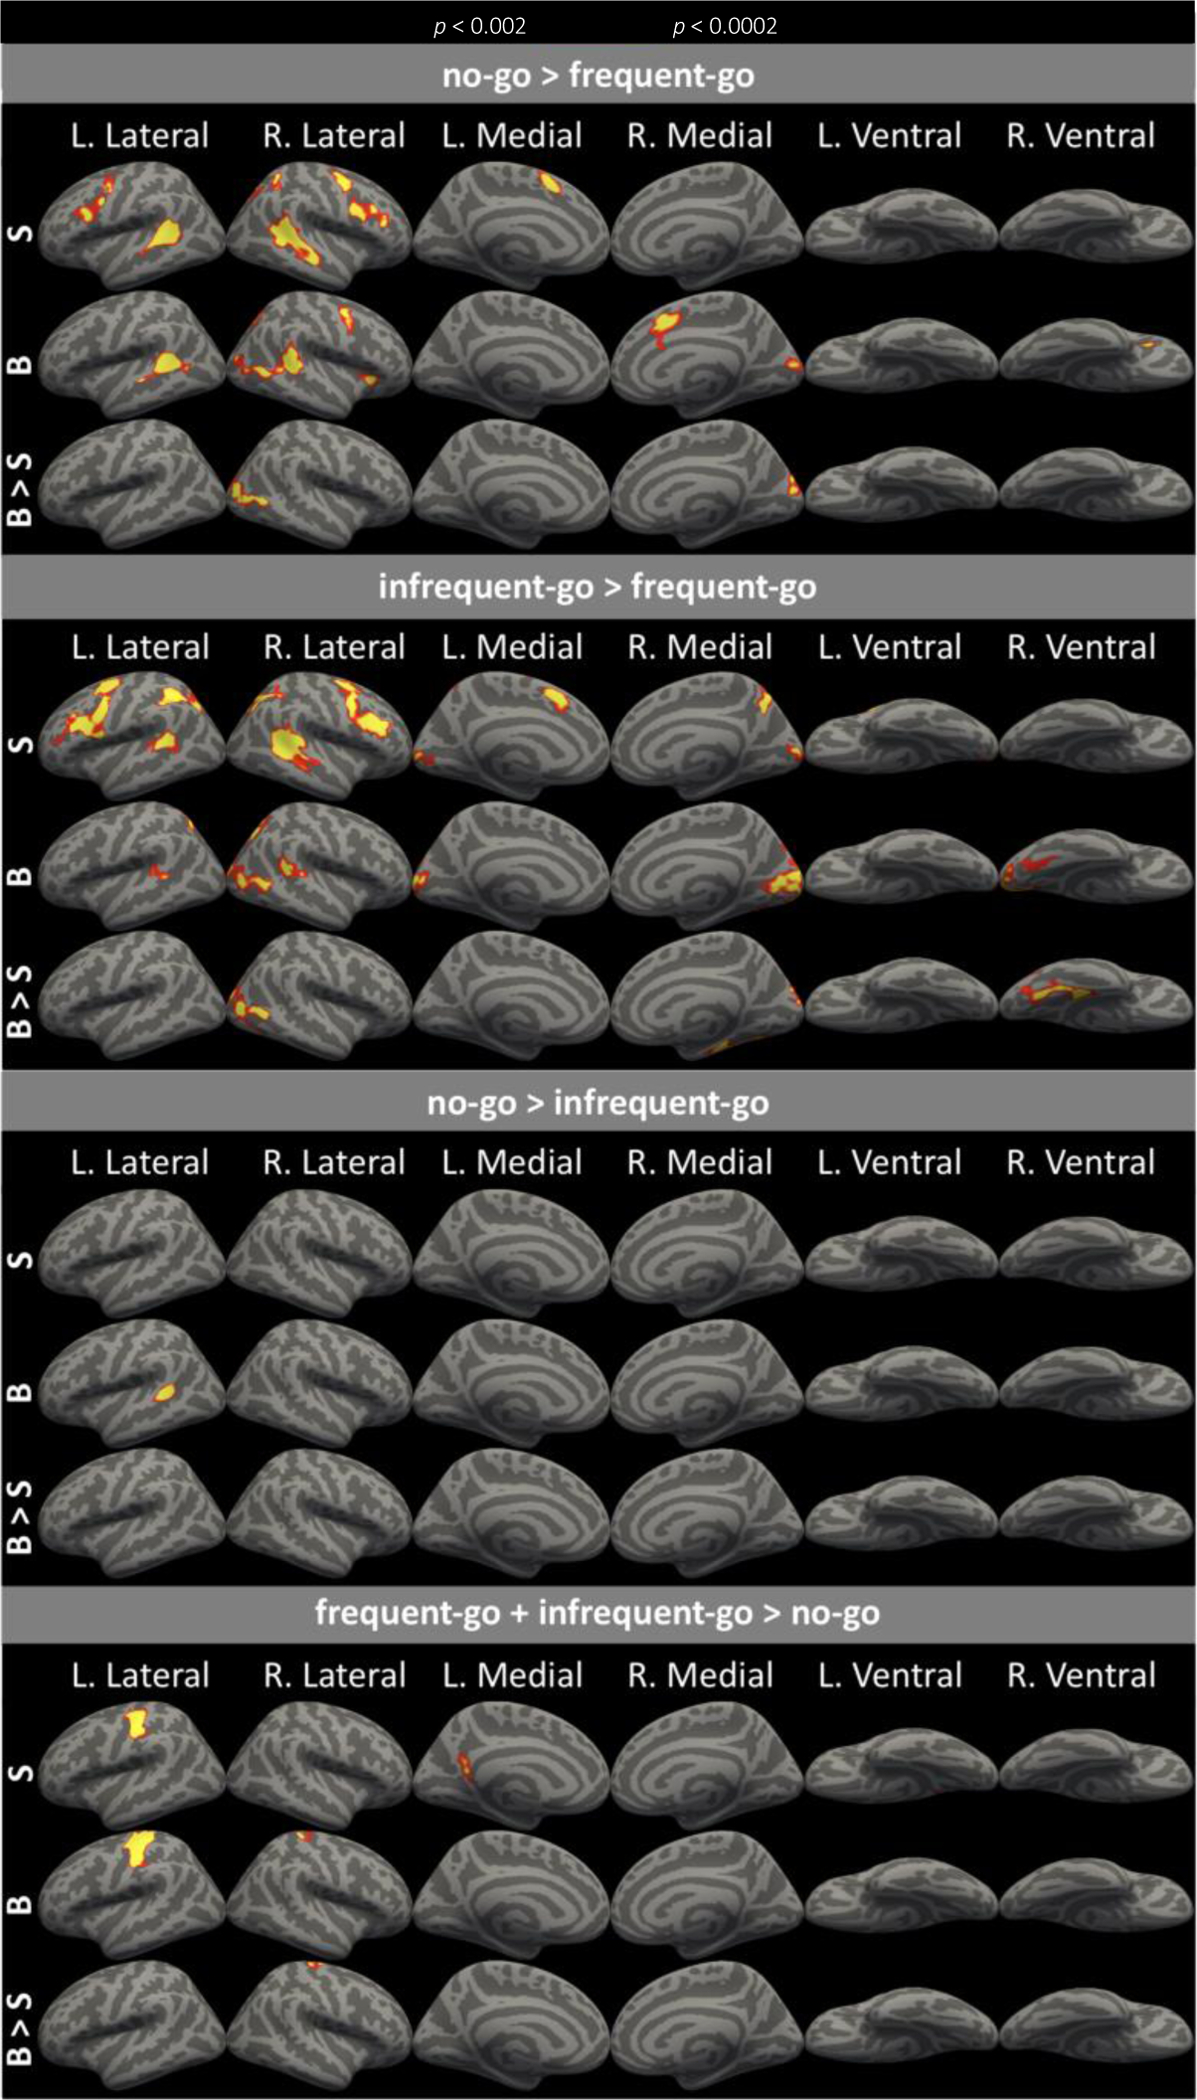
Whole brain contrasts for sighted (S), blind (B), and blind > sighted (B > S). Maps are thresholded at p<0.001 vertex-wise and p<0.05 cluster-corrected for multiple comparisons. Note that no vertices were more responsive in the sighted than blind group in any contrast.
Resting-state Functional Connectivity Analysis
We examined the effects of blindness on visual cortex functional connectivity at rest. Specifically, we tested the connectivity profile of occipital areas that are sensitive to response selection demands in the go/no-go task, in blind more so than sighted individuals.
Resting-state data were analyzed using the CONN Toolbox (Whitfield-Gabrieli and Nieto-Castanon, 2012). BOLD data were first smoothed 23 diffusion steps on the surface and registered to MNI-152 standard space. To control for temporal confounds, white matter and cerebrospinal fluid BOLD signals were regressed out and the residual was bandpass filtered (0.008–0.1) (Whitfield-Gabrieli and Nieto-Castanon, 2012). Time-courses were first averaged within ROIs and then either correlated to other ROIs (ROI-to-ROI) or to the time-course of every vertex in the cortex (ROI-to-whole-cortex).
We defined an occipital ‘visual’ cortex executive function (OC-EF) seed ROI as the cluster that responded more to no-go than frequent-go conditions in blind, relative to sighted, in a whole-brain analysis (p<0.05, corrected). Since response selection occipital effects in the current study were right lateralized and connectivity is higher within than across hemispheres, all resting-state analyses were performed in the right hemisphere. This ensures that any functional connectivity differences amongst ROIs are not driven by differences in connectivity across hemispheres.
Non-occipital ROIs include two higher cognitive prefrontal areas and two sensory/sensorimotor areas. We defined a prefrontal executive-function (PFC-EF) ROI as the cluster that responded more to no-go than frequent-go across all subjects, constrained to the PFC search-space. We constrained the PFC-EF ROI to the area ventral to the middle frontal gyrus, so that the size of the PFC-EF ROI would be more comparable to the second PFC ROI to which it would be compared (described next). The prefrontal language (PFC-LG) ROI was defined as the area that has previously been observed to respond to linguistic content in sighted subjects, removing the small orbitofrontal overlap (across groups) with the no-go>frequent-go contrast (Fedorenko et al., 2010). Since response selection effects in occipital cortex are right lateralized, the left hemisphere PFC-LG ROI was flipped to the right hemisphere, in order to assess functional connectivity between all regions within one hemisphere. It is also worth noting that although language responses are largely left-lateralized in sighted individuals, blind individuals exhibit more bilateral language responses (Lane et al., 2016; Pant et al., 2020). Thus, a language ROI in the right PFC is an appropriate representative of the language network for blind individuals. Resting-state functional connectivity results with the left PFC-LG ROI are shown in the Supplementary Material (see Supplementary Results, Figure S7).
A sensorimotor (S1/M1) ROI was selected as the area that responds more to the go (frequent and infrequent) than no-go trials in the current study across groups, constrained to the hand SMC search-space from neurosynth.org (term “hand movements”). Since participants in our study were primarily responding with their right hand, the ROI was defined in the left hemisphere and flipped to the right. Finally, we selected a primary auditory cortex (A1) ROI as the transverse temporal portion of a gyral based atlas (Morosan et al., 2001; Desikan et al., 2006) (see ROIs in Figure S1 in Supplementary Material: https://osf.io/x2n8g/).
Results
Behavioral performance
Go/no-go task
In both go conditions of the go/no-go task, participants responded quickly (Figure 1; in milliseconds: sighted frequent-go: M=374, SD=61; sighted infrequent-go: M=410, SD=54; blind frequent-go: M=343, SD=64; blind infrequent-go: M=375, SD=57) and made few errors of omission (i.e. failing to go on go trials, Figure 1; % correct: sighted frequent-go: M=96.84, SD=4.00; sighted infrequent-go: M=95.50, SD=4.13; blind frequent-go: M=96.20, SD=7.50; blind infrequent-go: M=95.62, SD=8.51). By contrast, both blind and sighted participants made >10% errors of commission (i.e., responding on no-go trials, Figure 1; % correct: sighted: M=83.36, SD=10.39; blind: M=87.54, SD=11.19).
Figure 1.
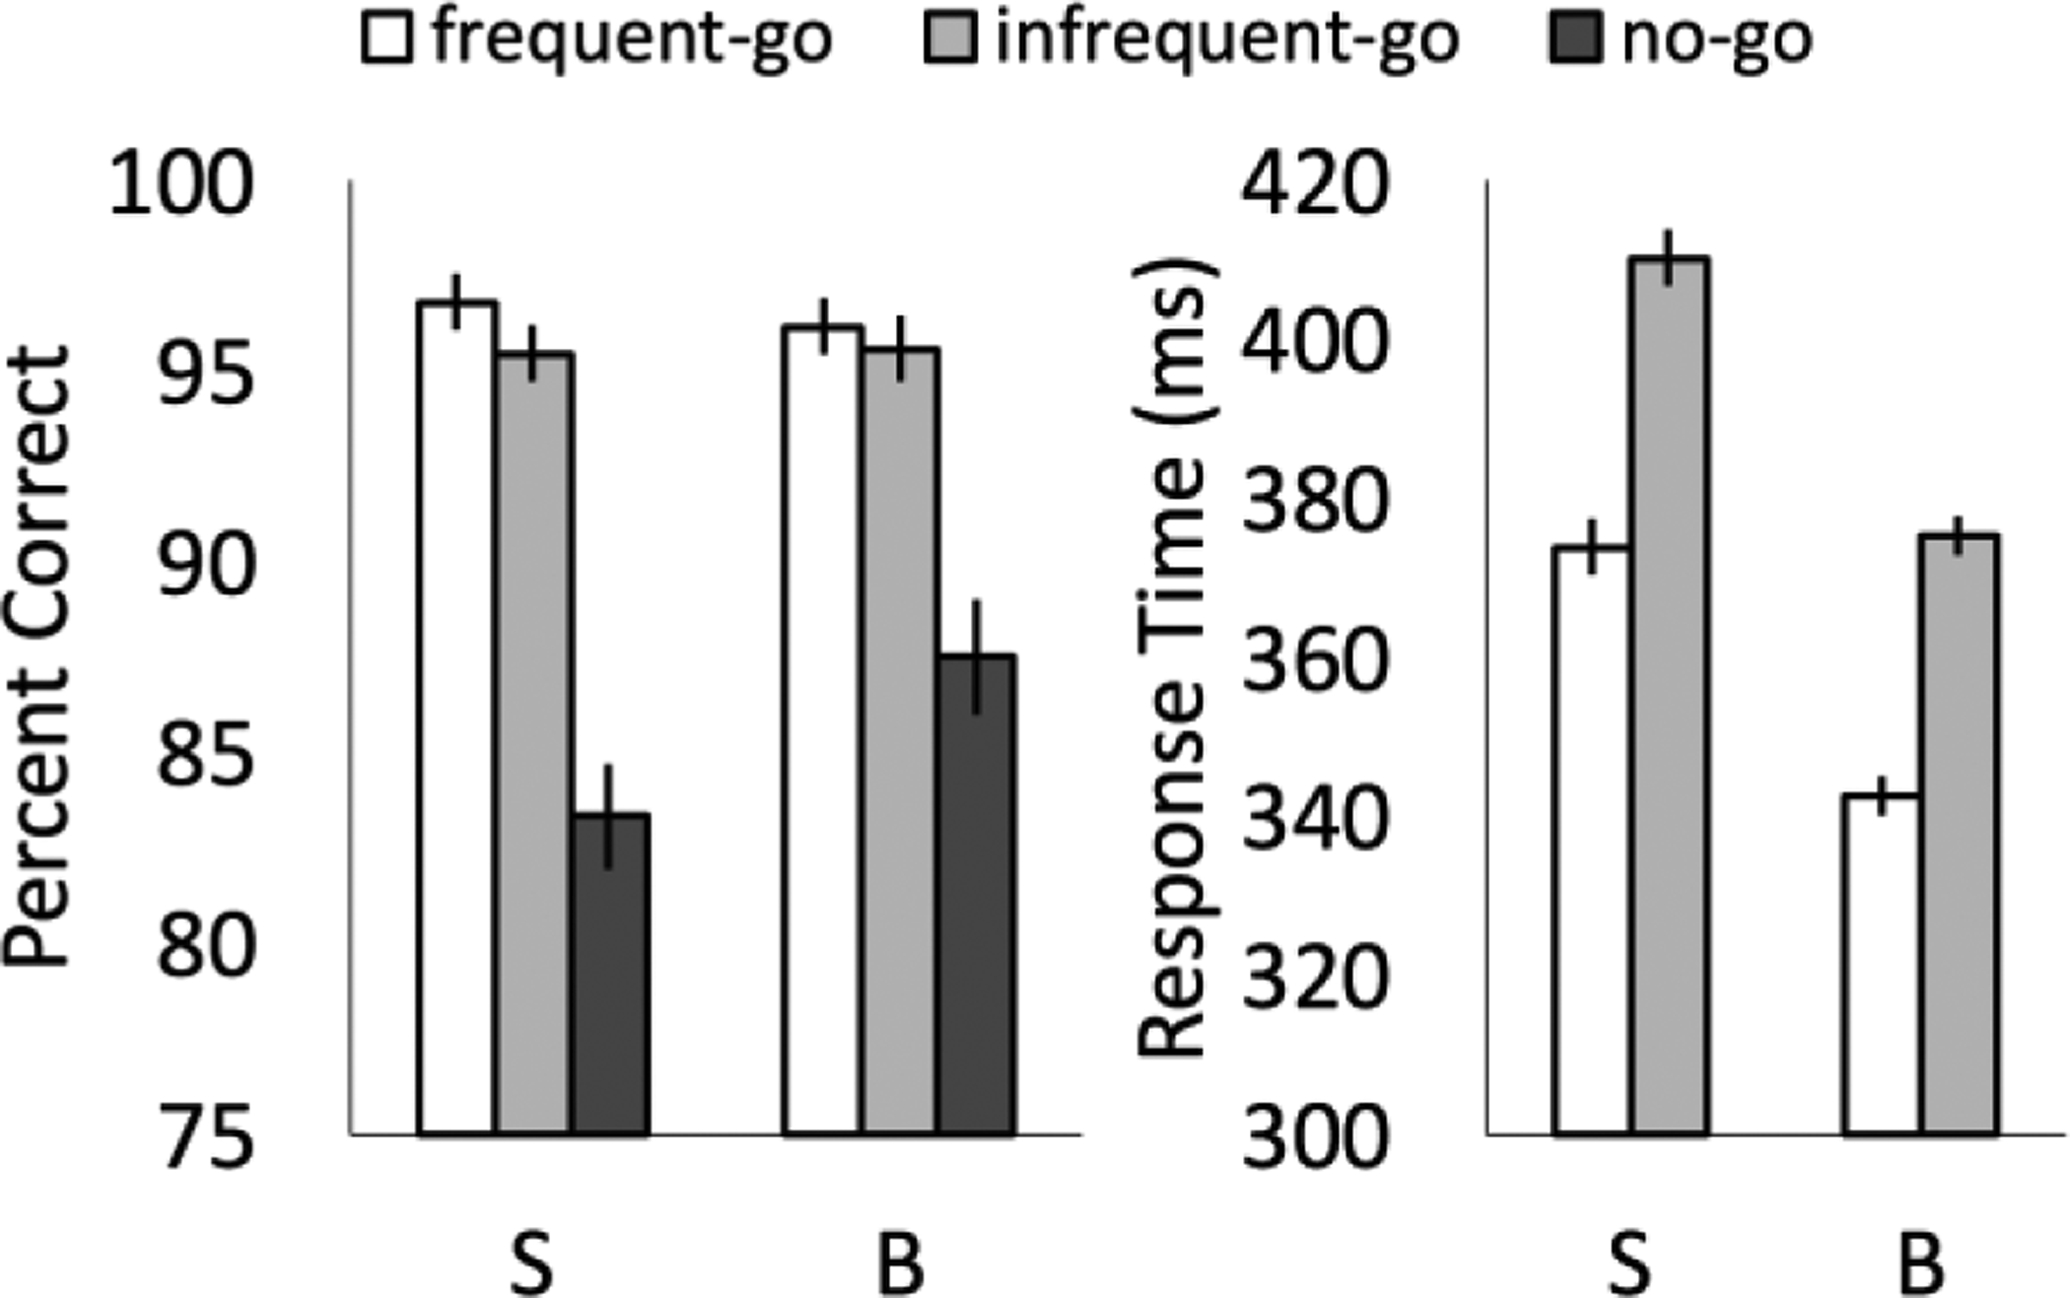
Behavioral performance. Percent correct and response times for sighted (S) and blind (B) participants. Error bars indicate the within-subjects standard error of the mean.
Participants in both groups made more errors of commission than omission (responding on no-go trials compared to failing to respond on frequent-go or infrequent-go trials; frequent-go vs. no-go: sighted t(23)=6.50, p<0.001, blind t(22)=3.92, p=0.001; infrequent-go vs. no-go: sighted t(23)=5.75, p<0.001, blind t(22)=3.48, p=0.002), with no difference between groups (group × condition ANOVA; main effect of condition: F(2,90)=46.13, p<0.001; main effect of group: F(1,45)=0.44, p>0.5; group × condition interaction: F(2,90)=2.05, p=0.16, Greenhouse-Geisser corrected). Frequent and infrequent-go accuracy differed significantly in the sighted but not the blind group (sighted: t(23)=2.31, p=0.03; blind: t(22)=1.19, p=0.25).
Both blind and sighted groups were slower to respond on infrequent-go compared to frequent-go trials (group × condition ANOVA; main effect of condition: F(1,45)=60.36, p<0.001; group-by-condition interaction: F(1,45)=1.30, p>0.5; sighted: t(23)=5.03, p<0.001; blind: t(22)=6.48, p<0.001). Blind participants showed a trending significance for overall faster responding on both frequent- and infrequent-go trials (main effect of group: F(1,45)=3.97, p=0.052).
Language task
Blind participants were comparably accurate on language and math trials (% correct: language: M=86.93, SD=10.64; math: M=83.72, SD=14.90; language vs. math: t(15)=1.37, p=0.19) but responded more quickly on language trials (in milliseconds: language: M=714, SD=586; math: M=921, SD=631; language vs. math t(15)=2.77, p=0.01).
Task-based fMRI
ROI analysis – Go/no-go task
We used a leave-one-run-out individual-subject functional ROI approach to search for vertices that responded to no-go conflict in prefrontal cortices of both groups (no-go > frequent-go). In both the sighted and blind groups, areas of the right prefrontal cortex (PFC) responded most to the no-go condition, least to the frequent-go condition and intermediately to the infrequent-go condition (Figure 2, Panel A Left; one-way ANOVA in sighted, main-effect of condition: F(2,46)=23.37, p<0.001; no-go vs. infrequent-go: t(23)=3.61, p=0.001, pBonf.=0.002; infrequent-go vs. frequent-go t(23)=5.06, p<0.001, pBonf.<0.001; blind, main effect of condition: F(2,44)=13.63, p<0.001; no-go vs. infrequent-go: t(22)=3.29, p=0.003, pBonf.=0.007; infrequent-go vs. frequent-go: t(22)=2.74, p=0.012, pBonf.=0.02). Responses in the right PFC did not differ between groups (group × condition ANOVA in PFC; main effect of condition: F(2,90)=35.40, p<0.001; main effect of group: F(1,45)=0.05, p>0.5; group × condition interaction: F(2,90)=0.53, p>0.5).
In blind individuals, an analogous functional ROI analysis in the right occipital cortex (OC) revealed a functional profile consistent with the response selection pattern observed in the right PFC: greatest response to no-go, followed by the infrequent-go and least to the frequent-go condition (Figure 2, Panel A Right; one-way ANOVA in blind, main-effect of condition: F(2,44)=16.94, p<0.001; no-go vs. infrequent-go: t(22)=2.47, p=0.02, pBonf.=0.04; infrequent-go vs. frequent-go: t(22)=4.15, p<0.001, pBonf.<0.001). In the blind group, sensitivity to no-go versus infrequent-go trials was similar across the occipital cortex ROI and PFC ROI (condition (no-go vs. infrequent-go) by ROI (OC vs. PFC) repeated-measures ANOVA; main effect of condition: F(1,22)=9.17, p=0.006; main effect of ROI: F(1,22)=0.27, p=0.61; condition by ROI interaction: F(1,22)=0.005, p=0.94). The difference between infrequent-go and frequent-go was slightly larger in the PFC than the occipital ROI (condition (infrequent-go vs. frequent-go) by ROI repeated-measures ANOVA; main effect of condition: F(1,22)=14.9, p<0.001; main effect of ROI: F(1,22)=0.01, p=0.93; condition by ROI interaction: F(1,22)=5.22, p=0.03).
In contrast, we did not observe this response profile in the occipital cortices of blindfolded sighted participants (Figure 2, Panel A Right; main-effect of condition: F(2,46)=1.43, p=0.25; no-go vs. infrequent-go: t(23)=0.85, p=0.41; infrequent-go vs. frequent-go: t(23)=0.90, p=0.38). The effects of no-go versus infrequent-go and infrequent-go versus frequent-go were significantly different across the PFC and occipital cortex ROIs in the sighted group (no-go vs. infrequent-go: main effect of condition: F(1,23)=6.63, p=0.02; main effect of ROI: F(1,23)=36.11, p<0.001; condition by ROI interaction: F(1,23)=9.35, p=0.006; infrequent-go vs. frequent-go: main effect of condition: F(1,23)=13.37, p=0.001; main effect of ROI: F(1,23)=28.76, p<0.001; condition by ROI interaction: F(1,23)=23.17, p<0.001). Direct comparison of the blind and sighted groups revealed a significant group-by-condition interaction in the occipital cortex ROI (condition × group ANOVA in occipital lobe; main effect of condition: F(2,90)=17.90, p < 0.001; main effect of group: F(1,45)=15.41, p<0.001; group × condition interaction: F(2,90)=9.48, p<0.001). This difference between groups held across a range of ROI sizes (Figure 2, Panel C).
In bilateral sensorimotor cortices (SMC search-space) we searched for vertices responsive to ‘go’ trials (frequent- and infrequent-go trials > no-go trials). Go-responsive SMC vertices showed greater activity for both of the go conditions relative to the no-go condition in sighted and blind groups (Figure 2, Panel B Left; one-way ANOVA in sighted, main-effect of condition: F(2,46)=55.21, p<0.001; no-go vs. infrequent-go: t(23)=8.19, p<0.001, pBonf.<0.001; infrequent-go vs. frequent-go t(23)=1.60, p=0.12; blind, main-effect of condition: F(2,46)=59.88, p<0.001; no-go vs. infrequent-go: t(22)=9.69, p<0.001, pBonf. <0.001; infrequent-go vs. frequent-go t(22)=0.65, p=0.65). The SMC profile was similar in blind and sighted groups (group × condition ANOVA in SMC: main effect of condition: F(2,90)=113.84, p<0.001; main effect of group: F(1,45)=0.03, p>0.5; group × condition interaction: F(2,90)=0.38, p>0.5). This response profile is consistent with SMC involvement in execution of the button press and associated tactile feedback.
We also searched for vertices responsive to ‘go’ trials (go>no-go) in the right occipital cortex of sighted and blind groups. In this analysis, we observed a main effect of condition, suggesting that cross-modal tactile responses were present in the visual cortex of both the sighted and the blind groups (F(2,90)=7.09, p=0.002) (Figure 2, Panel B Right). These go-preferring vertices showed a main effect of group, reflecting a larger response over rest in the blind group (F(1,45)=6.25, p=0.02) (Figure 2, Panel B Right). However, there was no group-by-condition interaction (group × condition interaction F(2,90)=1.89, p=0.16, all comparisons Greenhouse-Geisser corrected), suggesting that blind and sighted groups do not differ in the degree to which occipital cortex responded to sensorimotor demands. Moreover, within the blind group, go-responsive bilateral SMC and go-responsive right occipital cortices behaved somewhat differently. While the SMC showed high activity for both go trials and below rest activity for no-go trials, the occipital cortex showed above rest activity for the no-go trials and a smaller difference between no-go and go conditions (ROI × condition ANOVA in blind group only; main effect of ROI: F(1,22)=0.03, p>0.5; main effect of condition: F(2,44)=54.46, p<0.001; ROI × condition interaction F(2,44)=10.59, p=0.002, Greenhouse-Geisser corrected for sphericity violation) (Figure 2, Panel B).
To get a more comprehensive sense of the anatomical distribution of ‘visual’ cortex responses to each condition, we color-coded and plotted vertices that respond most to no-go, infrequent-go and frequent-go conditions in all of occipital cortex across groups (Figure 3). In the sighted group, similar proportions of occipital vertices preferred each of the three conditions (proportion of vertices in right occipital lobe of sighted group responding most to no-go trials: M=0.32, SD=0.21, infrequent-go trials: M=0.34, SD=0.21, and frequent-go trials: M=0.34, SD=0.21). By contrast, in the blind group, a larger proportion of vertices preferentially responded to no-go and infrequent-go trials compared to frequent-go trials (right occipital cortex of blind, no-go: M=0.41, SD=0.27, infrequent-go: M=0.41, SD=0.26, frequent-go: M=0.19, SD=0.22). A similar pattern was observed in the left hemisphere (see Supplementary Results).
ROI analysis – Language task
No-go responsive ‘visual’ cortices did not preferentially respond to language over math (or vice versa) (Figure 4; language vs. math: t(15)=0.82, p=0.42). Note that the right occipital ROI continued to show sensitivity to go/no-go conflict, even in the subset of congenitally blind participants who also participated in the language experiment (N=16) (Figure 4; no-go vs. frequent-go: t(15)=4.55, p<0.001; no-go vs. infrequent-go: t(15)=1.84, p=0.09; infrequent-go vs. frequent-go: t(15)=3.76, p=0.002).
Figure 4.
Responses to Language (Lang) and Math (in Betas) in right occipital go/no-go responsive cortices. Leave-one-run out analyses used to extract go/no-go responses in the same participants (N=16) and same vertices: frequent-go (FG), infrequent-go (IG), and no-go (NG). vertices.
Whole- cortex Analysis– Go/no-go task
Consistent with the ROI analyses and with previous studies, the no-go > frequent-go contrast revealed responses in right-lateralized, prefrontal and parietal executive function networks of both blind and sighted groups (Figure 5). Prefrontal activation overlapped substantially with the PFC search-space derived from Neurosynth’s “response inhibition” meta-analysis. Greater activity for no-go than frequent-go was observed along the precentral sulcus, inferior frontal sulcus, inferior frontal junction (IFJ), and intraparietal sulcus (IPS), as well as the superior temporal sulcus and gyrus (STG/STS; Figure 5). Additionally, we observed greater activity for the no-go condition in the supplementary motor area/anterior cingulate cortex (SMA/ACC) and in the posterior precuneus of both groups (Figure 5).
The contrast of infrequent-go > frequent-go trials elicited greater activity in similar executive function regions as the no-go > frequent-go contrast, in both the sighted and blind groups (Figure 5). However, the activation was more bilateral (Figure 5). Fronto-parietal responses to executive demands were somewhat less extensive in the blind relative to the sighted group, but a direct comparison revealed no difference between groups (Figure 5).
In the blind but not sighted group, ‘visual’ cortices responded more to the no-go than to the frequent-go condition (Figure 5). Like fronto-parietal cortices, activity in the occipital cortices of the blind group was more dominant in the right-hemisphere. Occipital cortex activity in the blind group peaked in the cuneus and the lateral middle occipital gyrus (Destrieux et al., 2010). Comparing blind and sighted groups directly, we observed greater activity in the congenitally blind group for no-go relative to frequent-go in lateral and medial regions of the right occipital cortex (Figure 5).
The infrequent-go > frequent-go contrast also revealed activity in occipital cortices, but did so in both the blind and sighted groups (Figure 5). In the blind group, the anatomical distribution of the infrequent-go > frequent-go response overlapped with the no-go response in the cuneus and lateral middle occipital gyrus but also extended into the right fusiform gyrus and the calcarine sulcus bilaterally. As in prefrontal cortices, occipital cortices exhibited reduced right-lateralization for the infrequent-go > frequent-go contrast, relative to the no-go > frequent-go contrast. In the sighted group, infrequent-go > frequent-go occipital cortex activity was anatomically constrained to bilateral posterior calcarine sulci—i.e. foveal V1 (Figure 5). When blind and sighted groups were compared to each other directly, there was greater activity in the blind group in lateral occipital cortices as well as the medial fusiform predominantly in the right hemisphere (Figure 5).
The no-go > infrequent-go contrast revealed only a small cluster of activity in the left superior temporal gyrus and sulcus (STG/STS) of the blind group (Figure 5). Although region of interest analyses revealed that the prefrontal cortices of both groups, and occipital cortices of the blind group, responded more to no-go than infrequent-go trials, this was not observed at the corrected whole-cortex level. Note that, unlike whole-cortex analyses, individual-subject ROIs are more resilient to spatial variation in effects across participants. Furthermore, whole-cortex analyses are corrected for multiple comparisons across the entire cortex. Indeed, at a lower, uncorrected threshold (p<0.05, uncorrected), the no-go > infrequent-go effect was observed in the right STS/STG as well as in a right occipital cluster that overlapped with occipital responses to no-go>frequent-go (see Supplementary Material, Figure S4).
Primary sensory and motor cortices, but not occipital cortices, responded to the sensorimotor demands of the frequent- and infrequent-go trials. For both blind and sighted groups, primary sensory and primary motor cortices in the left-hemisphere were more active for both go conditions than for the no-go condition (Figure 5). For the blind group, greater activity for the go conditions was also observed in the right primary sensory and primary motor cortices, consistent with fact that more blind individuals used their left hand to respond (see Methods). No ‘visual’ cortex activity was observed in the blind group for frequent- and infrequent-go conditions relative to the no-go condition, either in the within- or the between-group comparisons.
Laterality Analysis
We used a laterality index (LI) analysis to compare the lateralization of go/no-go responses across groups. Responses to the no-go > frequent-go contrast were on average right-lateralized in the PFC of the sighted and blind groups (Figure 6b; sighted LI: M=−0.11, SD=0.27; blind: LI M=−0.13, SD=0.31; one-sample, two-tail t-tests of LI=0: sighted: t(23)=−2.11, p<0.05; blind: t(22)=−2.35, p=0.05; between-group, one-tail t test: t(46)=0.20, p=0.42). Activity during no-go trials within the occipital lobe of the blind participants were also right-lateralized on average (Figure 6b; M=−0.24, SD=0.51; one-sample, two-tail t-tests of LI=0: t(22)=−2.25, p=0.04; two-sample, two-tail paired t test between blind frontal and blind occipital lobes: t(22)=1.27, p=0.22). The lateralization of prefrontal and occipital cortex responses to the no-go > frequent-go contrast was correlated across individuals: blind participants with greater right-lateralization in prefrontal responses to go/no-go conflict were also more likely to have greater right-lateralization in occipital responses to go/no-go conflict (Figure 6c; R2 =0.36, p=0.002).
Figure 6.
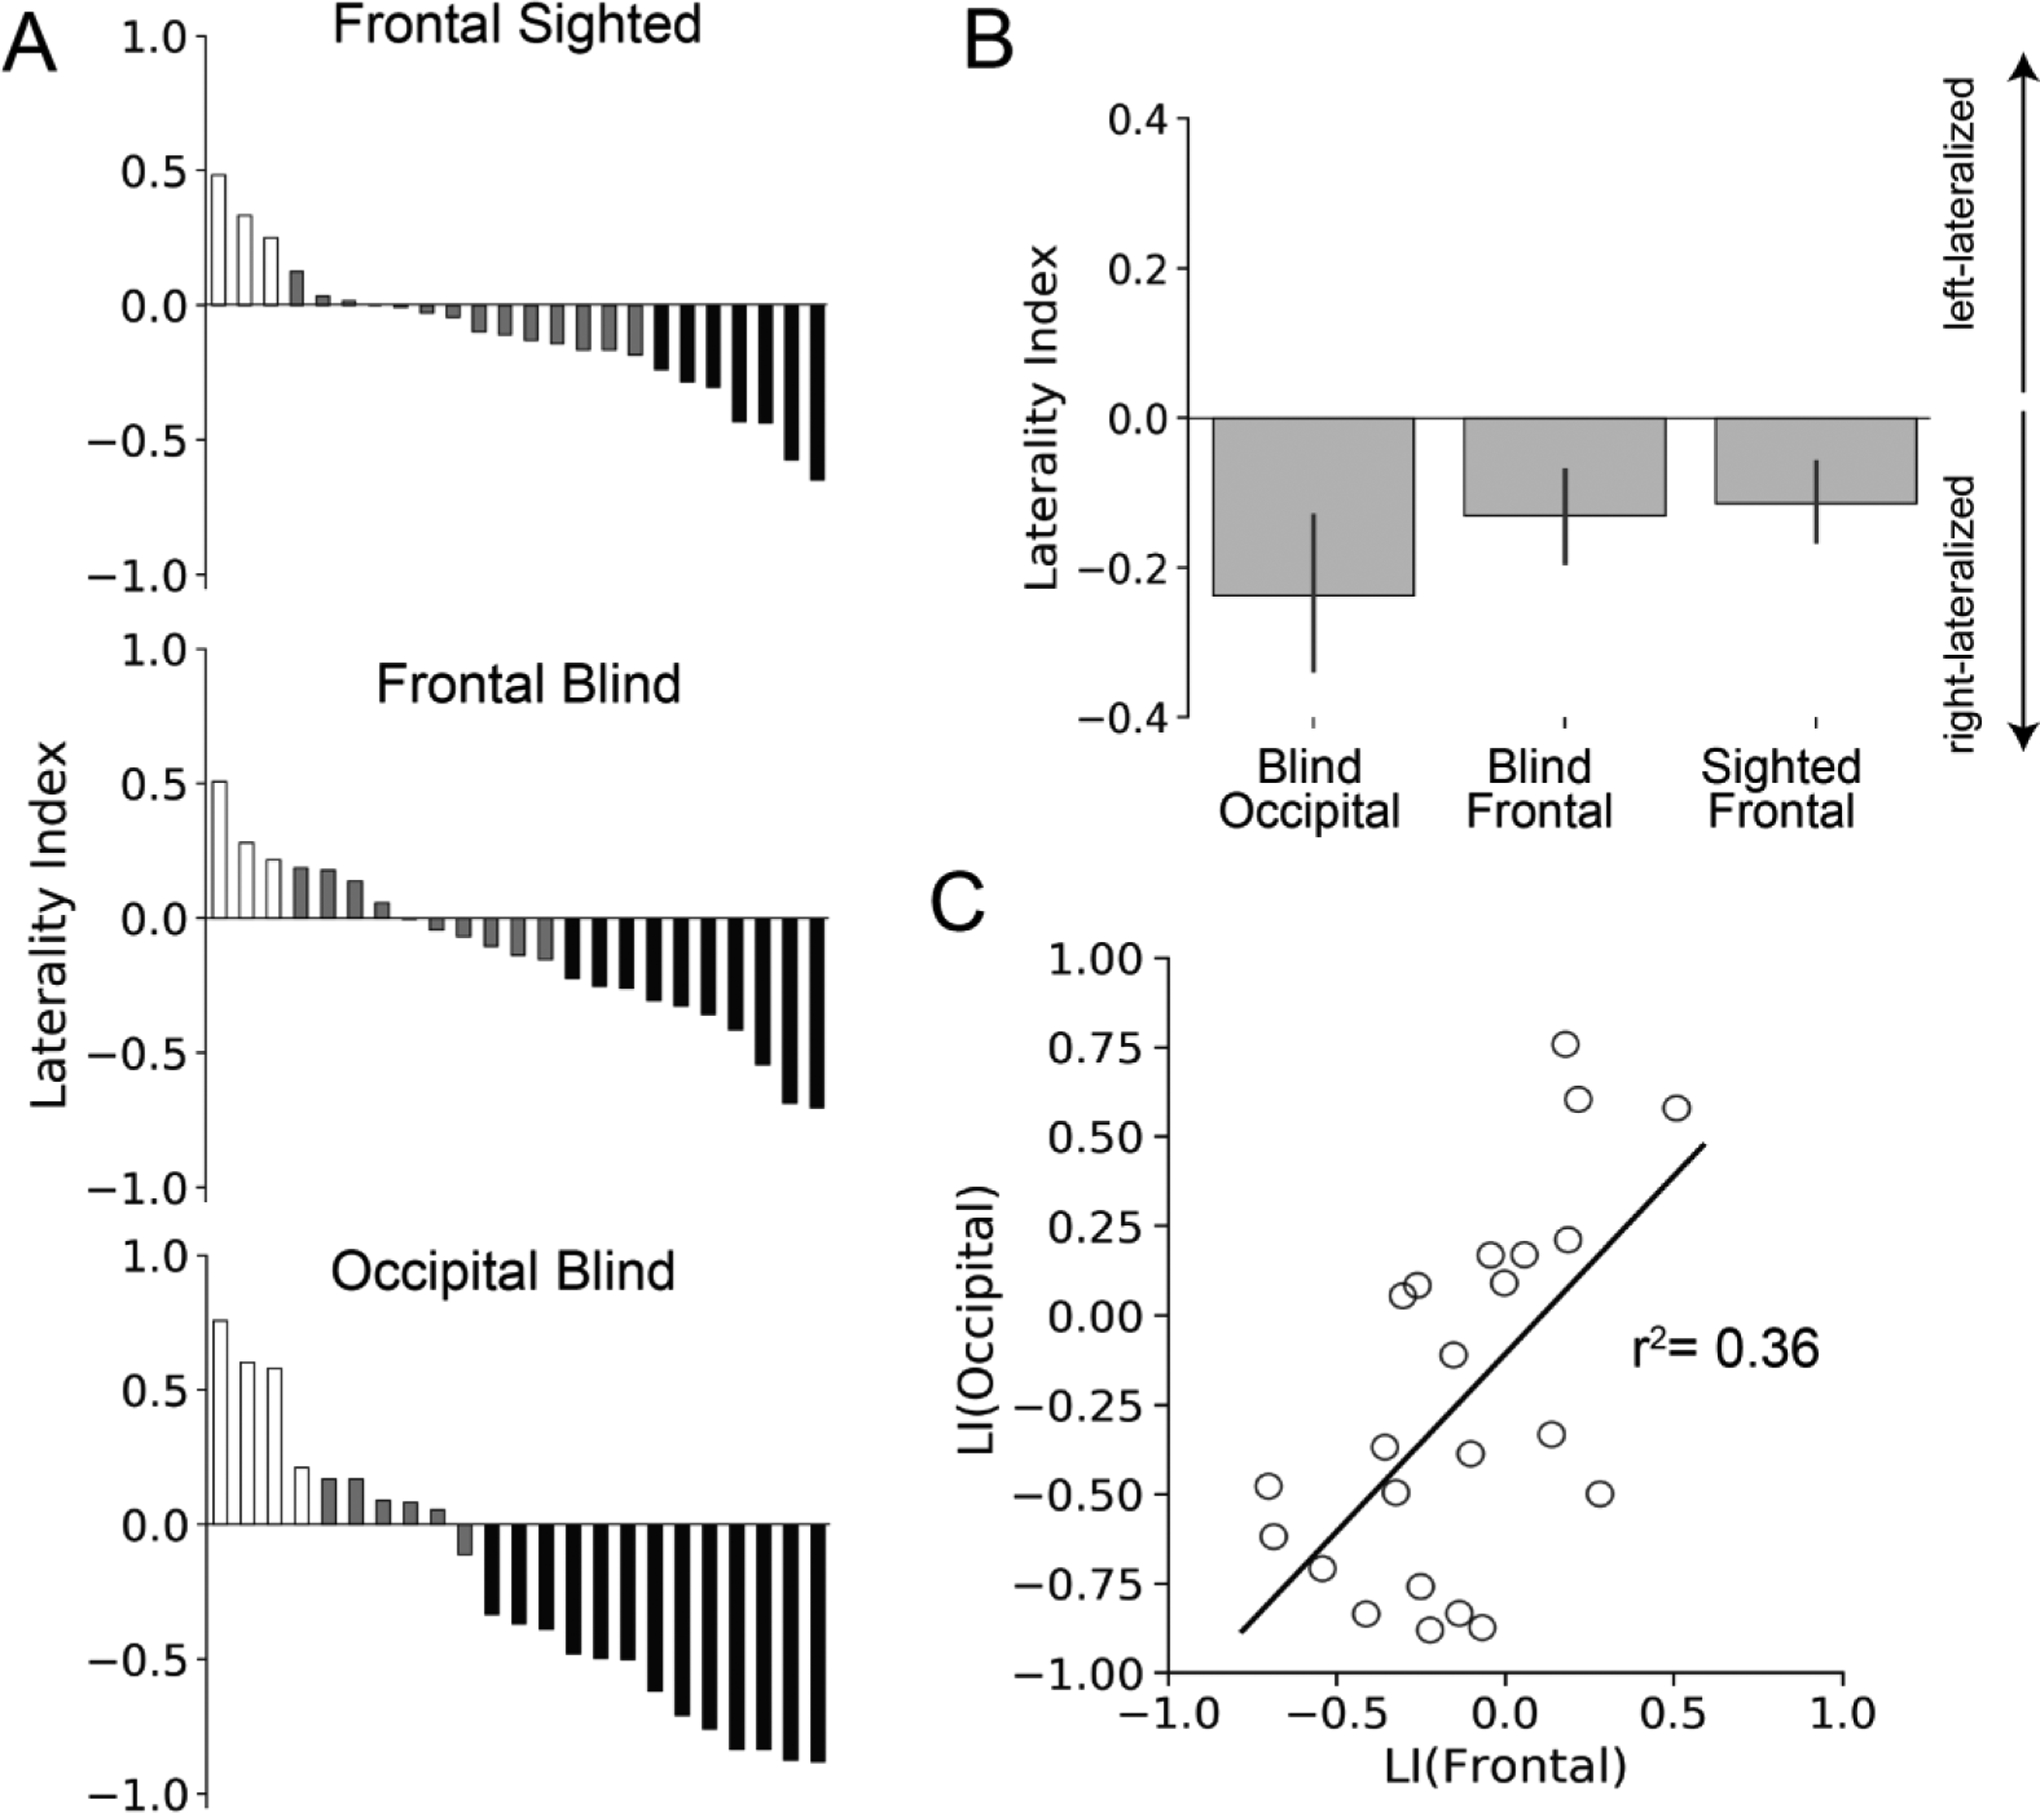
Laterality Results. (A) Sorted LIs for blind and sighted individuals. Each bar represents an individual participant’s LI. LIs range from +1, indicating strong left-lateralization, to −1, indicating strong right lateralization for the no-go > frequent-go contrast. Bars are color-coded according to degree of lateralization, white for left-lateralized, grey bilateral (threshold of +/− 0.2), and black right-lateralized. (B) Average LIs in frontal and occipital lobes of blind and sighted participants. Error bars reflect the standard error of the mean. C. Occipital LIs correlated with frontal LIs in blind individuals.
Although an STG/STS region showed a similar response profile (no-go>infrequent-go>frequent-go) as no-go-responsive occipital cortex in a whole-cortex analyses (Figure 5), the laterality of no-go>frequent-go responses was not correlated across subjects in the occipital and STG/STS ROIs (see Supplementary Results; Figure S6).
Resting-state Functional Connectivity
We compared the resting-state functional connectivity profile of the go/no-go-responsive region of ‘visual’ cortex across blind and sighted groups. An executive-function responsive visual ROI (OC-EF) was defined based on the blind > sighted x no-go > frequent-go contrast (Figure 5, see Methods for details). We assessed the functional connectivity of OC-EF with two prefrontal regions, one responsive to go/no-go conflict (PFC-EF) and one responsive to language (PFC-LG), and two primary sensory regions—primary auditory cortex (A1) and sensory-motor cortex (S1/M1) (Figure 7A).
Figure 7.
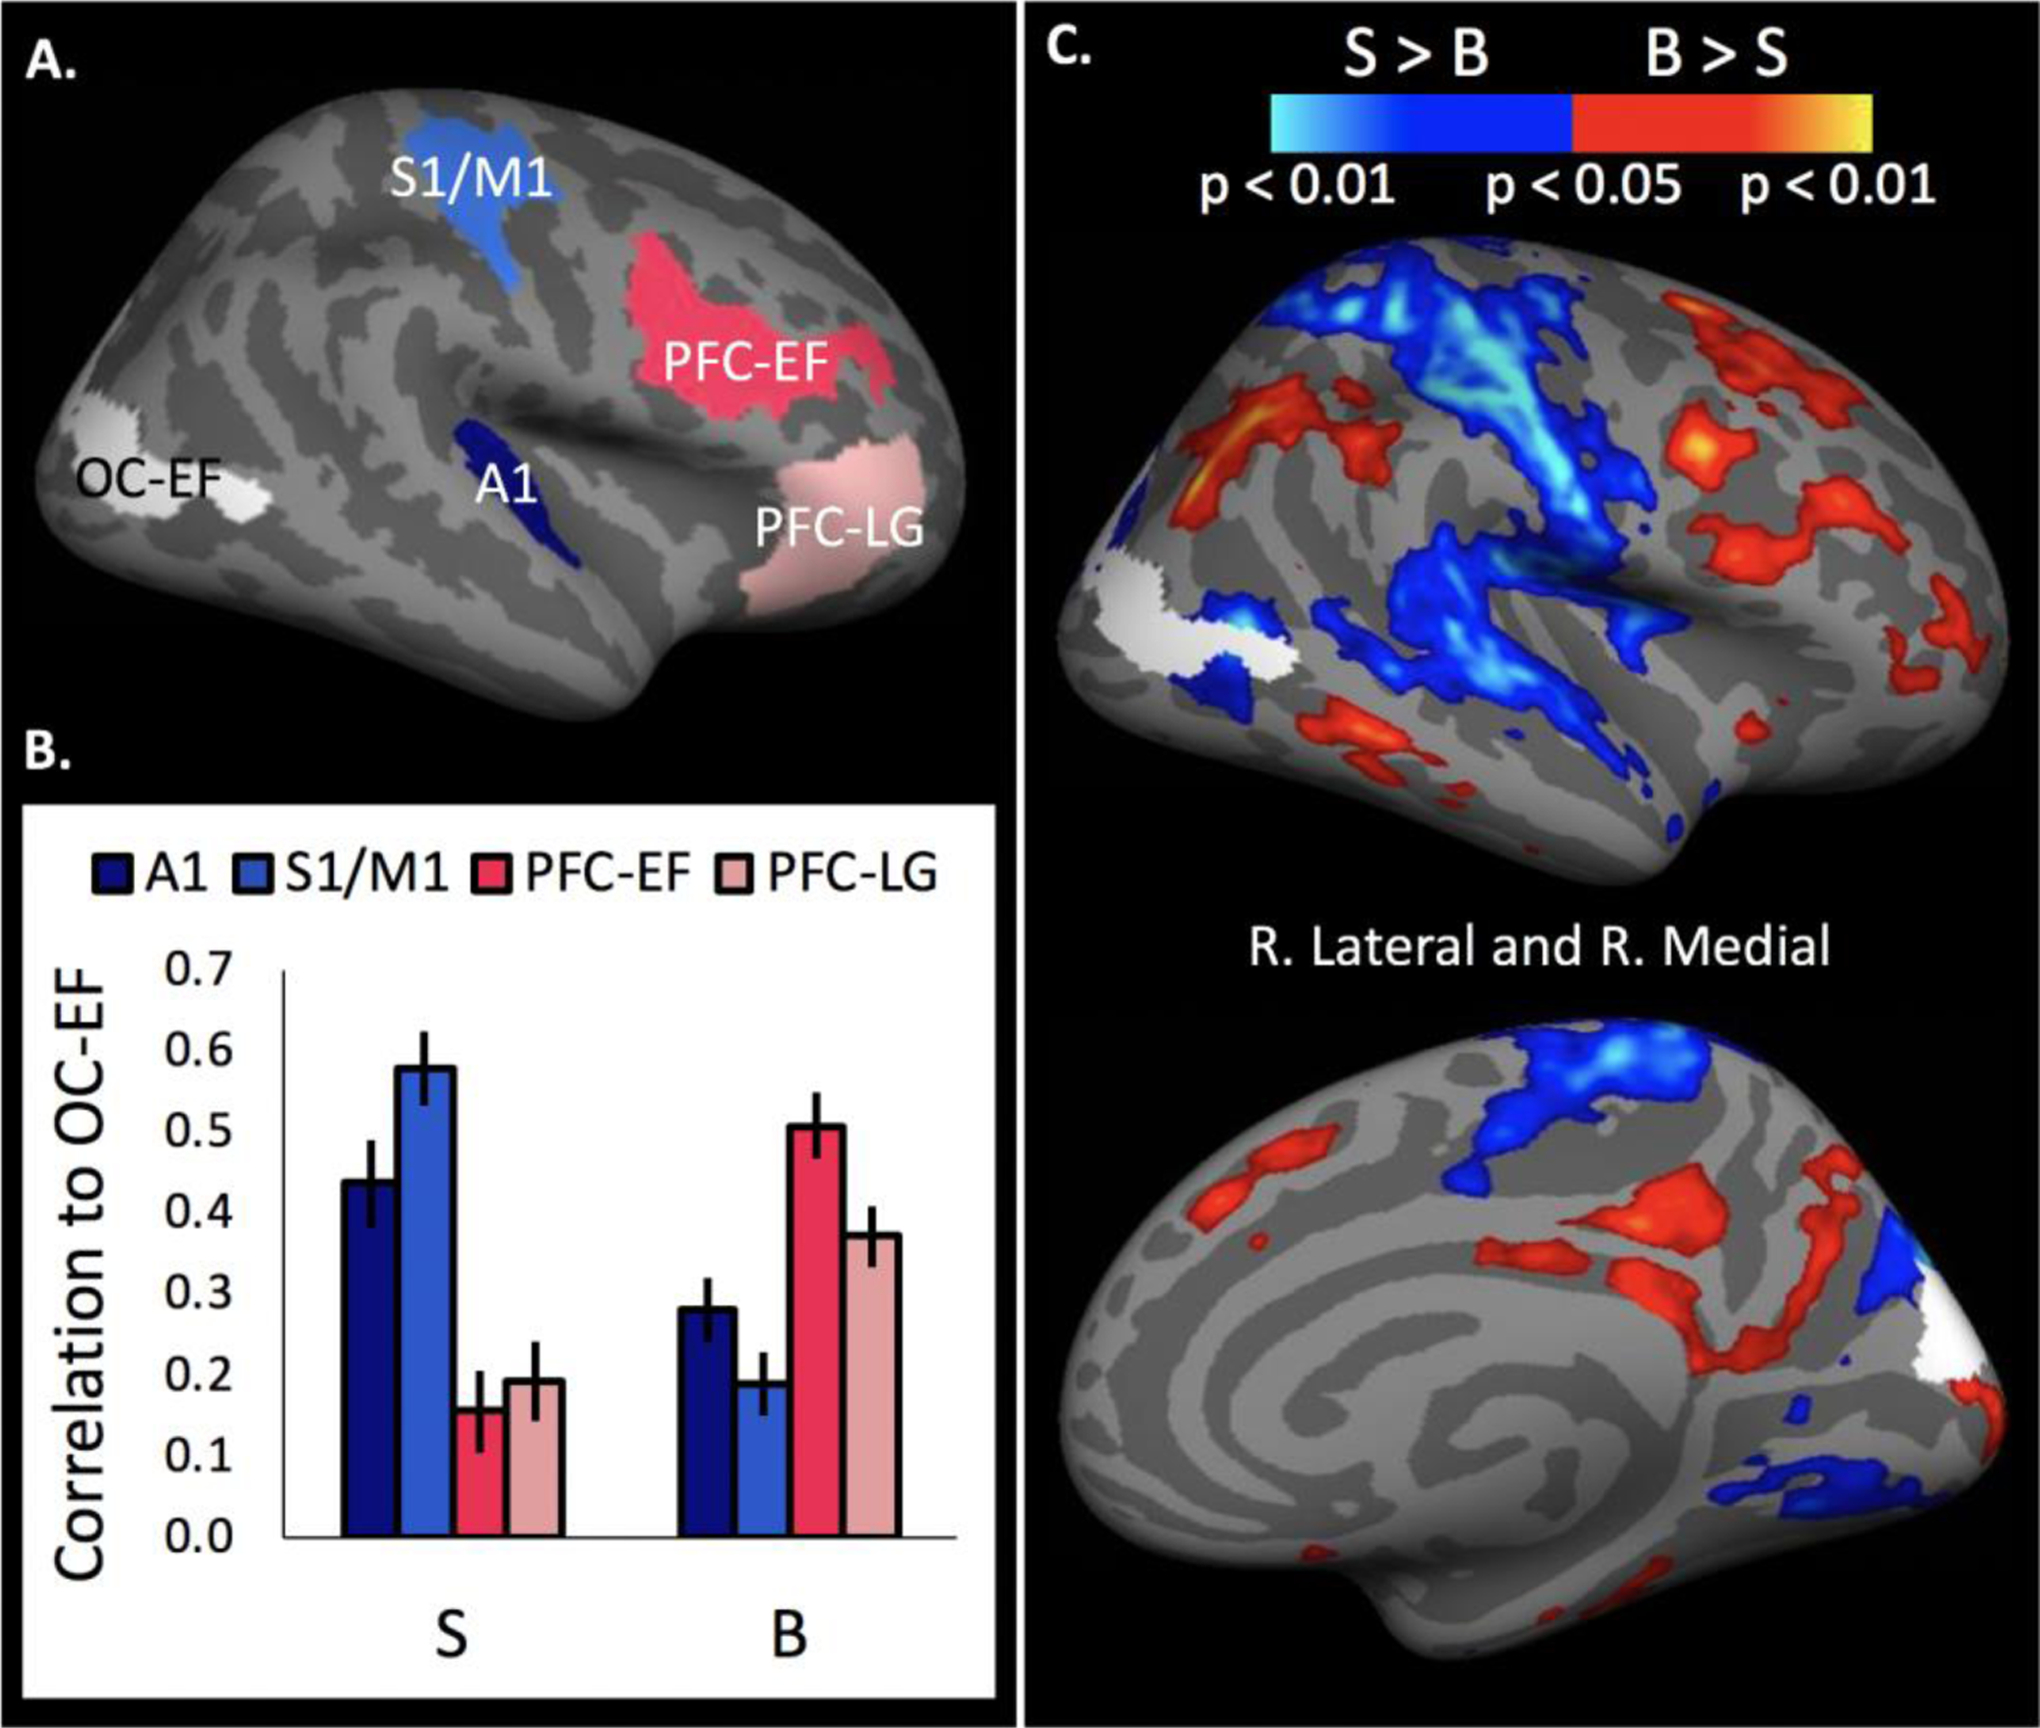
Functional connectivity of no-go executive-function responsive occipital cortex (OC-EF). OC-EF identified as blind>sighted, no-go > frequent-go in a whole-cortex task-based analysis. (A) Regions of interest for resting-state analyses: OC-EF, primary auditory cortex (A1), primary sensorimotor cortices (S1/M1), executive-function responsive prefrontal cortices (PFC-EF), and language responsive prefrontal cortices (PFC-LG). (B) Fisher-transformed correlation coefficients between OC-EF and non-visual ROIs. Error bars indicate the within-subjects SEM.(C) Between-group differences in connectivity of executive-function responsive occipital cortex (OC-EF, in white) across the whole cortex. FDR-corrected contrasts for blind > sighted (in red) and sighted > blind (in blue).
An overall ANOVA comparing connectivity across ROIs and groups revealed a main effect of ROI and a significant group by ROI interaction on functional connectivity with OC-EF (Figure 7B; ROI (PFC-EF, PFC-LG, A1, S1/M1) × group ANOVA: main effect of ROI: F(3,177)=4.19, p=0.02, Greenhouse-Geisser corrected; main effect of group: F(1,59)=0.004, p>0.5; group × ROI interaction: F(3,177)=61.84, p<0.001). Blind individuals showed higher resting-state functional connectivity between the go/no-go-responsive occipital region (OC-EF) and prefrontal cortices (PFC-EF & PFC-LG) than auditory and sensorimotor cortices (A1 and S1/M1), while the sighted group showed the opposite pattern (ROI type (mean of PC-EF and PC-LG vs. mean of A1 and M1/S1) × group ANOVA; main effect of group: F(1,59)=0.04, p>0.5; main effect of ROI type: F(1,59)=5.3, p=0.03, ROI type × group interaction: F(1,59)=93.93, p<0.001). An ANOVA within the blind group revealed higher correlations in resting-state activity between OC-EF and the prefrontal ROIs than between OC-EF and primary sensory regions (within blind ANOVA; mean of PC-EF and PC-LG > mean of A1 and M1/S1: F(1,29)=27.28, p<0.001). The opposite pattern was observed in the sighted group (within sighted ANOVA; mean of PC-EF and PC-LG < mean of A1 and M1/S1: F(1,30)=72.05, p<0.001).
Among the prefrontal cortex ROIs, in blind but not sighted individuals, activity in no-go responsive ‘visual’ cortex (OC-EF) was more correlated with go/no-go-responsive prefrontal cortex than language-responsive prefrontal cortex (group × PFC ROI (PFC-EF vs. PFC-LG) ANOVA: group × PFC ROI interaction: F(1,59)=16.54, p<0.001; blind PFC-EF vs. PFC-LG: t(29)=4.19, p<0.001; sighted PC-EF vs. PC-LG: t(30)=1.35, p=0.19; main effect of group F(1,59)=19.31, p<0.001; main effect of PFC ROI F(1,59)=5.35, p=0.02). This dissociation held when using a language-responsive PFC ROI in the left hemisphere (see Supplementary Results; Figure S7).
Despite showing a similar response profile during the task (Figure 5), the no-go-responsive STG/STS region showed reduced resting-state functional connectivity with no-go responsive occipital cortex in the blind relative to the sighted group. Furthermore, within the blind group, activity in no-go responsive occipital cortex was more correlated with no-go-responsive PFC than the no-go-responsive STG/STS ROI at rest (see Supplementary Results, Figure S7).
A blindness-related change was also observed among sensory/sensorimotor ROIs (group × sensory ROI (S1/M1 vs. A1) ANOVA: group × sensory ROI interaction: F(1,59)=19.65, p<0.001; main effect of group: F(1,59)=21.95, p<0.001; main effect of sensory ROI: F(1,59)=0.91, p=0.34). Activity in OC-EF was more correlated with that of A1 than S1/M1 in the blind group while the opposite was true for the sighted group (blind S1/M1 vs. A1: t(29)=2.72, p=0.01; sighted S1/M1 vs. A1: t(30)=3.52, p=0.001).
In a whole-cortex resting-state analysis, relative to the sighted group, blind individuals’ go/no-go-responsive ‘visual’ cortex (OC-EF) showed increased functional connectivity with fronto-parietal regions and decreased functional connectivity with primary sensorimotor and auditory regions (Figure 7C). The set of regions that preferentially increased their resting-state functional connectivity to OC-EF had a similar anatomical layout as the set of regions that responded to go/no-go conflict (no-go > frequent-go). Areas that were more functionally connected to the OC-EF in blind individuals included the precentral sulcus, superior and inferior frontal sulcus, inferior frontal junction (IFJ), intraparietal sulcus (IPS), middle/inferior temporal gyrus (M/ITG), precuneus, and the anterior and posterior cingulate cortex (ACC and PCC). In contrast, the pre-to-post central gyrus, transverse temporal gyrus, and ventral superior temporal gyrus (STG) were more functionally connected to the OC-EF in sighted than blind individuals.
Note that since the occipital cortex ROI was defined based on the contrast of blind > sighted in the go/no-go task, our analyses do not speak to the resting-state profile of the visual cortex as a whole in the sighted group (or indeed in the blind group). Resting-state analyses were also run in the subset of participants who participated in the go/no-go task and the results were the same (see Supplementary Results, Figure S8).
Discussion
Visual cortices of congenitally blind individuals are sensitive to response selection demands in a non-verbal go/no-go task. A ‘visual’ cortex network responded most to no-go trials (when participants withheld a button press), followed by infrequent-go, and finally the frequent-go trials. This functional profile in occipital cortex is similar to that of a right-lateralized prefrontal executive function network in both blind and sighted groups. The presence of a no-go effect in the ‘visual’ cortex of blind individuals builds upon previously observed ‘visual’ cortex responses to infrequent auditory stimuli in oddball detection paradigms (Kujala et al., 1995a, 1995b, 1997; Liotti et al., 1998; Weaver and Stevens, 2007). First, the current results suggest that blindness-related upregulation of ‘visual’ cortex responses during tasks with non-verbal auditory stimuli do not solely reflect auditory processing, sensitivity to stimulus frequency or sensorimotor feedback associated with a response. In blindness, a subset of the ‘visual’ cortex is sensitive to response selection demands above and beyond these factors. Note that this finding does not preclude the possibility that other regions of the ‘visual’ cortex are sensitive to stimulus saliency or sensorimotor demands in blindness. Indeed, in the current study, while a subset of ‘visual’ cortices responded most to no-go trials, other occipital areas responded most to infrequent sounds that required a button press, relative to both frequent sounds requiring a button press and infrequent sounds that did not (no-go). We further find that sensitivity to response selection demands in occipital cortex is distinct from previously observed occipital responses to language. No-go-responsive ‘visual’ cortices did not show a preference for linguistic versus mathematical stimuli, suggesting that responses to selection demands and language are at least partially differentially localized within occipital cortex. The present results thus add to a growing body of evidence pointing to anatomically separable responses to different cognitive functions within ‘visual’ cortices of blind individuals.
No-go responsive ‘visual’ cortices show both functional similarity and hemispheric co-lateralization with fronto-parietal response selection networks. As noted above, the task-based functional profile of no-go-responsive regions in prefrontal and occipital cortices is similar i.e. both respond most to no-go trials, followed by infrequent-go and finally by frequent-go trials. Second, like prefrontal no-go responses, no-go responses in the occipital cortex are right-lateralized and the degree of right-lateralization in prefrontal and occipital cortices is correlated across blind individuals. This pattern mirrors the relationship observed between language-responsive prefrontal and ‘visual’ cortices in blindness. Both fronto-temporal language networks and language responses in ‘visual’ cortices are, on average, weakly left-lateralized in blind individuals and the degree of left lateralization in fronto-temporal and ‘visual’ cortices is correlated across blind individuals (Röder et al., 2002; Amedi et al., 2003; Bedny et al., 2011; Watkins et al., 2012; Lane et al., 2015; Kanjlia et al., 2016; Pant et al., 2020).
Resting-state functional connectivity analyses further suggest that no-go responsive ‘visual’ regions are incorporated with fronto-parietal response selection networks in blindness. In blind individuals, no-go-responsive ‘visual’ cortices enhance their functional coupling with prefrontal cortices and reduce coupling with both sensorimotor and auditory cortices at rest. This pattern is consistent with previously reported changes in occipital resting-state functional connectivity in blindness (Liu et al., 2007, 2017; Yu et al., 2008; Bedny et al., 2011; Burton et al., 2014; Wang et al., 2014; Deen et al., 2015; Striem-Amit et al., 2015; Kanjlia et al., 2016; Sabbah et al., 2016).
Moreover, although in both the sighted and blind groups, sensitivity to response selection was also observed outside the prefrontal cortex in the superior temporal gyrus (STG/STS), enhancements in functional connectivity of no-go-responsive occipital cortex were specific to the PFC. Resting-state correlations between response selection sensitive portions of ‘visual’ cortex and the STG/STS were reduced in blindness. In this regard, the STG/STS behaves like auditory and sensorimotor cortices and not like the PFC. The resting-state functional connectivity profile of no-go responsive ‘visual’ regions is furthermore specialized within prefrontal cortex in blindness: resting-state activity in no-go-responsive ‘visual’ areas was more correlated with that of no-go responsive prefrontal than that of language-responsive inferior frontal areas.
The above pattern of resting-state functional connectivity together with task-based responses and co-lateralization, suggests that blindness incorporates parts of ‘visual’ cortex into fronto-parietal response selection networks. However, it is important to note that the resting-state functional connectivity analyses presented here are correlational and do not reveal the direction of communication between cortical areas. Whether activity in no-go-responsive occipital regions in blindness is actually driven by signals from prefrontal response selection circuits could be explored in future studies, using methods such as transcranial magnetic stimulation (TMS).
In future work, it would be interesting to precisely characterize the cognitive nature of executive processes that drive ‘visual’ cortex activity in blindness. One possibility is that no-go-responsive ‘visual’ cortices are specifically sensitive to response inhibition, and that intermediate activity for the infrequent-go condition reflects participants “tapping the brakes” on their go response (as in a “continue” trial) (Aron et al., 2014). Alternatively, response selection demands may scale according to novelty of the stimulus-response mapping—i.e., frequent-go has both a habitual stimulus and a habitual response, infrequent-go has a novel stimulus but a habitual response, and no-go has both a novel stimulus and a novel response (Nagahama et al., 2001; Corbetta and Shulman, 2002; Rubia et al., 2003; Mostofsky et al., 2003; Aron et al., 2004; Brass et al., 2005; Nee et al., 2007; Chikazoe et al., 2009; Goghari and MacDonald, 2009; Chikazoe, 2010; Levy and Wagner, 2011; Xu et al., 2017). Both of these accounts suggest that a singular executive function mechanism accounts for elevated responses to no-go and infrequent-go trials, relative to frequent-go trials.
Alternatively, responses to no-go and infrequent-go trials may reflect two different executive function mechanisms. Whereas responses to no-go relative to frequent-go trials are driven by response selection/inhibition demands, responses to infrequent-go relative to frequent-go trials may reflect elevated attention driven by stimulus frequency. Consistent with this idea, in sighted individuals, activity in early visual cortices is influenced by top-down attentional signals during visual tasks and this influence is evident even when visual stimuli are expected but not present (e.g. Buschman and Miller, 2007; Kastner and Ungerleider, 2003; Nurminen et al., 2018; Silver et al., 2007; Squire et al., 2013). In blindness, such top-down attentional systems may enhance their influence on the visual cortex and broaden it to include auditory tasks. Indeed, although ‘visual’ cortex responses to the infrequent-go condition was more pronounced and widespread in the congenitally blind group, we observed greater responses to infrequent-go relative to frequent-go trials around the foveal confluence even in blindfolded sighted participants (Figure 3) (for other examples of cross-modal responses in sighted participants see Driver and Noesselt, 2008; James et al., 2002; Macaluso et al., 2000; Merabet et al., 2004, 2008; Sathian et al., 1997; Zangaladze et al., 1999; Zangenehpour and Zatorre, 2010). Note, however, that attentional signals driven by stimulus frequency cannot explain the preference for no-go compared to infrequent-go trials in the ‘visual’ cortex of the blind group. Thus, according to this account, two distinct executive processes influence occipital activity: attention driven by stimulus frequency and response selection/inhibition demands. Alternatively, as discussed above, the full pattern of data could be related to parametric modulation of response selection demands present in no-go, infrequent-go and frequent-go trials.
Irrespective of which of these accounts is correct, the current results suggest that blindness increases the interaction of visual cortex with fronto-parietal executive function networks. This observation is consistent with known anatomical connectivity patterns between fronto-parietal cortices and the visual system (Maunsell and van Essen, 1983; Selemon and Goldman-Rakic, 1988; Falchier et al., 2002; Rockland and Ojima, 2003; Yeterian et al., 2012). In sighted people, these connections enable communication between visual and higher cognitive systems, as well as between vision and other sensory modalities (Moran and Desimone, 1985; Desimone and Duncan, 1995; Miller and Cohen, 2001). Since there is no evidence of large-scale changes in anatomical connectivity between ‘visual’ and non-visual networks in blindness, functional connectivity changes likely reflect changes in the efficacy of connections that are shared by blind and sighted individuals alike, rather than large-scale changes to anatomical tracts (Shimony et al., 2006; Shu et al., 2009a, 2009b). Likewise, in deafness, auditory areas enhance their responses to visual stimuli, despite no changes in large-scale white-matter properties (e.g., Benetti et al., 2017, 2018). Together with prior findings, our results suggest that the same anatomical connections can play different functional roles across populations with different developmental histories, such as individuals who are born with or without vision.
The co-lateralization of cognitive functions across occipital and prefrontal cortices of blind individuals further supports the idea that long-range anatomical connectivity constrains functional specialization in visual cortex and elsewhere (O’Leary, 1989; Johnson, 2000; Mahon and Caramazza, 2011). ‘Visual’ cortex functions in blind individuals are co-lateralized with the non-visual cortices that classically implement such functions (Röder et al., 2002; Bedny et al., 2011; Lane et al., 2016). Analogously in sighted people, the left-lateralization of reading circuits (i.e., the visual word form area, VWFA) has been linked to connectivity with the left-lateralized fronto-temporal language network (Dehaene et al., 2015; Saygin et al., 2016; Li et al., 2020). Co-lateralization of functions between ‘visual’ and non-visual cortices in blind and sighted people alike is, therefore, consistent with the idea that anatomical connectivity guides functional specialization.
A key question to be addressed in future research concerns the behavioral relevance of executive function responses in the occipital cortex. ‘Visual’ cortices are sensitive to higher cognitive processes, but can they influence behavior? Previous studies have found that blind individuals outperform the sighted in tasks of verbal memory and divided attention (Tillman and Bashaw, 1968; Hull and Mason, 1995; Röder et al., 2001; Amedi et al., 2003; Collignon et al., 2006; Rokem and Ahissar, 2009; Swanson and Luxenberg, 2009; Withagen et al., 2013; Dormal et al., 2016). In the current study, the blind group responded more quickly than the sighted, but was not more accurate. Whether this enhanced speed is related to ‘visual’ cortex plasticity is unknown. There is evidence that ‘visual’ cortices of blind individuals are functionally relevant to some higher cognitive tasks, such as Braille reading and verb generation (Cohen et al., 1997; Amedi et al., 2003, 2004). TMS to ‘visual’ cortices causes blind individuals to make semantic errors when asked to generate a verb to an auditory presented noun (Amedi et al., 2004). More TMS studies are needed to determine the behavioral contribution of ‘visual’ cortices in executive processes.
In summary, regions in deafferented ‘visual’ cortex of blind individuals are sensitive to response selection demands in a non-verbal, non-symbolic go/no-go task. No-go-responsive ‘visual’ regions show similar task-based responses as no-go-responsive regions in prefrontal cortex, are co-lateralized with prefrontal networks and are selectively correlated with no-go-responsive prefrontal regions during rest. No-go responsive ‘visual’ regions are functionally distinct from previously identified language-responsive ‘visual’ regions and are more coupled with no-go-responsive prefrontal regions than inferior frontal language regions during rest. Together, these results suggest that a subset of occipital cortex is driven by non-verbal executive processes in blindness. These data add to a growing body of evidence supporting the idea that blindness enhances sensitivity of occipital cortices to signals from a collection of distinct fronto-parietal networks.
Supplementary Material
Acknowledgements
We would like to thank the blind and sighted individuals who participated in this research, the blind community and the National Federation of the Blind. Without their support this research would not be possible. This work was supported by grants from the Johns Hopkins Science of Learning Institute (80034917), the NIH/NEI (R01 EY027352-01), and a National Science Foundation Graduate Research Fellowship DGE-1232825 (to R.E.L.). We would also like to thank the F. M. Kirby Research Center for Functional Brain Imaging at the Kennedy Krieger Institute.
Footnotes
Declaration of Interests
The authors declare no competing interests.
References
- Abboud S, Cohen L (2019) Distinctive Interaction Between Cognitive Networks and the Visual Cortex in Early Blind Individuals. Cerebral Cortex, 1–18. [DOI] [PubMed] [Google Scholar]
- Amalric M, Denghien I, Dehaene S (2017) On the role of visual experience in mathematical development: Evidence from blind mathematicians. Developmental Cognitive Neuroscience 30, 314–323. [DOI] [PMC free article] [PubMed] [Google Scholar]
- Amedi A, Floel A, Knecht S, Zohary E, Cohen LG (2004) Transcranial magnetic stimulation of the occipital pole interferes with verbal processing in blind subjects. Nature Neuroscience 7(11), 1266–1270. [DOI] [PubMed] [Google Scholar]
- Amedi A, Raz N, Pianka P, Malach R, Zohary E (2003) Early “visual” cortex activation correlates with superior verbal memory performance in the blind. Nature Neuroscience 6(7), 758–766. [DOI] [PubMed] [Google Scholar]
- Aron AR, Robbins TW, Poldrack RA (2004) Inhibition and the right inferior frontal cortex. Trends in Cognitive Sciences 8(4), 170–177. [DOI] [PubMed] [Google Scholar]
- Aron AR, Robbins TW, Poldrack RA (2014) Inhibition and the right inferior frontal cortex: One decade on. Trends in Cognitive Sciences 18(4), 177–185. [DOI] [PubMed] [Google Scholar]
- Barber AD, Caffo BS, Pekar JJ, Mostofsky SH (2013) Effects of working memory demand on neural mechanisms of motor response selection and control. Journal of Cognitive Neuroscience 25(8), 1235–1248. [DOI] [PMC free article] [PubMed] [Google Scholar]
- Bedny M, Pascual-Leone A, Dodell-Feder D, Fedorenko E, Saxe R (2011) Language processing in the occipital cortex of congenitally blind adults. Proceedings of the National Academy of Sciences 108(11), 4429–4434. [DOI] [PMC free article] [PubMed] [Google Scholar]
- Benetti S, Novello L, Maffei C, Rabini G, Jovicich J, Collignon O (2018) White matter connectivity between occipital and temporal regions involved in face and voice processing in hearing and early deaf individuals. NeuroImage 179(March), 263–274. [DOI] [PubMed] [Google Scholar]
- Benetti S, van Ackeren MJ, Rabini G, Zonca J, Foa V, Baruffaldi F, Rezk M, Pavani F, Rossion B, Collignon O (2017) Functional selectivity for face processing in the temporal voice area of early deaf individuals. Proceedings of the National Academy of Sciences 114(31), E6437–E6446. [DOI] [PMC free article] [PubMed] [Google Scholar]
- Brass M, Derrfuss J, Forstmann B, Von Cramon DY (2005) The role of the inferior frontal junction area in cognitive control Marcel. Trends in Cognitive Sciences 9(7), 314–316. [DOI] [PubMed] [Google Scholar]
- Burton H, Snyder AZ, Raichle ME (2014) Resting state functional connectivity in early blind humans. Frontiers in systems neuroscience 8(51), 1–13. [DOI] [PMC free article] [PubMed] [Google Scholar]
- Buschman TJ, Miller EK (2007) Top-down versus bottom-up control of attention in the prefrontal and posterior parietal cortices. Science 315(5820), 1860–1862. [DOI] [PubMed] [Google Scholar]
- Chikazoe J (2010) Localizing Performance of go/no-go tasks to prefrontal cortical subregions. Current Opinion in Psychiatry 23(3), 267–272. [DOI] [PubMed] [Google Scholar]
- Chikazoe J, Jimura K, Asari T, Yamashita KI, Morimoto H, Hirose S, Miyashita Y, Konishi S (2009) Functional dissociation in right inferior frontal cortex during performance of go/no-go task. Cerebral Cortex 19(1), 146–152. [DOI] [PubMed] [Google Scholar]
- Cohen LG, Celnik P, Pascual-Leone A, Corwell B, Falz L, Dambrosia J, Honda M, Sadato N, Gerloff C, Catalá MD, Hallett M (1997) Functional relevance of cross-modal plasticity in blind humans. Nature 389(6647), 180–183. [DOI] [PubMed] [Google Scholar]
- Collignon O, Renier L, Bruyer R, Tranduy D, Veraart C (2006) Improved selective and divided spatial attention in early blind subjects. Brain Research 1075(1), 175–182. [DOI] [PubMed] [Google Scholar]
- Corbetta M, Shulman GL (2002) Control of goal-directed and stimulus-driven attention in the brain. Nature Reviews Neuroscience 3(3), 201–215. [DOI] [PubMed] [Google Scholar]
- Criaud M, Boulinguez P (2013) Have we been asking the right questions when assessing response inhibition in go/no-go tasks with fMRI? A meta-analysis and critical review. Neuroscience and Biobehavioral Reviews 37(1), 11–23. [DOI] [PubMed] [Google Scholar]
- Crollen V, Lazzouni L, Rezk M, Bellemare A, Lepore F, Noël MP, Seron X, Collignon O (2019) Recruitment of the occipital cortex by arithmetic processing follows computational bias in the congenitally blind. NeuroImage 186, 549–556. [DOI] [PubMed] [Google Scholar]
- Deen B, Saxe RR, Bedny M (2015) Occipital cortex of blind individuals Is functionally coupled with executive control areas of frontal cortex. Journal of cognitive neuroscience 27(8), 1633–1647. [DOI] [PubMed] [Google Scholar]
- Dehaene S, Cohen L, Morais J, Kolinsky R (2015) Illiterate to literate: behavioural and cerebral changes induced by reading acquisition. Nature Reviews Neuroscience 16(4), 234–244. [DOI] [PubMed] [Google Scholar]
- Desikan RS, S??gonne F, Fischl B, Quinn BT, Dickerson BC, Blacker D, Buckner RL, Dale AM, Maguire RP, Hyman BT, Albert MS, Killiany RJ (2006) An automated labeling system for subdividing the human cerebral cortex on MRI scans into gyral based regions of interest. NeuroImage 31(3), 968–980. [DOI] [PubMed] [Google Scholar]
- Desimone R, Duncan J (1995) Neural Mechanisms of Selective Visual Attention. Annual Review of Neuroscience 18, 193–222. [DOI] [PubMed] [Google Scholar]
- Destrieux C, Fischl B, Dale A, Halgren E (2010) Automatic parcellation of human cortical gyri and sulci using standard anatomical nomenclature. NeuroImage 53(1), 1–15. [DOI] [PMC free article] [PubMed] [Google Scholar]
- Dormal V, Crollen V, Baumans C, Lepore F, Collignon O (2016) Early but not late blindness leads to enhanced arithmetic and working memory abilities. Cortex 83, 212–221. [DOI] [PubMed] [Google Scholar]
- Driver J, Noesselt T (2008) Multisensory interplay reveals crossmodal influences on “sensory-specific” brain regions, neural responses, and judgments. Neuron 57(1), 11–23. [DOI] [PMC free article] [PubMed] [Google Scholar]
- Eklund A, Nichols TE, Knutsson H (2016) Why fMRI inferences for spatial extent have inflated false-positive rates. Proceedings of the National Academy of Sciences of the United States of America 113(28), 7900–7905. [DOI] [PMC free article] [PubMed] [Google Scholar]
- Falchier A, Clavagnier S, Barone P, Kennedy H (2002) Anatomical evidence of multimodal integration in primate striate cortex. The Journal of neuroscience 22(13), 5749–5759. [DOI] [PMC free article] [PubMed] [Google Scholar]
- Garavan H, Ross TJ, Stein EA (1999) Right hemispheric dominance of inhibitory control: An event-related functional MRI study. Proceedings of the National Academy of Sciences of the United States of America 96(14), 8301–8306. [DOI] [PMC free article] [PubMed] [Google Scholar]
- Goghari VM, MacDonald AW (2009) The neural basis of cognitive control: Response selection and inhibition. Brain and Cognition 71(2), 72–83. [DOI] [PMC free article] [PubMed] [Google Scholar]
- Goldstein M, Brendel G, Tuescher O, Pan H, Epstein J, Beutel M, Yang Y, Thomas K, Levy K, Silverman M, Clarkin J, Posner M, Kernberg O, Stern E, Silbersweig D (2007) Neural substrates of the interaction of emotional stimulus processing and motor inhibitory control: An emotional linguistic go/no-go fMRI study. NeuroImage 36(3), 1026–1040. [DOI] [PubMed] [Google Scholar]
- Hagler DJ, Saygin AP, Sereno MI (2006) Smoothing and cluster thresholding for cortical surface-based group analysis of fMRI data. NeuroImage 33, 1093–1103. [DOI] [PMC free article] [PubMed] [Google Scholar]
- Huettel SA, McCarthy G (2004) What is odd in the oddball task? Prefrontal cortex is activated by dynamic changes in response strategy. Neuropsychologia 42(3), 379–386. [DOI] [PubMed] [Google Scholar]
- Hull T, Mason H (1995) Performance of blind children on digit-span tests. Journal of Visual Impairment and Blindness 89(2 I), 166–169. [Google Scholar]
- James TW, Humphrey GK, Gati JS, Servos P, Menon RS, Goodale MA (2002) Haptic study of three-dimensional objects activates extrastriate visual areas. Neuropsychologia 40(10), 1706–1714. [DOI] [PubMed] [Google Scholar]
- Johnson MH (2000) Functional brain development in infants: Elements of an interactive specialization framework. Child Development 71(1), 75–81. [DOI] [PubMed] [Google Scholar]
- Kanjlia S, Lane C, Feigenson L, Bedny M (2016) Absence of visual experience modifies the neural basis of numerical thinking. Proceedings of the National Academy of Sciences 113(40), 11172–11177. [DOI] [PMC free article] [PubMed] [Google Scholar]
- Kanwisher N, McDermott J, Chun MM (1997) The fusiform face area: a module in human extrastriate cortex specialized for face perception. The Journal of neuroscience 17(11), 4302–4311. [DOI] [PMC free article] [PubMed] [Google Scholar]
- Kastner S, Ungerleider LG (2003) Mechanisms of visual attention in the human cortex. Annual Review of Neuroscience 23, 315–341. [DOI] [PubMed] [Google Scholar]
- Kessler D, Angstadt M, Sripada CS (2017) Reevaluating “cluster failure” in fMRI using nonparametric control of the false discovery rate. Proceedings of the National Academy of Sciences of the United States of America 114(17), E3372–E3373. [DOI] [PMC free article] [PubMed] [Google Scholar]
- Klinge C, Eippert F, Röder B, Büchel C (2010) Corticocortical connections mediate primary visual cortex responses to auditory stimulation in the blind. The Journal of neuroscience 30(38), 12798–12805. [DOI] [PMC free article] [PubMed] [Google Scholar]
- Konishi S, Nakajima K, Uchida I, Sekihara K, Miyashita Y (1998) No-go dominant brain activity in human inferior prefrontal cortex revealed by functional magnetic resonance imaging. European Journal of Neuroscience 10(3), 1209–1213. [DOI] [PubMed] [Google Scholar]
- Kriegeskorte N, Simmons WK, Bellgowan PS, Baker CI (2009) Circular analysis in systems neuroscience: The dangers of double dipping. Nature Neuroscience 12(5), 535–540. [DOI] [PMC free article] [PubMed] [Google Scholar]
- Kujala T, Alho K, Huotilainen M, Ilmoniemi RJ, Lehtokoski A, Leinonen A, Rinne T, Salonen O, Sinkkonen J, Standertskjöld-Nordenstam CG, Näätänen R (1997) Electrophysiological evidence for cross-modal plasticity in humans with early- and late-onset blindness. Psychophysiology 34(2), 213–216. [DOI] [PubMed] [Google Scholar]
- Kujala T, Alho K, Kekoni J, Hämäläinen H, Reinikainen K, Salonen O, Standertskjöld-Nordenstam CG, Näätänen R (1995a) Auditory and somatosensory event-related brain potentials in early blind humans. Experimental Brain Research 104(3), 519–526. [DOI] [PubMed] [Google Scholar]
- Kujala T, Huotilainen M, Sinkkonen J, Ahonen A, Alho K, Hämäläinen, Ilmoniemi, Kajola, Knuutila, Lavikainen (1995b) Visual cortex activation in blind humans during sound discrimination. Neuroscience letters 183(1–2), 143–146. [DOI] [PubMed] [Google Scholar]
- Lane C, Kanjlia S, Omaki A, Bedny M (2015) “Visual” cortex of congenitally blind adults responds to syntactic movement. Journal of Neuroscience 35(37), 12859–12868. [DOI] [PMC free article] [PubMed] [Google Scholar]
- Lane C, Kanjlia S, Richardson H, Fulton A, Omaki A, Bedny M (2016) Reduced left lateralization of language in congenitally blind individuals. Journal of Cognitive Neuroscience 29(1), 65–78. [DOI] [PubMed] [Google Scholar]
- Levy BJ, Wagner AD (2011) Cognitive control and right ventrolateral prefrontal cortex: Reflexive reorienting, motor inhibition, and action updating. Annals of the New York Academy of Sciences 1224(1), 40–62. [DOI] [PMC free article] [PubMed] [Google Scholar]
- Li J, Osher DE, Hansen HA, Saygin ZM (2020) Innate connectivity patterns drive the development of the visual word form area. Scientific Reports 10(1), 1–12. [DOI] [PMC free article] [PubMed] [Google Scholar]
- Liddle PF, Kiehl KA, Smith AM (2001) Event-related fMRI study of response inhibition. Human Brain Mapping 12(2), 100–109. [DOI] [PMC free article] [PubMed] [Google Scholar]
- Liebenthal E, Ellingson ML, Spanaki MV, Prieto TE, Ropella KM, Binder JR (2003) Simultaneous ERP and fMRI of the auditory cortex in a passive oddball paradigm. NeuroImage 19(4), 1395–1404. [DOI] [PubMed] [Google Scholar]
- Liotti M, Ryder K, Woldorff MG (1998) Auditory attention in the congenitally blind: Where, when and what gets reorganized? NeuroReport 9(6), 1007–1012. [DOI] [PubMed] [Google Scholar]
- Liu L, Yuan C, Ding H, Xu Y, Long M, Li Y, Liu Y, Jiang T, Qin W, Shen W, Yu C (2017) Visual deprivation selectively reshapes the intrinsic functional architecture of the anterior insula subregions. Nature 7, 45675. [DOI] [PMC free article] [PubMed] [Google Scholar]
- Liu Y, Yu C, Liang M, Li J, Tian L, Zhou Y, Qin W, Li K, Jiang T (2007) Whole brain functional connectivity in the early blind. Brain 130, 2085–2096. [DOI] [PubMed] [Google Scholar]
- Macaluso E, Frith CD, Driver J (2000) Modulation of human visual cortex by crossmodal spatial attention. Science 289(5482), 1206–1208. [DOI] [PubMed] [Google Scholar]
- Mahon BZ, Caramazza A (2011) What drives the organization of object knowledge in the brain? Trends in Cognitive Sciences 15, 97–103. [DOI] [PMC free article] [PubMed] [Google Scholar]
- Maunsell JH, van Essen DC (1983) The connections of the middle temporal visual area (MT) and their relationship to a cortical hierarchy in the macaque monkey. The Journal of neuroscience 3(12), 2563–2586. [DOI] [PMC free article] [PubMed] [Google Scholar]
- Menon V, Adleman NE, White CD, Glover GH, Reiss AL (2001) Error-related brain activation during a Go/NoGo response inhibition task. Human Brain Mapping 12(3), 131–143. [DOI] [PMC free article] [PubMed] [Google Scholar]
- Merabet L, Thut G, Murray B, Andrews J, Hsiao S, Pascual-Leone A (2004) Feeling by sight or seeing by touch? Neuron 42(1), 173–179. [DOI] [PubMed] [Google Scholar]
- Merabet LB, Hamilton R, Schlaug G, Swisher JD, Kiriakopoulos ET, Pitskel NB, Kauffman T, Pascual-Leone A (2008) Rapid and reversible recruitment of early visual cortex for touch. PLoS ONE 3(8). [DOI] [PMC free article] [PubMed] [Google Scholar]
- Miller EK, Cohen JD (2001) An Integrative Theory of Prefrontal Cortex Function. Annu Rev Neurosci, 167–202. [DOI] [PubMed] [Google Scholar]
- Mitchell TV, Morey RA, Inan S, Belger A (2005) Functional magnetic resonance imaging measure of automatic and controlled auditory processing. NeuroReport 16(5), 457–461. [DOI] [PMC free article] [PubMed] [Google Scholar]
- Moran J, Desimone R (1985) Selective attention gates visual processing in the extrastriate cortex. Science 229(4715), 782–784. [DOI] [PubMed] [Google Scholar]
- Morosan P, Rademacher J, Schleicher A, Amunts K, Schormann T, Zilles K (2001) Human primary auditory cortex: cytoarchitectonic subdivisions and mapping into a spatial reference system. Neuroimage 13(4), 684–701. [DOI] [PubMed] [Google Scholar]
- Mostofsky SH, Schafer JGB, Abrams MT, Goldberg MC, Flower AA, Boyce A, Courtney SM, Calhoun VD, Kraut MA, Denckla MB, Pekar JJ (2003) fMRI evidence that the neural basis of response inhibition is task-dependent. Cognitive Brain Research 17(2), 419–430. [DOI] [PubMed] [Google Scholar]
- Nagahama Y, Fukuyama H, Shibasaki H (2001) Dissociable mechanisms of attentional shifts within the human prefrontal cortex. International Congress Series 1232, 137–145. [DOI] [PubMed] [Google Scholar]
- Nee DE, Wagner TD, Jonides J (2007) Interference resolution: Insights from a meta-analysis of neuroimaging tasks. Cognitive, Affective, & Behavioral Neuroscience 7(1), 1–17. [DOI] [PubMed] [Google Scholar]
- Nichols T, Hayasaka S (2003) Controlling the familywise error rate in functional neuroimaging: A comparative review. Statistical Methods in Medical Research 12(5), 419–446. [DOI] [PubMed] [Google Scholar]
- Nichols TE, Holmes AP (2002) Nonparametric permutation tests for functional neuroimaging: A primer with examples. Human Brain Mapping 15(1), 1–25. [DOI] [PMC free article] [PubMed] [Google Scholar]
- Nieto-Castañón A, Fedorenko E (2012) Subject-specific functional localizers increase sensitivity and functional resolution of multi-subject analyses. NeuroImage 63(3), 1646–1669. [DOI] [PMC free article] [PubMed] [Google Scholar]
- Nurminen L, Merlin S, Bijanzadeh M, Federer F, Angelucci A (2018) Top-down feedback controls spatial summation and response amplitude in primate visual cortex. Nature Communications 9(1). [DOI] [PMC free article] [PubMed] [Google Scholar]
- O’Leary DDM (1989) Do cortical areas emerge from a protocortex? Trends in Neurosciences 12(10), 400–406. [DOI] [PubMed] [Google Scholar]
- Opitz B, Rinne T, Mecklinger A, Von Cramon DY, Schröger E (2002) Differential contribution of frontal and temporal cortices to auditory change detection: FMRI and ERP results. NeuroImage 15(1), 167–174. [DOI] [PubMed] [Google Scholar]
- Pant R, Kanjlia S, Bedny M (2020) A sensitive period in the neural phenotype of language in blind individuals. Developmental Cognitive Neuroscience 41, 100744. [DOI] [PMC free article] [PubMed] [Google Scholar]
- Pauli R, Bowring A, Reynolds R, Chen G, Nichols TE, Maumet C (2016) Exploring fMRI results space: 31 variants of an fMRI analysis in AFNI, FSL, and SPM. Frontiers in Neuroinformatics 10(JUL), 1–6. [DOI] [PMC free article] [PubMed] [Google Scholar]
- Rockland KS, Ojima H (2003) Multisensory convergence in calcarine visual areas in macaque monkey. International Journal of Psychophysiology 50(1–2), 19–26. [DOI] [PubMed] [Google Scholar]
- Röder B, Rösler F, Neville HJ (2001) Auditory memory in congenitally blind adults: A behavioral-electrophysiological investigation. Cognitive Brain Research 11(2), 289–303. [DOI] [PubMed] [Google Scholar]
- Röder B, Stock O, Bien S, Neville H, Rösler F (2002) Speech processing activates visual cortex in congenitally blind humans. European Journal of Neuroscience 16(5), 930–936. [DOI] [PubMed] [Google Scholar]
- Rokem A, Ahissar M (2009) Interactions of cognitive and auditory abilities in congenitally blind individuals. Neuropsychologia 47(3), 843–848. [DOI] [PubMed] [Google Scholar]
- Rubia K, Smith AB, Brammer MJ, Taylor E (2003) Right inferior prefrontal cortex mediates response inhibition while mesial prefrontal cortex is responsible for error detection. NeuroImage 20(1), 351–358. [DOI] [PubMed] [Google Scholar]
- Sabbah N, Authié CN, Sanda N, Mohand-Saïd S, Sahel JA, Safran AB, Habas C, Amedi A (2016) Increased functional connectivity between language and visually deprived areas in late and partial blindness. NeuroImage 136, 162–173. [DOI] [PubMed] [Google Scholar]
- Sadato N, Pascual-Leone A, Grafman J, Ibañez V, Deiber MP, Dold G, Hallett M (1996) Activation of the primary visual cortex by Braille reading in blind subjects. Nature 380(6574), 526–528. [DOI] [PubMed] [Google Scholar]
- Sathian K, Zangaladze C. a a, Hoffman JM, Grafton ST(1997) Feeling with the mind’s eye. NeuroReport 8, 3877–3881. [DOI] [PubMed] [Google Scholar]
- Saxe R, Brett M, Kanwisher N (2006) Divide and conquer: A defense of functional localizers. NeuroImage 30(4), 1088–1096. [DOI] [PubMed] [Google Scholar]
- Saygin ZM, Osher DE, Norton ES, Youssoufian DA, Beach SD, Feather J, Gaab N, Gabrieli JDE, Kanwisher N (2016) Connectivity precedes function in the development of the visual word form area. Nature Neuroscience 19(9), 1250–1255. [DOI] [PMC free article] [PubMed] [Google Scholar]
- Selemon LD, Goldman-Rakic PS (1988) Common cortical and subcortical targets of the dorsolateral prefrontal and posterior parietal cortices in the rhesus monkey: evidence for a distributed neural network subserving spatially guided behavior. Journal of Neuroscience 8(11), 4049–4068. [DOI] [PMC free article] [PubMed] [Google Scholar]
- Shimony JS, Burton H, Epstein AA, McLaren DG, Sun SW, Snyder AZ (2006) Diffusion tensor imaging reveals white matter reorganization in early blind humans. Cerebral Cortex 16(11), 1653–1661. [DOI] [PMC free article] [PubMed] [Google Scholar]
- Shu N, Li J, Li K, Yu C, Jiang T (2009a) Abnormal diffusion of cerebral white matter in early blindness. Human Brain Mapping 30(1), 220–227. [DOI] [PMC free article] [PubMed] [Google Scholar]
- Shu N, Liu Y, Li J, Li Y, Yu C, Jiang T (2009b) Altered anatomical network in early blindness revealed by diffusion tensor tractography. PLoS ONE 4(9), 1–13. [DOI] [PMC free article] [PubMed] [Google Scholar]
- Silver MA, Ress D, Heeger DJ (2007) Neural correlates of sustained spatial attention in human early visual cortex. Journal of Neurophysiology 97(1), 229–237. [DOI] [PMC free article] [PubMed] [Google Scholar]
- Simmonds DJ, Pekar JJ, Mostofsky SH (2008) Meta-analysis of Go/No-go tasks demonstrating that fMRI activation associated with response inhibition is task-dependent. Neuropsychologia 46(1), 224–232. [DOI] [PMC free article] [PubMed] [Google Scholar]
- Squire RF, Noudoost B, Schafer RJ, Moore T (2013) Prefrontal contributions to visual selective attention. Annual Review of Neuroscience 36, 451–466. [DOI] [PubMed] [Google Scholar]
- Striem-Amit E, Ovadia-Caro S, Caramazza A, Margulies DS, Villringer A, Amedi A (2015) Functional connectivity of visual cortex in the blind follows retinotopic organization principles. Brain 138(6), 1679–1695. [DOI] [PMC free article] [PubMed] [Google Scholar]
- Swanson HL, Luxenberg D (2009) Short-term memory and working memory in children with blindness: Support for a domain general or domain specific system? Child Neuropsychology 15(3), 280–294. [DOI] [PubMed] [Google Scholar]
- Tillman MH, Bashaw WL (1968) Multivariate analysis of the WISC scales for blind and sighted children. Psychological Reports 23, 523–526. [DOI] [PubMed] [Google Scholar]
- Van Essen DC (2005) A Population-Average, Landmark- and Surface-based (PALS) atlas of human cerebral cortex. NeuroImage 28(3), 635–662. [DOI] [PubMed] [Google Scholar]
- Vul E, Harris C, Winkielman P, Pashler H (2009) Reply to Comments on “Puzzlingly High Correlations in fMRI Studies of Emotion, Personality, and Social Cognition.” Perspectives on Psychological Science 4(3), 319–324. [DOI] [PubMed] [Google Scholar]
- Wanet-Defalque MC, Veraart C, De Volder a, Metz R, Michel C, Dooms G, Goffinet a (1988) High metabolic activity in the visual cortex of early blind human subjects. Brain research 446(2), 369–373. [DOI] [PubMed] [Google Scholar]
- Wang D, Qin W, Liu Y, Zhang Y, Jiang T, Yu C (2014) Altered resting-state network connectivity in congenital blind. Human Brain Mapping 35(6), 2573–2581. [DOI] [PMC free article] [PubMed] [Google Scholar]
- Watkins KE, Cowey A, Alexander I, Filippini N, Kennedy JM, Smith SM, Ragge N, Bridge H (2012) Language networks in anophthalmia: Maintained hierarchy of processing in “visual” cortex. Brain 135, 1566–1577. [DOI] [PubMed] [Google Scholar]
- Weaver KE, Stevens A. a (2007) Attention and sensory interactions within the occipital cortex in the early blind: an fMRI study. Journal of cognitive neuroscience 19, 315–330. [DOI] [PubMed] [Google Scholar]
- Whitfield-Gabrieli S, Nieto-Castanon A (2012) : A Functional Connectivity Toolbox for Correlated and Anticorrelated Brain Networks. Brain Connectivity 2(3), 125–141. [DOI] [PubMed] [Google Scholar]
- Wilke M, Schmithorst VJ (2006) A combined bootstrap/histogram analysis approach for computing a lateralization index from neuroimaging data. NeuroImage 33(2), 522–530. [DOI] [PubMed] [Google Scholar]
- Withagen A, Kappers AML, Vervloed MPJ, Knoors H, Verhoeven L (2013) Short term memory and working memory in blind versus sighted children. Research in Developmental Disabilities 34(7), 2161–2172. [DOI] [PubMed] [Google Scholar]
- Xu KZ, Anderson BA, Emeric EE, Sali AW, Stuphorn V, Yantis S, Courtney SM (2017) Neural basis of cognitive control over movement inhibition: Human fMRI and primate electrophysiology evidence. Neuron 96(6), 1447–1458.e6. [DOI] [PMC free article] [PubMed] [Google Scholar]
- Yarkoni T, Poldrack RA, Nichols TE, Van Essen DC, Wager TD (2011) Large-scale automated synthesis of human functional neuroimaging data. Nature Methods 8(8), 665–670. [DOI] [PMC free article] [PubMed] [Google Scholar]
- Yeterian EH, Pandya DN, Tomaiuolo F, Petrides M (2012) The cortical connectivity of the prefrontal cortex in the monkey brain. Cortex 48(1), 58–81. [DOI] [PMC free article] [PubMed] [Google Scholar]
- Yu C, Liu Y, Li J, Zhou Y, Wang K, Tian L, Qin W, Jiang T, Li K (2008) Altered functional connectivity of primary visual cortex in early blindness. Human Brain Mapping 29(5), 533–543. [DOI] [PMC free article] [PubMed] [Google Scholar]
- Zangaladze A, Epstein CM, Grafton ST, Sathian K (1999) Involvement of visual cortex in tactile discrimination orientation. Nature 401(6753), 587–590. [DOI] [PubMed] [Google Scholar]
- Zangenehpour S, Zatorre RJ (2010) Crossmodal recruitment of primary visual cortex following brief exposure to bimodal audiovisual stimuli. Neuropsychologia 48(2), 591–600. [DOI] [PubMed] [Google Scholar]
Associated Data
This section collects any data citations, data availability statements, or supplementary materials included in this article.