

Abstract
High fish production is essential to meet the demand, but inappropriate destination of large volumes of byproduct cause environmental pollution. The cutting step for frozen eviscerated fish using band saw machines produces a type of “fish powder” byproduct with high protein content. The objective of this study was to optimize the process of obtaining protein hydrolysates from the cutting byproducts of Serra Spanish Mackerel (SSM) and to evaluate the final product regarding its technological properties. The optimal conditions for obtaining the protein hydrolysate from the cutting byproducts of SSM using a band saw machine were an enzyme:substrate ratio (w/w) of 5.0% and 240 min of enzymatic hydrolysis. Both treatments (+ DH and − DH) yielded volatile compounds with a characteristic fish aroma, and both can be used for flavoring. The − DH hydrolysate showed better technological performance by stabilizing emulsions and retaining oil, and they could be added to emulsified products, improving their technological and sensory aspects. For the antioxidant capacity, the + DH hydrolysate showed higher efficiency, and it was indicated for use in food products, with the aim of extending the shelf life by stabilizing food lipids and proteins, ensuring the quality of the product during storage.
Keywords: Degree of hydrolysis, Optimization, Band saw, Waste, Fish industry
Introduction
The search for healthy food has boosted the aquaculture sector around the world. Thus, large quantities of byproducts have been generated, reaching up to 57% (w/w) of the total catch weight (Silva et al. 2014). The byproducts that are generated, especially those from fish processing, consist of a mixture of flesh and bone fragments; which are rich in proteins and minerals, and they are usually discarded or transformed into low value-added products. However, these materials are rich in high biological-value proteins (Robert et al. 2015), which have high potential for being made into commercially attractive products, thus reducing economic, technological and nutritional waste.
The Serra Spanish Mackerel (SSM) is a marine-coastal pelagic species that is considered migratory and that inhabits most of the Brazilian coast, where it is possible to fish in abundance throughout the year (Quadros and Bolini 2015). The SSM fish has been a 9th place in the ranking of species produced by Brazilian marine extractive fishing. The most current data available shows that SSM fish production in Brazil corresponded to 9,606.5 tons in 2005 (Brazilian Institute of the Environment and Renewable Natural Resources 2007). Recent regional data reported that SSM fish represents 5% of production in the northeastern region of the country (Silva 2018). Due to its extensive fishing and commercialization, SSM is responsible for the generation of direct and indirect jobs, contributing to the fisheries economic sector. In addition, several establishments commercialize SSM steaks, generating a considerable amount of waste after cutting them with band saw machines.
The cutting step for frozen eviscerated fish is usually performed using band saw machines. A band saw machine is a power saw with a sharp blade consisting of a continuous band of toothed metal stretched between two or more wheels to cut material (Todd et al. 1994). This equipment has been developed to cut automatically and safely pieces of any frozen product. The byproduct obtained after cutting frozen fish at the band saw consists mainly of edible fraction of comminuted fish meat, which may contain fragments of bones and crushed scales. The percentage of powdered fish byproduct generated is approximately 2% by weight of SSM fish gutted. In the fishing sector, this byproduct is called "fish powder" or "sawdust", and studies are needed to understand its physicochemical characteristics and technological potential.
The production of fish protein hydrolysates appears to be a viable and promising technology from an industrial and nutritional point of view, which can involve extracting the maximum potential from the byproducts (Witono et al. 2016). The process of preparing protein hydrolysates consists of the cleavage of peptide bonds to obtain lower molecular weight molecules, such as peptides and free amino acids by using hydrolysis-promoting agents, such as proteolytic enzymes (Villamil et al. 2017).
Among the possible enzymes used in the production of fish protein hydrolysate, Alcalase® and Flavourzyme® (Vannabun et al. 2014) stand out. In fact, Alcalase® presents low specificity and high degree of hydrolysis whereas Flavourzyme® is widely used to generate hydrolysates with flavoring potential (Breternitz et al. 2017). Other enzymes, such as Brauzin® and Corolase 7089® can also be used for the same purpose, producing hydrolysates with potential for use in different branches of the pharmaceutical and food industry (Martínez-Alvarez et al. 2015; Sila and Bougatef 2016).
Among their technological properties, protein hydrolysates derived from fish byproducts are promising ingredients for use as emulsified products in foods (Morales-Medina et al. 2016). This product also has volatile compounds that demonstrate potential for use as flavoring agents in salty products, in addition to compounds with antioxidant activity (Kittiphattanabawon et al. 2012; Sukkhown et al. 2018).
No study was found regarding the use of fish cutting byproducts in band saw machines for the preparation of protein hydrolysates. Therefore, the aim of the present study was to optimize the conditions for obtaining and evaluating the technological and nutritional properties of protein hydrolysates obtained from the byproducts from cutting Serra Spanish Mackerel (Scomberomorus brasiliensis) using a band saw machine.
Materials and methods
Collection of byproducts by cutting with a band saw machine
The collection of byproducts generated by the cutting of SSM (Scomberomorus brasiliensis) captured in the state of Pará and marketed in the state of Paraíba (with weights ranging from 1000 to 1400 g and lengths ranging from 55–65 cm) was performed three times so that there were sufficient fish cuttings for sampling. The byproducts were collected shortly after cutting the frozen fish and transported to the laboratory (2 ± 1 °C). From each collection, the samples were collected by quartering, which were subsequently homogenized, resulting in the raw materials used to obtain the protein hydrolysates of Serra Spanish Mackerel (PHSSM). After this, the raw materials were vacuum packed and stored under freezing (− 18 ± 2 °C) for a period not exceeding 10 days, during which studies for obtaining protein hydrolysates were performed.
Optimization process for enzymatic hydrolysis of the byproducts using a band saw
Selection of the enzyme for byproduct hydrolysis in a band saw
To choose the protease with greater efficiency during the hydrolysis process, the hydrolytic activity of the Alcalase® (Bacillus licheniformis) (pH 8; 60 °C), Flavourzyme® (Aspergillus oryzae) (pH 7; 50 °C), Brauzyn® (Carica papaya) (pH 7; 65 °C), and Corolase 7089® (Bacillus subtilis) (pH 7; 50 °C) were analyzed and compared with the byproducts of the SSM cuttings in a band saw machine. The specific optimum temperature and pH conditions for each enzyme suggested by the manufacturers were used. Before the hydrolysis process, the raw material was subjected to heating at 90 °C for 20 min in a water bath (Cientec, model CT-269–9, Brazil), aiming at the standardization of the substrate through the inactivation of endogenous enzymes, and consequently, avoiding possible interference of these with the added enzymes, according to the methodology adapted by Zhan et al. (2013).
The SSM byproduct was added to the reactor together with ultrapure water at a ratio of 1:2 (w/v) with 5% (w/w) enzyme. The mixture was stirred, and the pH was maintained at the optimum conditions for each enzyme by adding 0.5 mol/L NaOH. After 240 min of hydrolysis, the enzyme was inactivated by heating the samples in a water bath at 90 °C for 15 min (ZHANG et al. 2013) for the subsequent centrifugation, filtration of the supernatant, and lyophilization (Labconco, model 7,670,021, Brazil). The enzyme that presented the highest hydrolytic activity in the SSM byproduct was selected to optimize the extraction process.
Optimization of the hydrolysis conditions
To determine the optimal conditions for the hydrolysis process, a 22 Central Composite Rotational Design (CCRD) was performed and 4 factorial points, 4 axial points, and 3 repetitions of the central point were evaluated for a total of 11 experiments, as shown in Table 1. The independent variables investigated here were the enzyme/substrate ratio (X1) (E/S) (w/w) and the hydrolysis time (X2), and the response function was the degree of hydrolysis (Y). The response surface was set up using STATISTICA 5.0 software (Statsoft Inc. Corporate Tulsa, OK, USA) (STATSOFT 2004) and a mathematical model represented by Eq. 1, in which β represents the coefficients of the model as follows:
| 1 |
Table 1.
Design matrix (22 CCRD)
| Assay | Independent variables and levels of variation (X1 and X2) | Response function (Y) | |
|---|---|---|---|
| [E]/[S] (w/w) | Hydrolysis time (min) | Degree of Hydrolysis | |
| 1 | 1.0 | 60.0 | 18.5 |
| 2 | 5.0 | 60.0 | 28.1 |
| 3 | 1.0 | 240.0 | 24.5 |
| 4 | 5.0 | 240.0 | 33.1 |
| 5 | 0.2 | 150.0 | 13.7 |
| 6 | 5.8 | 150.0 | 32.8 |
| 7 | 3.0 | 22.7 | 15.4 |
| 8 | 3.0 | 277.3 | 31.4 |
| 9 | 3.0 | 150.0 | 28.6 |
| 10 | 3.0 | 150.0 | 29.4 |
| 11 | 3.0 | 150.0 | 28.7 |
Coded and actual values of the experimental design
STATISTICA 5.0 software (Statsoft Inc., Tulsa, OK, USA) (Statsoft 2004) was also used to construct the desirability function. To validate the model, the degree of hydrolysis (DH) was measured under the highest and lowest-DH conditions. The results were compared with the predicted values by t-test for independent samples (p ≤ 0.05).
The hydrolysates with higher (+ DH) and lower (− DH) degrees of hydrolysis were subjected to yield analysis, partial chemical characterization, electrophoretic profiling, soluble protein content measurements, and characterizations of the technological properties (ability to emulsify and stabilize emulsions, ability to retain oil, and antioxidant activity).
Analytical procedures
Partial chemical characterization of the protein hydrolysates
The protein hydrolysates were analyzed with respect to their ash and total protein levels according to the methods proposed by Association of Official Analysis Chemists Internatio (2010). The quantification of collagen was performed by determining the hydroxyproline content, where the absorbance was recorded at 558 nm and a conversion factor of 8.0 for hydroxyproline to collagen ratio was used (Association of Official Analysis Chemists Internatio, 2010). The hydrolysates were also subjected to soluble protein analysis using the methodology of Lowry et al. (1951) and subjected to total lipid analysis according to Folch et al. (1957).
Determining the degree of hydrolysis (DH)
The degree of hydrolysis of the proteolytic enzymes in the extract of Serra Spanish Mackerel byproduct was determined through the consumption of NaOH 0,5 M during the hydrolytic process, through the Eq. 2, which was developed by Adler-Nissen (1986).
| 2 |
where DH (%) = degree of hydrolysis; B = base consumption in mL; Nb = normality of the base; 1/α = mean degree of dissociation of the α-NH2 group; PM = protein mass in g; htot = total number of peptide bonds in the protein substrate; and htot = 8 for fish (ROBERT et al. 2015).
Volatile compounds of protein hydrolysates
The profile of volatile compounds from protein hydrolysates obtained after enzyme inativation step was evaluated according to the method adapted from Breternitz et al. (2017). The extraction of the volatiles was performed using the Solid Phase Microextraction (SPME) technique with an SPME device (Supelco). A 30 μm polydimethylsiloxane/carboxen/divinylbenzene (CAR/PDMS/DVB) fiber was used, which was activated according to the manufacturer's recommendations (270 °C/60 min). Ten milliliters of the sample were added to a 20 mL glass jar sealed with a screw cap containing a Teflon-coated septum. Following equilibration at 60 °C for 10 min, the fiber was exposed to the headspace for 60 min. The separation of the compounds was performed in a mass spectrometer produced by Agilent Technologies 5977B (Little Falls, DE, USA) coupled to a 7890B gas chromatograph. The selected column was a VF-5MS (30 m × 0.25 mm × 0.25 μm). Initially, the oven was heated to 40 °C for 2 min, and the temperature was raised to 4 °C/min until reaching 280 °C, remaining at the latter temperature for 10 min, for a total of 72 min. The identification of the compounds was performed by analyzing the fragmentation patterns exhibited in the mass spectra, which was confirmed by comparing their mass spectra with those present in the database provided by NIST (National Institute of Standards & Technology, USA) equipment and by comparing their retention indices with those of known compounds.
Determination of the oil holding capacity (OHC)
An evaluation of the oil holding capacity (OHC) of the hydrolysates was performed according to the method described by Fonkwe and Singh (1996), which is used to calculate the oil volume retained per gram of sample. For this purpose, the protein hydrolysate was homogenized in corn oil at a ratio of 1:20 (w/v) and stirred for 10 min. The mixture was then centrifuged for 15 min at 9072 G. The OHC was calculated by finding the ratio between the amount of absorbed fat (mL) and the sample weight (g).
Determination of the emulsifying capacity (EC) and emulsion stability (ES)
The EC and ES of the protein hydrolysates was evaluated according to Queiroz et al. (2017). The EC was calculated as the percentage ratio between the height of the emulsified layer (cm) and the total height of the liquid in the tube (cm). To determine the ES it was necessary to heat the emulsified sample in a water bath at 80 °C for 30 min and then to cool it in running water for 15 min before centrifugation at 252 g for 15 min. The ES was expressed as the ratio between the height of the remaining emulsified layer (cm) and the total height of the fluid contained in the tube (cm).
Antioxidant activity
2,2-Diphenyl-1-picrylhydrazyl (DPPH●) radical scavenging activity: the effect of the DPPH radical scavenging by protein hydrolysates was analyzed according to the method by Brand-Williams et al. (1995). The DPPH● + radical scavenging ability was expressed in μmol of Trolox Eq./g of sample.
2,2-Azino-bis(3-ethylbenzothiazoline)-6-sulfonic acid (ABTS●+) radical scavenging activity: The ABTS radical scavenging analysis was performed according to Re et al. (1999) and the result was expressed in μmol of Trolox Eq./g of sample.
Ferric Reducing Ability Power (FRAP) method: the reducing ability of samples were determined following the method proposed by Benzie and Strain (1999). The absorbance of each sample was read at 593 nm in a spectrophotometer (Quimis, model Q798U), and the results were expressed in μmol of Trolox Eq./g of sample.
Iron chelating ability: The protein hydrolysates were subjected to an analysis of their iron chelating ability as described by Stookey (1970). The calculation of the iron chelation ability was obtained using the following equation (Eq. 3):
| 3 |
where Ablank = blank absorbance; Asample = absorbance of the sample after 10 min; and A0 = absorbance of sample at time 0.
Statistical analysis of the hydrolysate + DH and − DH study.
The data obtained through all the analyses were subjected to a t-test. All tests were performed using IBM statistical software SPSS, version 23.0, considering a 95% confidence interval.
Results and discussion
Optimization of the hydrolysis process.
Regarding to selection of the enzyme (Fig. 1), the highest DH (33%) was observed in the samples treated with Alcalase®. This value is within the expected DH range (10–35%) for fish protein hydrolysates obtained by protease activity (Halim et al. 2016; Silva et al. 2014). Differences in DH values between the preselected enzymes occurred due to the specificity and mode of action of the different enzymes used here, which promoted the release of peptides with different molecular weights (Silva et al. 2014).
Fig. 1.
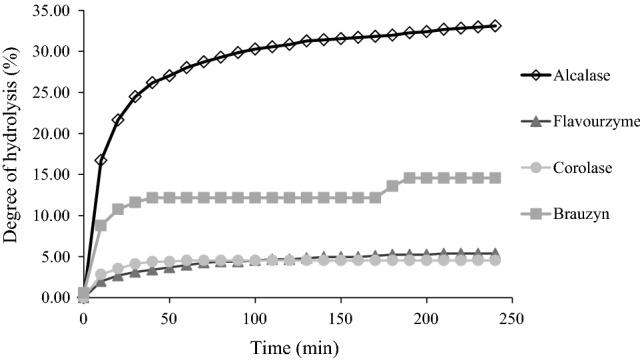
Kinetics of the hydrolysis of Serra Spanish Mackerel byproducts using different proteases
The reduced alcalase specificity allows for the attack of the protein chain in a random manner, promoting the generation of protein hydrolysates with high DH values compared to other proteases (Sila and Bougatef 2016). The high DH observed in protein hydrolysates produced with alcalase has increased applicability due to the presence of a greater peptide diversity, with different technological and bioactive properties (Halim et al. 2016; Sila and Bougatef 2016). Therefore, alcalase was the selected to optimize the hydrolysis process.
The experimental values of DH presented in Table 1 varied as a function of time and the enzyme concentration used in each treatment. Treatment 5 (0.2% alcalase/150 min) showed the lowest DH (13.7%). The highest DH value (33.1%) was observed in treatment 4 (5% alcalase/240 min). An increase in the proteolytic enzyme concentration facilitates the cleavage of peptide chains, producing protein hydrolysates with a high degree of hydrolysis (Sila and Bougatef 2016).
An analysis of the Pareto plot (Fig. 2a) showed that the enzyme: substrate ratio was the factor with the most influence in the response function. The DH increased linearly as a function of the enzyme addition and hydrolysis time, which is consistent with the findings of Noman et al. (2018), who observed the same behavior when evaluating the influence of the enzymatic hydrolysis conditions on the DH and the functional properties of protein hydrolysate from the Chinese sturgeon (Acipenser sinensis), which was obtained by the enzyme action of papain. The effect of the interactions between the independent variables, namely the enzyme/substrate ratio (X1) (E/S) (w/w) and the hydrolysis time (X2), was not significant, considering a 95% confidence interval.
Fig. 2.

Pareto graph (a), surface of responses (b) and desirability function (c) for the optimization of the hydrolysis process. DH (%) = degree of hydrolysis; and [E]/[S] (w/w) = enzyme: substrate ratio
The analysis of variance revealed a coefficient of determination of R 2 = 91.199, which conferred reliability to the mathematical model, and the values calculated with the model equation (Eq. 4) were similar to the experimental data. Furthermore, Eq. 4 can be used to estimate the DH of protein hydrolysates from SSM byproducts. The F test revealed that there was a significant regression with
| 4 |
From the response surface (Fig. 2b), it was confirmed that variations in the enzyme concentrations have a greater influence on the DH than the hydrolysis time. It was also observed that the region where treatment 4 is located, with a hydrolysis time of 240 min and an enzyme–substrate ratio (w/w) of 5%, displayed the highest DH values.
By applying the desirability function (Fig. 2c), it was possible to confirm that the region where treatment 4 is contained, which ranges from 4.2 to 5.3% E:S (w/w) and has a hydrolysis time between 180 and 240 min, corresponds to the optimized variables, as indicated by the response surface. Treatment 4 was considered the optimal point of the enzymatic hydrolysis process in the SSM byproduct.
The selection of treatment 4 combines a high DH and good process efficiency with an intermediate concentration of enzyme, at 5% E:S (w/w), as well as sufficient time (240 min) for enzyme activity, which confers reliability to the process. Peinado et al. (2016) obtained a 31% degree of hydrolysis when hydrolyzing the industrial byproducts from fish processing with the enzyme Flavopro Umami F825MDP®, which is lower than that observed in treatment 4 of the present study.
As a function of the conditions obtained according to their desirability, the hydrolysis process was validated using Eq. 4. Considering the variables X1 = 5% E:S and X2 = 240 min of hydrolysis time, the DH was 34.54%. Under the same conditions, an experiment was performed in triplicate, and the t-test showed no significant difference between the mean of the replicates (33.31 ± 0.85) and predicted DH (34.54%), with the model valid within the 95% confidence interval. Treatments with a higher degree of hydrolysis (+ DH) and a lower degree of hydrolysis (− DH) were selected for subsequent analyses.
Therefore, through the experimental design used in the present study, it was possible to optimize the conditions of the hydrolytic process, preserving the technological properties of PHSSM. Conventional methods for protein hydrolysate production use excessively acidic or basic solutions, accompanied by high temperatures and / or high pressures, which can degrade essential amino acids leaving residues of organic solvents in the final products (Sila and Bougatef 2016; Villamil et al. 2017). In our experiment, we showed that enzymatic hydrolysis is an alternative method that can be used for the production of functional peptides of high commercial value (Sukkhown et al. 2018).
Yield and chemical characterization of the SSM byproduct hydrolysate
The yield performance and partial chemical composition of the protein hydrolysates with higher (+ DH) and lower (-DH) degrees of hydrolysis is shown in Table 2. The yield of lyophilized SSM byproduct hydrolysate powder was 18.92% in + DH and 11.06% in − DH samples. The highest yield performance found in + DH treatment may be attributed to the highest proteolytic activity of alcalase and high NaOH content added on the hydrolytic process of + DH peptides.
Table 2.
Partial chemical composition, technological properties (mean ± standard deviation) and yield of the PHSSM
| Parameters | PHSSM | P value | |
|---|---|---|---|
| + DH | − DH | ||
| Ash (g/100 g) | 11.74 ± 0.80 | 10.02 ± 0.62 | 0.042 |
| Proteins (g/100 g) | 82.89 ± 1.84 | 85.21 ± 0.36 | 0.187 |
| Lipids (g/100 g) | 6.27 ± 0.26 | 4.15 ± 0.50 | 0.009 |
| Collagen (g/100 g) | 2.09 ± 0.01 | 2.71 ± 0.03 | < 0.001 |
| Soluble proteins (mg/ml) | 133.97 ± 0.65 | 140.53 ± 0.86 | 0.001 |
| Yield (%) | 18.92 | 11.06 | |
| Emulsifying capacity (%) | 65.17 ± 0.35 | 62.50 ± 0.23 | < 0.001 |
| Stability of emulsion (%) | 95.36 ± 0.84 | 99.43 ± 0.88 | 0.018 |
| Oil holding capacity (mL/g) | 2.10 ± 0.09 | 2.75 ± 0.05 | 0.001 |
+ DH–higher degree of hydrolysis; − DH–lower degree of hydrolysis; PHSSM–protein hydrolysate from Serra Spanish Mackerel. n = 5
The ash concentration of + DH treatment was higher than − DH sample. During studies in which the pH control of the hydrolytic system is performed by adding a solution with a pH > 7.0, the ash content may vary from 7.5 to 22.5 g/100 g (Villamil et al. 2017). The addition of NaOH during the enzymatic process to maintain the static pH of the reaction medium, as performed in the present study, contributes to an increase in the concentration of ashes as a function of the DH (Morales-Medina et al. 2016; Queiroz et al. 2017).
The protein content did not differ between the treatments with higher (82.89 g/100 g) and lower (85.21 g/100 g) DH, which is compatible with the protein content for fish hydrolysates reported in the literature ranging from 57 to 90% (Robert et al. 2015; Sukkhown et al. 2018). The soluble protein content of the lower DH hydrolysate (140.53 mg/mL) was higher than the value observed in the highest-DH hydrolysate (133.97 mg/mL); however, both tested treatments had a soluble protein content more than two-fold higher than the value observed by Witono et al. (2016) for wader fish hydrolysate. The cleavage of the protein by alcalase may have occurred in peptide bonds that were found in hydrophobic amino acids and consequently promoted their exposure (Morales-Medina et al. 2016). The protein hydrolysis of the SSM byproduct promoted higher protein solubility compared to the initial raw material (data not shown), possibly due to the increase of soluble nitrogen in the hydrolysates generated by the protease activity (Witono et al. 2016).
The total collagen content of the hydrolysates ranged from 2.09 to 2.71 g/100 g of sample. The − DH treatment had a collagen concentration that was higher than that of the + DH. Due to the reduced specificity of the alcalase, the addition of this enzyme could have led to the cleavage of bonds between the collagen molecules in both treatments. However, considering the rigidity of the collagen molecule structure, the hydrolysis time and the higher concentration of enzyme present in the reaction medium used to obtain the + DH treatment promoted the rupture of more bonds between the collagen molecules, resulting in lower concentrations of this protein, in particular, in the + DH sample (Sila and Bougatef 2016).
The lipid concentration of the − DH sample (4.15 g/100 g) was lower than that presented by the + DH sample (6.27 g/100 g). The variation in lipid contents between treatments may be related to the heterogeneity of the raw material, which presented 2.57 g of lipid per 100 g of sample (data not shown). However, the lipid contents of both samples are within the lipid range expected for fish protein hydrolysates (Morales-Medina et al. 2016; Robert et al. 2015; Villamil et al. 2017). The reduced lipid concentration observed in the present study suggests good efficiency for the hydrolysate production process in generating protein compounds, given the high protein content exhibited by both treatments.
Volatile compounds of the byproduct hydrolysates from the band saw
The volatile compounds responsible for the hydrolysate aroma are shown in Table 3, where it can be observed that the percentage of the detected volatile compounds varied as a function of the higher or lower degree of hydrolysis. Aldehydes, alcohols, and amines were the primary chemical groups that influenced the flavor formation of the protein hydrolysates from SSM. However, the presence of some terpenes and ketones identified in a smaller proportion is possibly related to the eating habits of SSM, which consume smaller fish that feed on marine flora (Tocher 2015).
Table 3.
Chemical profile and groups of volatile compounds (area abundance) responsible for the PHSSM aroma
| Compound | + DH (%) | − DH (%) | TR | LRI | Characteristic aroma |
|---|---|---|---|---|---|
| Aldehyde | |||||
| Pentanal* | 1.72 a | 1.43 b | 1.97 | 700 | almond, malt, spicyB |
| Hexanal* | 13.12 b | 14.48 a | 2.94 | 800 | grass, tallow, fatB |
| Heptanal* | 1.80 | – | 7.97 | 905 | fat, citrus, rancidB |
| 2,4-Heptadienal* | 3.65 a | 2.03 b | 11.16 | 1013 | friedB |
| Octanal* | 4.34 a | 3.39 b | 11.60 | 1003 | fat, soap, lemon, greenB |
| Nonanal* | 5.22 a | 2.39 b | 15.34 | 1103 | fat, citric, greenB |
| Decanal* | 9.35 a | 0.93 b | 25.51 | 1200 | soap, orange peel, tallowB |
| Aldehydes subtotal | 39.20 | 24.65 b | |||
| Alcohol | |||||
| Hexanol* | 2.77 b | 4.23 a | 5.27 | 870 | resin, flower, greenB |
| 1-penten-3-ol* | 1.95 b | 2.76 a | 5.46 | 880 | burnedA |
| Heptanol* | 2.17 b | 5.85 a | 10.73 | 970 | herbB |
| 2-octen-1-ol* | 0.87 a | 1.67 b | 14.13 | 1067 | green vegetable, greasy, oily, fruity sweetA |
| Linalool* | 19.99 b | 17.21 a | 14.89 | 1099 | flower, lavenderB |
| Subtotal of alcohols | 27.75 | 31.71 | |||
| Ketone | |||||
| 2-Nonanone* | 1.06 | – | 18.57 | 1093 | Fruity, soap, earthy, cookedA |
| 2-decanone* | 2.72 a | 2.51 b | 22.06 | 1189 | floral, fermented cheeseB |
| Subtotal of ketones | 3.78 | 2.51 | |||
| Pyrazine | |||||
| Pentylpyridine* | 1.24 | – | 23.62 | 1192 | – |
| Subtotal of pyrazines | 1.24 | – | |||
| Terpene | |||||
| D-Limonene* | 7.00 | 1.55 | 12.49 | 1018 | fresh sweet orange citrusB |
| Limonene oxide* | 1.99 b | 2.21 a | 15.5 | 1139 | citrusB |
| Subtotal terpenes | 8.99 | 3.76 | |||
| Amine | |||||
| Trimethylamine* | 19.04 | 37.09 | 1.47 | Doubtful aromaB | |
| Dodecylmethylamine* | – | 0.28 | 46.41 | 1512 | Strong and ammonia aromaB |
| Subtotal of amines | 19.04 | 37.37 |
*Data expressed as percentage (%)
APeinado et al. (2016); Bhttps://www.flavornet.org/flavornet.html
The lowercase letters indicate a significant difference (p < 0.05) in the same volatile compound according to the t-test
The aldehydes presented by the + DH and − DH samples may have been produced from the oxidation of l inoleic acid, which is usually found in fish (Petenuci et al. 2016). The reduced lipid concentration in both treatments observed in the present study might have a relationship with the presence of lipid oxidation compounds, such as heptanal, octanal, and nonanal, which are capable of providing a characteristic fish aroma, indicating that during the enzymatic process, part of its lipid content was oxidized due to the extraction conditions (Laohakunjit, et al. 2014).
The percentage of alcohols showed similar values for both treatments. The compounds 1-penten-3-ol and 2-octen-1-ol that are present in the hydrolysates may promote a greater impact on the flavor formation because, according to Peinado et al. (2016), the unsaturated alcohols generated from n-3 and n-6 polyunsaturated fatty acids usually have much lower perception thresholds than those of the saturated homologs. The presence of the aforementioned oxidation compounds demonstrates the potential hydrolysates from SSM byproduct that could be used as sources of fish and seafood flavoring agents for possible inclusion in products, such as soups and sauces (Laohakunjit et al. 2014).
The comminuted nature of the matrix studied here suggest that the lipid oxidation process previously initiated the hydrolysis (Petenuci et al. 2016). Moreover, the temperature used during the hydrolytic process most likely contributed to an increased lipid oxidation level, and, therefore, the increase in the percentage of volatile compounds and aromatic characteristics of the fish (Laohakunjit et al. 2014).
Technological properties of the hydrolysates of byproducts from the band saw
The emulsifying capacity (Table 2) of 65.17% presented by the + DH sample was higher than that of the − DH sample (62.50%). According to Villamil et al. (2017), the partial hydrolysis of the protein causes changes in the structure and function, increasing the flexibility of the peptides, and, consequently, increasing the surface size and the ability to form emulsions. In addition, in alkaline medium, polypeptides unfold due to negative charges, causing a repulsion that allows for better orientation at the emulsion interface and resulting in more soluble peptides that improve the diffusion at the oil/water interface; the exposure of the hydrophobic groups facilitates protein/lipid interactions (Taheri et al. 2013). The obtained emulsifying capacity values of the samples were higher than those observed by Razali et al. (2015) when they analyzed the emulsifying capacity of hydrolysate from cobia fish skin gelatin.
The stability of the emulsion (Table 2) of the + DH sample was lower than that shown by the − DH treatment. Protein hydrolysates with a low DH have a good ability to stabilize emulsions (Queiroz et al. 2017). The lower solubility exhibited by the − DH sample (data not shown) is probably related to its greater ability to stabilize emulsions because the hydrophobic character confers a greater ability to remain bound to nonpolar compounds such as fat molecules. Peptides of higher molecular weights or high hydrophobic character contribute to the stability of the emulsion due to the weakening of interfacial films around oil droplets, maintaining the stability of the emulsion (Witono et al. 2016). The present study revealed an emulsion stability higher than that described by Elavarasan et al. (2014) during the evaluation of the carp residual water hydrolysate.
The oil holding capacity (Table 2) was lower in the + DH treatment (2.10 mL/g) compared to the − DH sample (2.75 mL/g). According to Halim et al. (2016), the ability of the fish protein hydrolysate to retain fat can vary from 1.0 to 10.8 mL/g. The reduction of the peptide size promoted by enzymatic proteolysis can promote a reduced oil holding capacity, because it results primarily from the physical entrapment of oil, with higher values in protein hydrolysates having a lower DH (Halim et al. 2016; Queiroz et al. 2017). The fact that the − DH treatment has a greater capacity for holding oil, which is a substance formed by primarily hydrophobic compounds, may be attributed to the lower water solubility presented by the − DH treatment in comparison to the + DH.
The stability of the emulsion and the oil holding capacity showed the same behavior because the ability to hold oil positively influences the ability to stabilize emulsions (Witono et al. 2016). The nonpolar character of the peptides presented by the − DH treatment facilitates their bond to fat molecules, and this property is fundamental for the maintenance of the emulsion stability, in which the trapping of fat molecules in some products is necessary to ensure desirable sensory characteristics, such as the textures of sauces, soups, and emulsified meat products (Noman et al. 2018).
Considering the aforementioned technological properties, both hydrolysates showed potential for use in the production of pharmaceuticals and food products, such as emulsified products, including emulsified meat (sausage and mortadella), to improve technological aspects that directly influence sensory parameters, such as appearance and texture, and to increase the nutritional value of these products due to the high protein concentration of the hydrolysates evaluated in the present study.
The antioxidant activity assessed using the DPPH method (Table 4) was lower in the -DH sample than in the + DH treatment. The literature reports that the range of expected values for the antioxidant capacity assessed by the DPPH method ranges from approximately 1.5 to 27.5 μmol TE/g of sample in fish protein hydrolysates (Kittiphattanabawon et al. 2012; Sarteshnizi et al. 2019). The reduction in the length of the peptide chains caused by the increased DH directly influences the antioxidant activity of hydrolysates, and the changes in the levels and composition of free amino acids and small peptides during hydrolysis are associated with the increased antioxidant activity of hydrolysates (Putra et al 2018; Sila and Bougatef 2016).
Table 4.
Antioxidant activity and chelating ability (mean ± standard deviation) PHSSM
| Parameters | + DH | − DH | P value |
|---|---|---|---|
| FRAP (μmol TE/g sample) | 10.65 ± 0.30 | 7.90 ± 0.49 | 0.001 |
| DPPH (μmol TE/g sample) | 24.77 ± 1.52 | 7.25 ± 2.36 | 0.000 |
| ABTS (μmol TE/g sample) | 1751.21 ± 101.60 | 1358.19 ± 41.74 | 0.003 |
| Chelating agent (% inhibition) | 79.04 ± 0.29 | 68.04 ± 0.29 | < 0.001 |
+ DH: higher degree of hydrolysis; − DH: lower degree of hydrolysis; and PHSSM: protein hydrolysate from Serra Spanish Mackerel. n = 5
The antioxidant activity of the hydrolysates observed by ABTS method (Table 4) was higher in the + DH sample (1751.21 μmol TE/g sample) than in the − DH treatment (1358.19 μmol TE/g sample). These results are close to those reported by Feng et al. (2018) for peptides, which comprise a range from 1421.38 to 3467.10 μmol TE/g of sample. According to Lassoued et al. (2015), smaller peptides are more likely to transfer hydrogen electrons or atoms that can react with free radicals to form compounds of greater stability.
The FRAP of the + DH treatment was higher than the value observed in the − DH sample, indicating that the peptides of the byproducts from the SSM cutting with a higher DH have a better ability to complex with the Fe3+ ion and reduce it to Fe2+, preventing the production of free radicals. Sai-Ut et al. (2014) observed FRAP values for fish gelatin hydrolysates that were lower than those observed in the present study. Lower molecular chain peptides, which are present in hydrolysates with a higher degree of hydrolysis, are usually more active and stable and act as electron donors that block chain reactions (Halim et al. 2016).
The chelating ability showed a significant difference as a function of the DH, and the + DH sample had the highest values for this parameter compared to the − DH. Both treatments showed a metal chelating ability that was higher than that of BHT, a synthetic antioxidant widely used by the food and pharmaceutical industries, as evaluated by Razali et al (2015). Protein cleavage gives peptides a greater ability to bind to metal ions due to an increased concentration of carboxylic and amino groups in the peptides (Sarteshnizi et al. 2019). Moreover, fish byproducts possess amino acids that have an aromatic ring, such as phenylalanine, which are able to chelate metals (Halldorsdottir et al. 2014).
The high antioxidant capacity of protein hydrolysates demonstrates their potential for commercial use. Protein hydrolysates that exhibit this functional property are widely desirable because they can be applied to food products, and their ability to stabilize lipids in the food enables shelf life extension, ensuring product quality throughout storage (Queiroz et al. 2017).
Among all the technological properties evaluated, the excellent ability to form and stabilize emulsion and the antioxidant activity stand out. Therefore, both PHSSM treatments have potential for use in food products to improve emulsion properties and substitute synthetic antioxidants.
Conclusion
According to our results, the optimal conditions for the highest proteolysis of the cutting byproduct from Serra Spanish Meckerel were established in 240 min of enzymatic hydrolysis and 5.0% of the alcalase®: substrate ratio (w/w). The high protein and low lipid contents in the optimized hydrolysate suggest the potential for their use as food supplementation for humans and animals. Both hydrolysates (− DH and + DH) presented high flavoring potential since shows volatile compounds with a characteristic fishy aroma. The − DH PHSSM presented better ability to stabilizing emulsions and to retain oil, and they could be added to emulsified products to improve the technological and sensory traits. + DH PHSSM showed greater antioxidant capacity, being indicated for use in food products to prolong their shelf life through the ability to stabilize lipids and proteins, guaranteeing the quality of the product during storage. However, further studies should be conducted in order to evaluate the role of the PHSSM in the food processing and storage.
Acknowledgements
We thank the fish processing company for ceding the by-product used in the present study and thank the CNPQ for the grant of a research grant during the development of this work.
Footnotes
Publisher's Note
Springer Nature remains neutral with regard to jurisdictional claims in published maps and institutional affiliations.
References
- Adler-nissen J. Enzymic hydrolysis of food proteins. New York: Elsevier Applied Science Publishers; 1986. [Google Scholar]
- Association of Official Analysis Chemists International, AOAC . Association of official analytical chemists. Gaithersburg: Official Methods of Analysis; 2010. [Google Scholar]
- Benzie IFF, Strain JJ. Ferric reducing/antioxidant power assay: direct measure of total antioxidant activity of biological fluids and modified version for simultaneous measurement of total antioxidant power and ascorbic acid concentration. Method Enzym. 1999;299:15–27. doi: 10.1016/S0076-6879(99)99005-5. [DOI] [PubMed] [Google Scholar]
- Brand-Wiliams W, Cuvelier ME, Berset C. Use of a free radical method to evaluate antioxidant activity. Trends Food Sci Technol. 1995;28:25–30. doi: 10.1016/S0023-6438(95)80008-5. [DOI] [Google Scholar]
- Breternitz NR, Fidelis CRV, Silva VM, Eberlin MN, Hubinger MD. Volatile composition and physicochemical characteristics of mussel (Perna perna) protein hydrolysate microencapsulated with maltodextrin and n-OSA modified starch. Food Bioprod Process. 2017;105:12–25. doi: 10.1016/j.fbp.2017.05.008. [DOI] [Google Scholar]
- Elavarasan K, Kumar NV, Shamasundar BA. Antioxidant and functional properties of (FPH) from fresh water carp (Catla catla) as influenced by the nature of enzyme. J Food Process Preserv. 2014;38:1207–1214. doi: 10.1111/jfpp.12081. [DOI] [Google Scholar]
- Feng L, Peng F, Wang X, Li M, Lei H, Xu H. Identification and characterization of antioxidative peptides derived from simulated in vitro gastrointestinal digestion of walnut meal proteins. Food Res Int. 2018;116:518–526. doi: 10.1016/j.foodres.2018.08.068. [DOI] [PubMed] [Google Scholar]
- Folch J, Lees M, Stanley S. A simple method for the isolation and purification of total lipids from animal tissues. J Biol Chem. 1957;226:497–509. doi: 10.1016/S0021-9258(18)64849-5. [DOI] [PubMed] [Google Scholar]
- Fonkwe LG, Singh RK. Protein Recovery from mechanically deboned Turkey residue by enzymic hydrolysis. Process Biochem. 1996;31:605–616. doi: 10.1016/S0032-9592(95)00101-8. [DOI] [Google Scholar]
- Halim NRA, Yusof HM, Sarbon NM. Functional and bioactive properties of fish protein hydolysates and peptides: a comprehensive review. Trends Food Sci Technol. 2016;51:24–33. doi: 10.1016/j.tifs.2016.02.007. [DOI] [Google Scholar]
- Halldorsdottir SM, Sveinsdottir H, Gudmundsdottir A, Thorkelsson G, Kristinsson HG. High quality fish protein hydrolysates prepared from by-product material with Fucus vesiculosus extract. J Funct Foods. 2014;9:10–17. doi: 10.1016/j.jff.2014.04.009. [DOI] [Google Scholar]
- Brazilian Institute of the Environment and Renewable Natural Resources (2007) Fisheries statistics 2005. Brasília, Brazil
- Kittiphattanabawon P, Benjakul S, Visessanguan W, Shahidi S. Gelatin hydrolysate from blacktip shark skin prepared using papaya latex enzyme: antioxidant activity and its potential in model systems. Food Chem. 2012;135:1118–1126. doi: 10.1016/j.foodchem.2012.05.080. [DOI] [PubMed] [Google Scholar]
- Laohakunjit N, Selamassakul O, Kerdchoechuen O. Seafood-like flavour obtained from the enzymatic hydrolysis of the protein by-products of seaweed (Gracilaria sp.) Food Chem. 2014;158:162–170. doi: 10.1016/j.foodchem.2014.02.101. [DOI] [PubMed] [Google Scholar]
- Lassoued I, Mora L, Barkia A, Aristoy M, Nasri M, Toldrá F. Bioactive peptides identified in thornback ray skin's gelatin hydrolysates by proteases from Bacillus subtilis and Bacillus amyloliquefaciens. J Proteomics. 2015;128:8–17. doi: 10.1016/j.jprot.2015.06.016. [DOI] [PubMed] [Google Scholar]
- Lowry OH, Rosebrough NJ, Farr AL, Randall RJ. Protein measurement with the Folin phenol reagent. J Biol Chem. 1951;193:265–275. doi: 10.1016/S0021-9258(19)52451-6. [DOI] [PubMed] [Google Scholar]
- Martínez-Alvarez O, Chamorro S, Brenes A (2015) Protein hydrolysates from animal processing by-products as a source of bioactive molecules with interest in animal feeding: a review. Food Res Int 73:204–212. 10.1016/j.foodres.2015.04.005
- Morales-Medina R, Tamm F, Guadix AM, Guadix EM, Drusch S. Functional and antioxidant properties of hydrolysates of sardine (S. pilchardus) and horse mackerel (T. mediterraneus) for the microencapsulation of fish oil by spray-drying. Food Chem. 2016;194:1208–1216. doi: 10.1016/j.foodchem.2015.08.122. [DOI] [PubMed] [Google Scholar]
- Noman A, Xu A, AL-BukhaitiAbedAliRamadhanaXia WQSMAHAHW. Influence of enzymatic hydrolysis conditions on the degree of hydrolysis and functional properties of protein hydrolysate obtained from Chinese sturgeon (Acipenser sinensis) by using papain enzyme. Process Biochem. 2018;67:19–28. doi: 10.1016/j.procbio.2018.01.009. [DOI] [Google Scholar]
- Peinado I, Koutsidis G, Ames J. Production of seafood flavor formulations from enzymatic hydrolysates of fish by-products. Food Sci Technol. 2016;66:444–452. doi: 10.1016/j.lwt.2015.09.025. [DOI] [Google Scholar]
- Petenuci ME, Rocha INA, Sousa SC, Schneider VVA, Costa LAMA, Visentainer JV (2016) Seasonal variations in lipid content, fatty acid composition and nutritional profiles of five freshwater fish from the Amazon Basin. J Am Oil Chem' Soc 93:1373–1381. 10.1007/s11746-016-2884-8
- Putra SNKM, Ishak NH, Sarbon NM. Preparation and characterization of physicochemical properties of golden apple snail (Pomacea canaliculata) protein hydrolysate as affected by different proteases. Biocatal Agric Biotechnol. 2018;13:123–128. doi: 10.1016/j.bcab.2017.12.002. [DOI] [Google Scholar]
- Quadros DA, Bolini HMA. Biometric characterization, proximate composition, and fillet yield and waste of Serra Spanish mackarel (Scomberomorus brasiliensis) Bol Inst de Pesca. 2015;41:877–888. [Google Scholar]
- Queiroz ALM, Araújo ARR, Pacheco MTB, Madruga MS. Potential use of goat by-products to obtain protein hydrolysates. Food Biosci. 2017;20:19–27. doi: 10.1016/j.fbio.2017.07.009. [DOI] [Google Scholar]
- Razali AN, Sarbon NM, Amin AM. Antioxidant activity and functional properties of fractionated cobia skin gelatin hydrolysate at different molecular weight. Int Food Res J. 2015;22:651–660. [Google Scholar]
- Re R, Pellegrini N, Proteggente A, Pannala A, Yang M, Rice-Evans C. Antioxidant activity applying an improved ABTS radical cation decolorization assay. Free Radical Biol Med. 1999;26:1231–1237. doi: 10.1016/S0891-5849(98)00315-3. [DOI] [PubMed] [Google Scholar]
- Robert M, Zatylny-Gaudina C, Fournierd V, Corree E, Corguillée GL, Bernayc B, Henry J. Molecular characterization of peptide fractions of a Tilapia (Oreochromis niloticus) by-product hydrolysate and in vitro evaluation of antibacterial activity. Process Biochem. 2015;50:487–492. doi: 10.1016/j.procbio.2014.12.022. [DOI] [Google Scholar]
- Sai-Ut S, Benjakul S, Sumpavapol P, Kishimura H. Effect of drying methods on odorous compounds and antioxidative activity of gelatin hydrolysate produced by protease from B. amyloliquefaciens H11. Dry Technol. 2014;32:1552–1559. doi: 10.1080/07373937.2014.904338. [DOI] [Google Scholar]
- Sarteshnizi RA, Sahari MA, Gavlighi HA, Regenstein JM, Nikoo M. Antioxidant activity of Sind sardine hydrolysates with pistachio green hull (PGH) extracts. Food Biosc. 2019;27:37–45. doi: 10.1016/j.fbio.2018.11.007. [DOI] [Google Scholar]
- Sila A, Bougatef A. Antioxidant peptides from marine by-products: isolation, identification and application in food systems. A review. J Funct Foods. 2016;21:10–26. doi: 10.1016/j.jff.2015.11.007. [DOI] [Google Scholar]
- Silva JFX, Ribeiro K, Silva JF, Cahú TB, Bezerra RS. Utilization of tilapia processing waste for the production offish protein hydrolysate. Ani Feed Sci Technol. 2014;196:96–106. doi: 10.1016/j.anifeedsci.2014.06.010. [DOI] [Google Scholar]
- Silva TE (2018) The communities 'fishing ethnochinism radicionals from the Ponta do Tubarão state sustainable development reserve (Brazil)—Brazil. State University of Rio Grande do Norte
- Statsoft, Inc (2004) Statistica (data analysis software system), version 7.0. INC, OK, EUA.
- Stookey LL. Ferrozine-a new spectrophotometric reagent for iron. Anal Chem. 1970;42:779–781. doi: 10.1021/ac60289a016. [DOI] [Google Scholar]
- Sukkhown P, Jangchud K, Lorjaroenphon Y, Pirak T. Flavored-functional protein hydrolysates from enzymatic hydrolysis of dried squid by-products: effect of drying method. Food Hydrocoll. 2018;76:103–112. doi: 10.1016/j.foodhyd.2017.01.026. [DOI] [Google Scholar]
- Taheri A, Anvar SA, Ahari H, Fogliano V. Comparison the functional properties of protein hydrolysates from poultry by-products and rainbow trout (Onchorhynchus mykiss) viscera. Iran J Fish Sci. 2013;12:154–169. [Google Scholar]
- Tocher DR. Omega-3 long-chain polyunsaturated fatty acids and aquaculture in perspective. Aquaculture. 2015;449:94–107. doi: 10.1016/j.aquaculture.2015.01.010. [DOI] [Google Scholar]
- Todd RH, Allen DK, Alting L (1994) Manufacturing processes reference guide, Industrial Press Inc., ISBN 0–8311–3049–0. 486p.
- Vannabun A, Ketnawa S, Phongthai S, Benjakul S, Rawdkuen S (2014) Characterization of acid and alkaline proteases from viscera of farmed giant catfish. Food Biosci 6:9–16. 10.1016/j.fbio.2014.01.001
- Villamil O, Váquiro H, Solanilla JF. Fish viscera protein hydrolysates: production, potential applications and functional and bioactive properties. Food Chem. 2017;224:160–171. doi: 10.1016/j.aaspro.2016.02.167. [DOI] [PubMed] [Google Scholar]
- Witono Y, Taruna I, Windrati WS, Azkiyah L, Norma T. ‘Wader’ (rasbora jacobsoni) protein hydrolysates: production, biochemical, and functional properties. Agric Agric Sci Proced. 2016;9:482–492. doi: 10.1016/j.aaspro.2016.02.167. [DOI] [Google Scholar]
- Zhan P, Tian H, Zhang X, Wang L. Contribution to aroma characteristics of mutton process flavor from the enzymatic hydrolysate of sheep bone protein assessed by descriptive sensory analysis and gas chromatography olfactometry. J Chromatogr B. 2013;921–922:1–8. doi: 10.1016/j.jchromb.2012.12.026. [DOI] [PubMed] [Google Scholar]
- Zhang Y, Olsen K, Grossi A, Otte J. Effect of pretreatment on enzymatic hydrolysis of bovine collagen and formation of ACE-inhibitory peptides. Food Chem. 2013;141:2343–2354. doi: 10.1016/j.foodchem.2013.05.058. [DOI] [PubMed] [Google Scholar]