

Abstract
The food industry has a consumer market with growing interest in modified products, so this study aimed to evaluate consumer acceptance and characterize the temporal profile of traditional and lactose-free “low calorie chocolate ice creams”. Six different samples were produced: three formulated with traditional whole milk sweetened with sucrose, sucralose and stevia and three formulated with lactose-free whole milk, also sweetened with the same sweeteners. Time–intensity analysis, temporal dominance of sensation and acceptance analysis were performed. The ice cream with lactose-free milk sweetened with stevia had a lower acceptance. The samples sweetened with sucrose were characterized by intensity, duration and dominance of the “sweet” and “chocolate flavor”, while the samples sweetened with sucralose were characterized by intensity and duration of the “sweet” stimulus and also by the dominance of the “milk flavor” stimulus. The samples sweetened with stevia were characterized by greater intensity and duration of bitter stimulus, being also characterized by intensity of sweet taste and chocolate flavor. It can be verified that the use of stevia promotes relevant difference in lactose-free ice cream when compared to traditional ice cream, increasing the duration and dominance of bitter taste, as well impacting and decreasing the consumer acceptance. However, the addition of sucralose did not promote significant changes in the profile of both formulations.
Keywords: Time–intensity analysis, Temporal domination of sensations, Ice-cream, Lactose-free, Sweeteners
Introduction
Consumer awareness of a healthy diet has led to an increase in consumption of modified foods, including low-calorie foods, especially sugar-substituted products (Dutra and Bolini 2013).
Several studies have evaluated the replacement of sucrose by sweeteners in different food matrices such as ice cream, pitanga nectar, petit suisse cheese and grape nectar (Peres et al. 2018; Freitas et al. 2016; Rocha and Bolini 2015; Dutra and Bolini 2014; Cadena et al. 2013). Sucralose is a synthetic sweetener with high substitution potential due to chemical characteristics, including high solubility in water, good stability at high temperatures and during storage (Viberg and Fredriksson 2011), and sensory profile similar to sucrose with 600 times higher sweetener potential and absence of the bitter aftertaste of most sweeteners (Dutra and Bolini 2013).
However, there is an increase in search for natural sweeteners when compared to synthetic sweeteners. Glycoside steviol is a naturally occurring sweetener extracted from Stevia rebaudiana (Bert.) Bertoni leaves and appears as one of alternatives to synthetic sweeteners, being approximately 200 times sweeter than sucrose (Boileau et al. 2012). However, in addition to sweet taste provided by stevioside present in the stevia extract (Ghanta et al. 2007), the bitter taste and bitter aftertaste stands out which limits the use in large quantities and compromises the acceptance of certain products (Freitas et al. 2016; Cadena et al. 2013).
Dairy products, including ice cream, occupy a large share of world market of modified foods (Özer and Kirmaci 2010), and have been extensively studied, creating a niche market for consumers allergic or intolerant to their components, such as lactose and proteins (Negreiros and Ungier 1995). Lactose intolerance is defined as an inability to completely metabolize lactose through a deficiency of the enzyme lactase, which may have environmental or genetic influence (Liberal and Vasconcellos 2012; Mattar and Mazo 2010).
Sensory studies are extremely important to ensure the sensory quality of new products, especially for specific diets, where there is a lack of studies on the impact of these changes on the profile and acceptance of target audience. Time–intensity (TI) is the measure of the intensity of a single sensory sensation over time in response to a single exposure to a product or other sensory stimulus (ASTM INTERNATIONAL 2011), while temporal dominance of sensation (TDS) (ISO 2017) consists of a descriptive, multidimensional and simultaneous sensory method of continuous evaluation of dominant sensation, which attracts attention of assessor in a given time, and is not necessarily the sensation of greater intensity (Pineau et al. 2009).
The objective of this study was to characterize the temporal profile of low-calorie chocolate ice cream in traditional and lactose-free formulations, and to evaluate the preference of consumers.
Material and methods
Samples
Six chocolate ice cream samples were evaluated: the samples differ in presence of lactose (traditional and lactose-free) and in the type of sweetener (sucrose, sucralose and stevia extract): TSAC (traditional with sucrose), TSUC (traditional with sucralose), TSTE (traditional with stevia), LFSAC (lactose-free with sucrose), LFSUC (lactose-free with sucralose) and LFSTE (lactose-free with stevia). The ingredients used were: whole milk powder (Itambé®, São Paulo, Brazil), lactose-free whole milk powder (Itambé®, São Paulo, Brazil), drinking water, cocoa powder (50% cocoa, Harald®, São Paulo, Brazil), cocoa butter (Barry Callebaut®, São Paulo, Brazil), glucose (Arcolor®, São Paulo, Brazil), stabilizer (Starmix premium, Kerry®, São Paulo, Brazil), vanilla aroma (Duas Rodas®, Santa Catarina, Brazil), chocolate flavor (Duas Rodas®, Santa Catarina, Brazil), sucrose (União®, São Paulo, Brazil), inulin (Orafti® HSI, Beneo Latino Americana Ltda., São Paulo, Brazil), maltodextrin, sucralose (Sweetmix®, São Paulo, Brazil) and stevia extract 97% rebaudioside A (Steviafarma®, Paraná, Brazil) (Medeiros et al. 2019). The concentrations of the ingredients used in the formulations are shown in Table 1.
Table 1.
Ingredients and proportions (%) used to produce six formulations of ice cream chocolate flavor
| Ingredients | Samples | |||||
|---|---|---|---|---|---|---|
| TSAC | TSUC | TSTE | LFSAC | LFSUC | LFSTE | |
| Milk powder | 14.50 | 14.50 | 14.50 | – | – | – |
| Lactose-free milk powder | – | – | – | 14.50 | 14.50 | 14.50 |
| Water | 60.85 | 60.85 | 60.85 | 60.85 | 60.85 | 60.85 |
| Cocoa powder | 7.00 | 7.00 | 7.00 | 7.00 | 7.00 | 7.00 |
| Cocoa butter (fat) | 5.00 | 5.00 | 5.00 | 5.00 | 5.00 | 5.00 |
| Glucose | 3.00 | 3.00 | 3.00 | 3.00 | 3.00 | 3.00 |
| Stabilizer | 0.40 | 0.40 | 0.40 | 0.40 | 0.40 | 0.40 |
| Vanilla aroma | 0.15 | 0.15 | 0.15 | 0.15 | 0.15 | 0.15 |
| Cocoa aroma | 0.10 | 0.10 | 0.10 | 0.10 | 0.10 | 0.10 |
| Sucrose | 9.00 | – | – | 9.00 | – | – |
| Inulin | – | 6.98 | 6.90 | – | 6.98 | 6.90 |
| Maltodextrin | – | 2.00 | 2.00 | – | 2.00 | 2.00 |
| Sucralose | – | 0.016 | – | – | 0.016 | – |
| Stevia | – | – | 0.100 | – | – | 0.100 |
TSAC traditional with sucrose, TSUC traditional with sucralose, TSTE traditional with stevia, LFSAC lactose-free with sucrose, LFSUC lactose-free with sucralose, LFSTE lactose-free with stevia
The ingredients were pre-homogenized and the mixture was pasteurized at 85 °C for 25 min, cooled, and stored at 5 °C for 8 h for the maturation process. After homogenization, freezing (Cuisinart-220 V ICE-21 ice cream maker) and hardening steps, the ice cream was stored at − 18 °C (Peres et al. 2018; Medeiros et al. 2019).
Sensory evaluation
The sensory evaluation was performed at the Laboratory of Sensory Science and Consumer Studies of Unicamp-Brazil (LCSEC / UNICAMP) according to ISO standards 8589: 2007 (ISO 2007). The samples (8 g) were evaluated at ± 4ºC in a monadic sequence, following a balanced completed block design to minimize first order presentation and carry over effect, in 50 mL disposable plastic cups, coded with three digit random numbers (Macfie et al. 1989). Water and salt biscuits (Bauducco®, Minas Gerais, Brazil) were provided to the assessors for cleansing the palate.
Panelists and training
A pre-selection with 30 assessors was performed using Wald sequential analysis (Amerine et al. 1965) with triangular tests, to evaluate sensibility of assessors. The assessors pre-selected were also selected according to their power of discrimination, repeatability and consensus with the group (Damásio and Costell 1991) verified by means of values for Fsample (P < 0.50) and Frepetition (P > 0.05) in relation to each parameter.
To evaluate the temporal profile of ice cream samples, twelve (12) assessors with at least 1 year of experience in descriptive sensory analysis were selected, nine female and three male aged from 20 to 40 years, according to ISO standards 8586: 2012 (ISO 2012).
The assessors were trained for attributes recognition and memorization, software use, and recording of perceived sensations with precision and reliability. Three one-hour sessions were conducted to familiarize panelists with the software of each analysis (ISO 2017; ASTM INTERNATIONAL 2011; Pineau et al. 2009; Shari Zorn et al. 2014).
Time–intensity profile
The temporal profile by time–intensity analysis was determined for the stimuli sweet taste, bitter taste, chocolate flavor, and melting, according to the Standard Guide for time–intensity Evaluation of Sensory Attributes (ASTM INTERNATIONAL 2011).
The intensities references were determined for each attribute: the maximum reference for sweet taste was milk chocolate (Nestle®), semisweet chocolate (Lacta®) for bitter taste and chocolate flavor and purified water was the minimum for all attributes. In the melting was evaluated total time necessary for complete melting of ice cream in mouth.
After training and selection of assessors, the six samples (8 g) were evaluated in three replicates, and the intensity of each attribute in separated was recorded as a function of time, on an structured line scale of ten centimeters (a horizontal scale with 10 vertical lines, indicating the numbers 0 through 10, where 0 = none, 5 = moderate and 10 = strong) (Cadena and Bolini 2011). Assessors analyzed the attribute in function of time using freely sliding the mouse cursor over the scale, indicating the perceived intensity. The test started on the first signal (5 s) when assessors placed the sample in mouth and were registering the intensity of attribute. On the second signal (15 s), the assessors swallowing the sample and continue evaluating. The third signal (60 s) indicated the end of test (Palazzo et al. 2011). For melting also was established as 5 s to start test, while the second sign was in 60 s to total melting and to indicated the end of test. The parameters studied were the maximum intensity of the attribute (Imax), the time to reach the maximum intensity (TImax), the total area under the curve (Atot), and the total duration time of the perception (Ttot) (ASTM INTERNATIONAL 2011). Data collection was performed through time–intensity Analysis of Flavors and Tastes – TIAFT (UNICAMP 2012).
Temporal dominance of sensations
The temporal profile by TDS was determined for the attributes sweet taste, bitter taste, chocolate flavor, milk flavor, cocoa butter flavor, and vanilla flavor, selected by the Kelly's repertory grid technique (Moskowitz 1983), following the guidelines of ISO 13299: 2017 (ISO 2017) and including the expression “I feel nothing” to allow the assessors to indicate the moment with no more dominant stimulus (Rodrigues et al. 2016; Esmerino et al. 2017).
A dominant attribute is understood as one that draws the assessors' attention for a certain time and is not related to the stimuli intensity (ISO 2017). After training (sensory recognition and memorization of sensory characteristics, as well to practice to the software), six samples (8 g) were evaluated in three replicates, and the dominant attributes were selected by the assessors. The presentation of the attributes to the assessors was balanced, in two columns, and maintained between the repetitions. The time to evaluate the dominant attributes was 60 s after ingestion, following the same standards used in the time–intensity analysis. Data collection was performed through the software FIZZ Network Sensory software (version 2.47b).
Acceptance test
The overall impression of the samples was evaluated by 120 consumers (Hough et al. 2005), male and female, aged from 18 to 60 years, representative of the target public (Stone and Sidel 2004), using an unstructured linear hedonic scale of nine centimeters, anchored in the extreme by the terms “disliked very much” on the left, and “liked very much” on the right (Stone et al. 2012). The results were analyzed through the software FIZZ Network Sensory (version 2.47b—Biosystemes, Couternon, France).
Statistical analysis
The averages of the TI analysis and the acceptance test were analyzed by analysis of variance (ANOVA) and Tukey's test (P ≤ 0.05). The time–intensity curves were constructed using the means of the parameters as a function of time, for each sample in relation to each attribute. An internal preference map was also performed for better visualization of the acceptance results. Data were analyzed with the aid of the program XLSTAT for Windows version 2012.5 (Addinsoft, Paris, France).
The TDS curves of each sample were constructed using the software FIZZ Network Sensory (version 2.47b—Biosystemes, Couternon, France) according to ISO 13299:2017 (ISO 2017). Each attribute was evaluated separately, and the dominance rate (proportion in which the analyzed attribute was chosen as dominant) was calculated as a function of time (NA/NA Maximum) (NA = number of evaluations that the attribute was dominate/NA Maximum = total of assessors x total of repetitions).
These proportions were smoothed (non-iterative smoothing spline) and plotted as a function of time, for each sample. To improve the visualization of the results, two lines were drawn: “chance level” and “significance level”. The “chance level” is the dominance rate of an attribute for being chosen at random (P0 = 1/p; p = number of attributes) and the “significance level” is the minimum value the dominance rate should have to be considered as significant, and is calculated using the binomial distribution (ISO 2017).
Results and discussion
Time–intensity profile (TI)
Table 2 present the results obtained through ANOVA and Tukey’s test for each parameter evaluated in relation to the stimuli sweet taste, bitter taste, chocolate flavor and melting. The mean of the parameters were used to construct the time–intensity curves for each sample, graphically illustrated in the Fig. 1.
Table 2.
ANOVA and Tukey’s test of time-intensity for sweet, bitter, chocolate flavor and melting of six ice cream chocolate flavor samples
| Attributes | TSAC | TSUC | TSTE | LFSAC | LFSUC | LFSTE |
|---|---|---|---|---|---|---|
| Sweet | ||||||
| Timax | 15.63a | 15.98a | 16.23a | 14.66a | 15.60a | 14.44a |
| Imax | 6.60b | 6.86ab | 8.28a | 7.03ab | 7.08ab | 8.05a |
| Ttot | 30.12a | 32.05a | 36.94a | 29.97a | 32.97a | 36.28a |
| Area | 107.12b | 114.25b | 166.67a | 109.20b | 125.99ab | 152.78ab |
| Bitter | ||||||
| Timax | 16.34a | 16.87a | 16.59a | 16.36a | 16.02a | 17.74a |
| Imax | 5.37b | 4.90b | 7.60a | 5.48b | 4.80b | 7.60a |
| Ttot | 25.71b | 25.48b | 32.82ab | 26.39ab | 25.48b | 34.72a |
| Area | 93.67b | 74.73b | 147.81a | 86.66b | 72.01b | 152.59a |
| Chocolate flavor | ||||||
| Timax | 16.73a | 14.44a | 16.09a | 14.66a | 14.82a | 14.69a |
| Imax | 6.61ab | 6.00ab | 7.42a | 6.53ab | 5.59b | 6.90ab |
| Ttot | 31.85a | 27.33a | 31.95a | 30.63a | 26.59a | 30.14a |
| Area | 127.54a | 101.85a | 141.85a | 124.17a | 93.95a | 130.73a |
| Melting | ||||||
| Ttot | 17.46ab | 20.47ab | 22.23a | 16.10b | 21.47ab | 21.04ab |
| Area | 67.49a | 89.84a | 92.98a | 75.52a | 86.88a | 80.19a |
TSAC traditional with sucrose, TSUC traditional with sucralose, TSTE traditional with stevia, LFSAC lactose-free with sucrose, LFSUC lactose-free with sucralose, LFSTE lactose-free with stevia
*Means in a same line followed by different letters are significantly different (P > 0.05), with a representing the higher value
Fig. 1.

Time–intensity curves for sweet, bitter, chocolate flavor and melting of six ice cream chocolate flavor samples: TSAC traditional with sucrose, TSUC traditional with sucralose, TSTE traditional with stevia, LFSAC lactose-free with sucrose, LFSUC lactose-free with sucralose, LFSTE lactose-free with stevia
Sweet stimulus
No significant differences (P ≤ 0.05) were observed among the samples for the stimulus sweet taste (Table 2), for time to reach the maximum intensity (Timax) and the total duration of the stimulus (Ttot). However, with regard to the maximum intensity (Imax), the traditional sample sweetened with sucrose (TSAC), presented the lowest mean when compared to the stevia-sweetened samples (TSTE and LFSTE). This effect was also evidenced in other studies, with the use of sucralose and stevia in low-calorie vanilla ice cream, espresso and chocolate bar, which also showed lower Imax for the products sweetened exclusively with sucrose, when compared to those sweetened with stevia and sucralose (Cadena and Bolini 2011; Palazzo et al. 2011; Azevedo et al. 2015). Concerning the parameter area under the curve (Area), the sample TSTE presented a higher score, differing significantly (P > 0.05) from the samples sweetened with sucrose (TSAC and LFSAC) and the traditional sample sweetened with sucralose (TSUC) (Fig. 1).
Bitter stimulus
No significant differences (P ≤ 0.05) were observed among the samples for the parameter time to reach the maximum intensity (Timax) of the bitter stimulus (Table 2). However for the parameters Imax and Area, the stevia-sweetened samples (TSTE and LFSTE) presented the highest scores, differing from the other samples. In relation to the total duration time of the stimulus (Ttot), the stevia-sweetened samples (TSTE and LFSTE) did not differ significantly (P ≤ 0.05) from each other, and the lactose-free samples (LFSTE) exhibited a longer duration time of the stimulus when compared to the samples TSAC, LFSAC LFSUC (Fig. 1).
Chocolate flavor stimulus
For the chocolate flavor stimulus (Table 2) no significant difference (P ≤ 0.05) was found for the parameters Timax, Ttot, and Area. However, for the maximum intensity (Imax), the lactose-free sample sweetened with sucralose (LFSUC) differed from the traditional sample sweetened with stevia (TSTE), which obtained the highest score (Fig. 1). Some authors investigated the sensory profile of chocolate ice cream and chocolate bar using Quantitative Descriptive Analysis, and found no significant effect of stevia on the attributes cocoa flavor and chocolate flavor (Peres et al. 2018).
Melting
Concerning the melting time (Table 2), there was no difference for the area under the curve (Area). In relation to the total duration time (Ttot), the sucrose-sweetened samples exhibited the lowest scores, corresponding to the higher melting rate; however only the sample LFSAC differed (P > 0.05) from the sample TSTE with the higher score (Fig. 1).
The results of time–intensity analysis allowed characterizing the samples according to the stimulus intensity and the perception of duration. Thus, the sucrose-sweetened samples (TSAC and LFSAC) were characterized by the intensity and duration of the stimuli sweet taste and chocolate flavor, while the sucralose-sweetened samples (TSUC and LFSUC) were characterized by the intensity and duration of the sweet stimulus. All samples showed bitter aftertaste, probably due to the bitter taste from cocoa used in the formulation (Ley 2008), and the stevia-sweetened samples (TSTE and LFSTE) presented the greater intensity and duration of the bitter stimulus, and were also characterized by the intensity of sweet taste and chocolate flavor. The bitterness of stevia-sweetened samples was expected, due to the bitter taste and aftertaste reported in studies on ice cream (Peres et al. 2018) and other stevia-sweetened products (Freitas et al. 2016; Cadena et al. 2013).
The steviol glycosides present in stevia, in addition to taste sweet, produce secondarily undesirable tastes such as bitter and metallic aftertaste (Dutra and Bolini 2014), thus studies on refining and isolating rebaudiosides with a high degree of purity have been developed, including the Rebaudioside A, B, C, and D. However, although they have a lower intensity of bitter taste in relation to the extract, they still stimulate specific bitter receptors, as in other sweeteners such as aspartame. Other researchers have also pointed out the correlation of Rebaudioside A with bitter taste (Freitas et al. 2016).
Multiple time–intensity analysis (multiple TI)
The time–intensity results of the flavor attributes of each sample were analyzed simultaneously (Fig. 2), providing a better visualization of the results in relation to the duration time of the stimuli for each sample.
Fig. 2.

Multiple time–intensity for the six ice cream chocolate flavor samples: TSAC traditional with sucrose, TSUC traditional with sucralose, TSTE traditional with stevia, LFSAC lactose-free with sucrose, LFSUC lactose-free with sucralose, LFSTE lactose-free with stevia
The perceived duration of sweet taste sensation was higher in the samples sweetened with sucralose (TSUC and LFSUC) and stevia (TSTE and LFSTE) when compared to the other stimuli studied. The samples TSUC and LFSUC presented shorter duration of bitter taste (P > 0.05), while the stevia-sweetened samples showed shorter duration of chocolate flavor (P > 0.05). On the other hand, the sucrose-sweetened samples (TSAC and LFSAC) showed longer perceived duration of chocolate flavor and shorter duration of bitter taste (P > 0.05).
The results of the multiple time–intensity analysis (Fig. 2) showed that even without significant difference in relation to the total time (Ttot) of each stimulus, the samples can present differences in behavior and duration of perception, impacting the final residual flavor of the sample in the mouth. Although no significant differences were observed between the samples sweetened with sucrose and sucralose in relation to the total duration time of the stimuli sweet taste and chocolate flavor, a longer total duration time was observed for the stimulus chocolate flavor in the sucrose-sweetened samples, while the sucralose-sweetened samples presented a longer duration time for the sweet stimulus.
Temporal dominance of sensations (TDS)
The TDS (smoothing spline) curves, shown in Fig. 3, present the dominance rate (%) as a function of the time (s) for the stimuli sweet taste, bitter taste, chocolate flavor, milk flavor, cocoa butter flavor, and vanilla flavor within 70-s assessment. The chance level (0.17) and the significance level (0.27) were included in the graph for better interpretation of the results.
Fig. 3.

TDS curves for the six ice cream chocolate flavor samples: TSAC traditional with sucrose, TSUC traditional with sucralose, TSTE traditional with stevia, LFSAC lactose-free with sucrose, LFSUC lactose-free with sucralose, LFSTE lactose-free with stevia
The attribute chocolate flavor was the significantly dominant (5%) in the samples TSAC and LFSAC, followed by sweet taste. Sweet taste exhibited a lower dominance rate between 15 and 25 s and between 30 and 35 s for both samples, and the chocolate flavor was considered as dominant. These results are convergent to those found in the multiple time–intensity analysis.
For the TSUC and LFSUC samples, although the sweet taste and chocolate flavor, the milk flavor also showed significant dominance after 25 s of evaluation until the end of perception.
In relation to the samples TSTE and LFSTE, the attribute bitter taste also stood out, indicating dominance over the evaluation time and gaining prominence, with a high dominance rate after 30 s of evaluation, presenting a longer duration in the sample LFSTE. The stevia-sweetened samples were also characterized by the chocolate flavor, with a high dominance rate between 25 and 30 s of evaluation.
These results of TDS corroborate the findings of time–intensity Analysis. Another factor that can explain the relationship between stevia and bitter taste and chocolate flavor is the congruent flavor effect, in which a given attribute enhances the perceived intensity of another attribute, thus acting synergistically (Ley 2008).
As reported by Pineau et al. (2009), the use of TI analysis is best suited to assess the depth of a specific attribute over time, while TDS is more appropriate to evaluate several attributes at the same time and their interactions. Comparisons between the curves can present similar aspects for some products, and very different for others (Pineau et al. 2009). In this study, both techniques showed similar results, thus confirming the results and complementing the study about the temporal profile of the samples.
Acceptance test
According to the internal preference map (Fig. 4), the principal components 1 and 2 explained 50.57% of the variance among the samples due to the consumers' preference for more than one sample. The ANOVA and Tukey's test showed that the three traditional chocolate ice cream samples (TSAC, TSUC, and TSTE) and the lactose-free samples sweetened with sucrose and sucralose (LSAC and LFSUC) were equally (P ≤ 0.05) well accepted (6.30a–6.67a). On the other hand, the stevia-sweetened lactose-free samples (LFSTE) obtained lower acceptance scores (5.68b), with a significant difference when compared to the other samples (P > 0.05), being located far from most consumers (represented by red dots) and samples (represented by blue dots) on the internal preference map. Although the sample TSTE was distant in the Internal preference mapping (Fig. 4), it showed no significantly difference in consumers' acceptance when compared to the samples sweetened with sucrose (TSAC and LFSAC) and sucralose (TSUC and LFSUC).
Fig. 4.
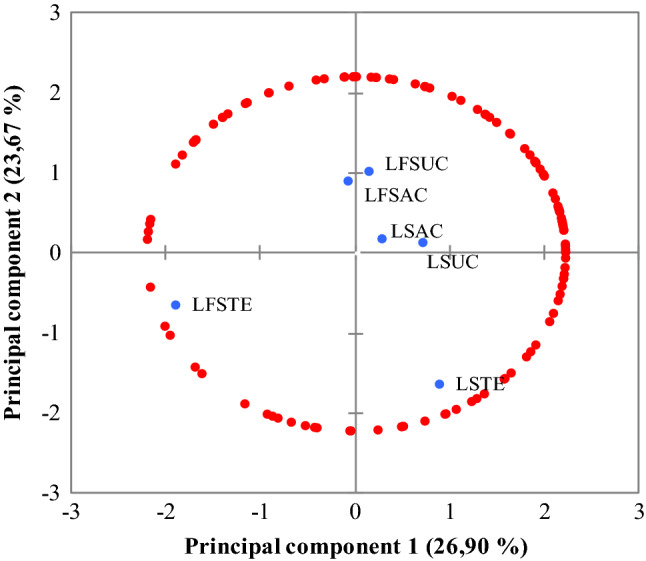
Internal preference mapping for the six ice cream chocolate flavor samples: TSAC traditional with sucrose, TSUC traditional with sucralose, TSTE traditional with stevia, LFSAC lactose-free with sucrose, LFSUC lactose-free with sucralose, LFSTE lactose-free with stevia (PC1 × PC2 50.57%)
The lower acceptance of the sample LFSTE may be due to the longer duration of perception and dominance of the bitter aftertaste, observed in time–intensity analyses (Table 2) (Fig. 1) and TDS (Fig. 3) Other authors have also substituted stevia for sucrose in chocolate ice cream and chocolate bar, and found lower acceptance scores (Peres et al. 2018). The differences in intensity, duration, and dominance of the other stimuli evaluated did not affect the acceptance of the other samples.
Conclusion
The results of this study demonstrated no significant differences (P > 0.05) in the dynamic sensory profile and the consumers' acceptance regarding the use of lactose-milk and lactose-free milk in chocolate ice cream sweetened with sucrose and sucralose. On the other hand, when the lactose-free ice cream is sweetened with stevia, the increase in total duration time and dominance of bitter taste may alter the sensory profile of the product and impact on the consumers' acceptance.
Sucralose in chocolate ice cream presented a similar sweeteness profile to sucrose due to its lower intensity and lack of dominance of the bitter aftertaste when compared to stevia. In turn, despite increasing the intensity and duration time of bitter taste, stevia also affected the increase in the intensity of the chocolate flavor in the traditional ice cream, without impacting on the consumers' acceptance.
The TI and TDS methodologies were correlated, and complemented the understanding of the temporal profile of both the traditional dairy-based and lactose-free ice cream samples. The results of the multiple time–intensity analysis allowed an individual evaluation of each sample, providing better visualization and comparison of the TDS results.
Acknowledgments
The authors would like to thank the coordination for the im-provement of higher education personnel (CAPES) for the support for the present study.
Compliance with ethical standards
Conflict of interest
The authors declare that they have no conflict of interest.
Footnotes
Publisher's Note
Springer Nature remains neutral with regard to jurisdictional claims in published maps and institutional affiliations.
References
- Akalin AS, Karagozlu C, Ünal G. Rheological properties of reduced-fat and low-fat ice cream containing whey protein isolate and inulin. Eur Food Res Technol. 2008;227(3):889–895. doi: 10.1007/s00217-007-0800-z. [DOI] [Google Scholar]
- Amerine MA, Pangborn RM, Roessler EB. Principles of sensory evaluation of food. New York: Academic Press; 1965. [Google Scholar]
- ASTM E1909-11 . Standard guide for time-intensity evaluation of sensory attributes. West Conshohocken: ASTM Int; 2011. [Google Scholar]
- Azevedo BM, Schmidt FL, Bolini HMA. High-intensity sweeteners in espresso coffee: ideal and equivalent sweetness and time–intensity analysis. Int J Food Sci Technol. 2015;50(6):1374–1381. doi: 10.1111/ijfs.12774. [DOI] [Google Scholar]
- Boileau A, Fry JC, Murray R. A new calorie-free sugar substitute from the leaf of the stevia plant arrives in the UK. Nutr Bull. 2012;37(1):47–50. doi: 10.1111/j.1467-3010.2011.01945.x. [DOI] [Google Scholar]
- Cadena RS, Bolini HMA. Time–intensity analysis and acceptance test for traditional and light vanilla ice cream. Food Res Int. 2011;44(3):677–683. doi: 10.1016/j.foodres.2010.12.012. [DOI] [Google Scholar]
- Cadena RS, Cruz AG, Netto RR, Castro WF, Faria JAF, Bolini HMA. Sensory profile and physicochemical characteristics of mango nectar sweetened with high intensity sweeteners throughout storage time. Food Res Int. 2013;54(2):1670–1679. doi: 10.1016/j.foodres.2013.10.012. [DOI] [Google Scholar]
- Damásio MH, Costell E. Análisis sensorial descriptivo: generación de descriptores y selección de catadores. Agroquím Tecnol Aliment. 1991;31(2):165–178. [Google Scholar]
- Dutra MBL, Bolini HMA. Sensory and physicochemical evaluation of acerola nectar sweetened with sucrose and different sweeteners. Food Sci Technol. 2013;33(4):612–618. doi: 10.1590/S0101-20612013000400003. [DOI] [Google Scholar]
- Dutra MBL and Bolini HMA Acerola nectar sweetened with different sweeteners: ideal and equivalent sweetness. CyTA J Food. 2014;12(3):277–281. doi: 10.1080/19476337.2013.847866. [DOI] [Google Scholar]
- Esmerino EA, Castura JC, Ferraz JP, Tavares Filho ER, Silva R, Cruz AG, Bolini HMA. Dynamic profiling of different ready-to-drink fermented dairy products: a comparative study using Temporal Check-All-That-Apply (TCATA) Temporal Dominance of Sensations (TDS) and Progressive Profile (PP) Food Res Int. 2017;101:249–258. doi: 10.1016/j.foodres.2017.09.012. [DOI] [PubMed] [Google Scholar]
- Liberal EF, Vasconcellos MM. Gastroenterologia – Série Pediatria. 1. Rio de Janeiro: Guanabara Koogan; 2012. [Google Scholar]
- Freitas MLF, Dutra MBDL, Bolini HMA. Sensory profile and acceptability for pitanga (Eugenia uniflora L.) nectar with different sweeteners. Food Sci Technol Int. 2016;22(8):720–731. doi: 10.1177/1082013215607077. [DOI] [PubMed] [Google Scholar]
- Ghanta S, Banerjee A, Poddar A, Chattopadhyay S. Oxidative DNA damage preventive activity and antioxidant potential of Stevia rebaudiana (Bertoni) Bertoni a Natural Sweetener. J Agric Food Chem. 2007;55(26):10962–10967. doi: 10.1021/jf071892q. [DOI] [PubMed] [Google Scholar]
- Grotz VL, Munro IC. An overview of the safety of sucralose. Regul Toxic Pharm. 2009;55(1):1–5. doi: 10.1016/j.yrtph.2009.05.011. [DOI] [PubMed] [Google Scholar]
- Hough G, Wakeling I, Mucci A, Chambers E, Gallardo IM, Alves LR. Number of consumers necessary for sensory acceptability tests. Food Qual Pref. 2005;17(6):522–526. doi: 10.1016/j.foodqual.2005.07.002. [DOI] [Google Scholar]
- ISO . Sensory analysis: general guidance for the design of test rooms ISO standard 8589. Geneva: International Organization for Standardization; 2007. [Google Scholar]
- ISO . Sensory analysis—general guidelines for the selection training and monitoring of selected assessors and expert sensory assessors ISO standard 8586–1:2012. Geneva: International Organization for Standardization; 2012. [Google Scholar]
- ISO . Sensory analysis—methodology—general guidance for establishing a sensory profile ISO standard 13299:2017. Geneva: International Organization for Standardization; 2017. [Google Scholar]
- Ley JP. Masking bitter taste by molecules. Chemosens Percept. 2008;1:58–77. doi: 10.1007/s12078-008-9008-2. [DOI] [Google Scholar]
- Macfie HJ, Bratchell N, Greenhoff K, Vallis LV. Designs to balance the effect of order of presentation and first-order carry-over effects in hall tests. J Sensory Stud. 1989;4(2):129–148. doi: 10.1111/j.1745-459X.1989.tb00463.x. [DOI] [Google Scholar]
- Marshall RT, Goff HD, Hartel RW (2003). Composition and properties. In: Ice cream, pp 11–54. 10.1007/978-1-4615-0163-3_2
- Mattar R, Mazo DFC. Intolerância à lactose: mudança de paradigmas com a biologia molecular. Revista Da Associação Médica Brasileira. 2010;56(2):230–236. doi: 10.1590/S0104-42302010000200025. [DOI] [PubMed] [Google Scholar]
- Medeiros AC, Tavares Filho ER, Bolini HMA. Impact of natural and artificial sweeteners compounds in the sensory profile and preference drivers applied to traditional, lactose-free, and vegan frozen desserts of chocolate flavor. J Food Sci. 2019;84(10):2973–2982. doi: 10.1111/1750-3841.14806. [DOI] [PubMed] [Google Scholar]
- Moskowitz HR. Product testing and sensory evaluation of foods. Westport: Food and Nutrition Press; 1983. p. 605. [Google Scholar]
- Negreiros B, Unglier C. Alergologia clínica. São Paulo: Atheneu; 1995. p. 476. [Google Scholar]
- Özer BH, Kirmaci HA. Functional milks and dairy beverages. Int J Dairy Technol. 2010;63(1):1–15. doi: 10.1111/j.1471-0307.2009.00547.x. [DOI] [Google Scholar]
- Palazzo AB, Bolini HMA. Multiple time-intensity analysis and acceptance of raspberry-flavored gelatin. J Sensory Stud. 2009;24(5):648–663. doi: 10.1111/j.1745-459X.2009.00231.x. [DOI] [Google Scholar]
- Palazzo B, et al. The determination of isosweetness concentrations of sucralose rebaudioside and neotame as sucrose substitutes in new diet chocolate formulations using the time-intensity analysis. J Sensory Stud. 2011;26(4):291–297. doi: 10.1111/j.1745-459X.2011.00344.x. [DOI] [Google Scholar]
- Peres J, Esmerino E, da Silva AL, Racowski I, Bolini HMA. Sensory profile drivers of liking and influence of information on the acceptance of low-calorie synbiotic and probiotic chocolate ice cream. J Food Sci. 2018;83(5):1350–1359. doi: 10.1111/1750-3841.14120. [DOI] [PubMed] [Google Scholar]
- Pineau N, Schlich P, Cordelle S, Mathonnière C, Issanchou S, Imbert A, Köster E. Temporal dominance of sensations: construction of the TDS curves and comparison with time-intensity. Food Qual Pref. 2009;20:450–455. doi: 10.1016/j.foodqual.2009.04.005. [DOI] [Google Scholar]
- Rocha IFO, Bolini HMA. Passion fruit juice with different sweeteners: sensory profile by descriptive analysis and acceptance. Food Sci Nutr. 2015;3(2):129–139. doi: 10.1002/fsn3.195. [DOI] [PMC free article] [PubMed] [Google Scholar]
- Rodrigues JF, Rios De Souza V, Lima RR, De Deus J, Carneiro S, Nunes A, Pinheiro M. Temporal dominance of sensations (TDS) panel behavior: a preliminary study with chocolate. Food Qual Pref. 2016;54:51–57. doi: 10.1016/j.foodqual.2016.07.002. [DOI] [Google Scholar]
- Stone H, Sidel JL. Sensory eval practices. New York: Elsevier Academic Press; 2004. [Google Scholar]
- Stone H, Bleibaum RN, Thomas HA. Sensory evaluation practices. 4. New York: Academic Press; 2012. [Google Scholar]
- Univerdade Estadual de Campinas - UNICAMP (2012) Helena maria andre bolini. Time-intensity analysis of flavors and tates- TIAFT: software. Registro nº 12445-5 03 jan. 2012 27 mar. 2012. Rev Prop Ind p 178. Rio de Janeiro
- Viberg H, Fredriksson A. Basic Nutral investigation Neonatal exposure to sucralose does not alter biochemical markers of neuronal development or adult behavior. Nutr. 2011;27:81–85. doi: 10.1016/j.nut.2009.10.007. [DOI] [PubMed] [Google Scholar]
- Zorn S, Alcaire F, Vidal L, Giménez A, Ares G. Application of multiple-sip temporal dominance of sensations to the evaluation of sweeteners. Food Qual Pref. 2014;36:135–143. doi: 10.1016/j.foodqual.2014.04.003. [DOI] [Google Scholar]