

Abstract
Patients infected with SARS‐CoV‐2 and influenza display similar symptoms, but treatment requirements are different. Clinicians need to accurately distinguish SARS‐CoV‐2 from influenza to provide appropriate treatment. Here, the authors develope a color‐based technique to differentiate between patients infected with SARS‐CoV‐2 and influenza A using a nucleic acid enzyme‐gold nanoparticle (GNP) molecular test requiring minimal equipment. The MNAzyme and GNP probes are designed to be robust to viral mutations. Conserved regions of the viral genomes are targeted, and two MNAzymes are created for each virus. The ability of the system to distinguish between SARS‐CoV‐2 and influenza A using 79 patient samples is tested. When detecting SARS‐CoV‐2 positive patients, the clinical sensitivity is 90%, and the specificity is 100%. When detecting influenza A, the clinical sensitivity and specificity are 93% and 100%, respectively. The high clinical performance of the MNAzyme‐GNP assay shows that it can be used to help clinicians choose effective treatments.
Keywords: colorimetric; diagnostics; DNAzymes; gold nanoparticles, influenza A; respiratory infections, SARS‐CoV‐2
Molecular diagnostic tests are needed to differentiate patients infected with COVID‐19 and influenza to guide treatment decisions. A colorimetric test using nucleic acid enzymes and gold nanoparticles is developed to identify these respiratory pathogens. The test has 93–95% sensitivity and 100% specificity in patients. The results support rapid translation of this materials‐based diagnostic approach for use in human patients.
1. Introduction
There is a need to develop simple molecular diagnostic tests to differentiate COVID‐19 from influenza. COVID‐19 and influenza patients can display similar symptoms, including dry cough, fever, fatigue, headache, and body ache.[ 1, 2, 3 ] These two diseases are treated differently. Corticosteroids have been shown to benefit severe cases of COVID‐19, but influenza patients given corticosteroids are at increased risk of death.[ 4, 5 ] The treatments for these diseases are not interchangeable. Treating a patient with the wrong medications can cost them their lives. Moreover, patients who test positive for COVID‐19 are recommended to self‐isolate for 14 days and seek medical help if symptoms worsen.[ 6 ] Patients that are incorrectly assumed to have influenza will not self‐isolate and can infect members of their household or community. The ability to accurately distinguish COVID‐19 from influenza will prevent treatment‐associated complications and reduce the risk of disease transmission leading to improved patient outcomes.
Molecular diagnostic tests can differentiate between these two viral infections. Real‐time polymerase chain reaction (qPCR) is the gold standard method for detection. However, qPCR requires specialized readout equipment due to the fluorescent labeling of viral nucleic acid targets. This equipment must have a light source, lenses, and software that processes and interprets results. qPCR tests also require diagnosing state‐of‐the art laboratories operated by skilled technicians and have long turnaround times. Other molecular tests for diagnosing active infections include antigen tests, which detect virus‐specific proteins. Antigen tests for SARS‐CoV‐2 have detected the spike, envelope, and membrane proteins.[ 7 ] These tests have poorer limits of detection when compared with qPCR and require special equipment to interpret results. Here, we designed a colorimetric nucleic acid enzyme‐gold nanoparticle (GNP) molecular test to accurately differentiate between patients infected with influenza A and COVID‐19 using minimal equipment.
The MNAzyme‐GNP system uses DNA enzymes and GNPs to identify nucleic acid targets (Figure 1 ).[ 8 ] In the first step, a nasopharyngeal swab is obtained from the patient. Viral RNA is extracted, reverse transcribed, and amplified using isothermal methods. Recombinase polymerase amplification (RPA) is an isothermal amplification method used to minimize the need for equipment and simplify the testing workflow. The amplified sample is chemically denatured and incubated with the MNAzyme and GNP probes. The final color of the solution indicates whether a patient is positive or negative for disease.
Figure 1.
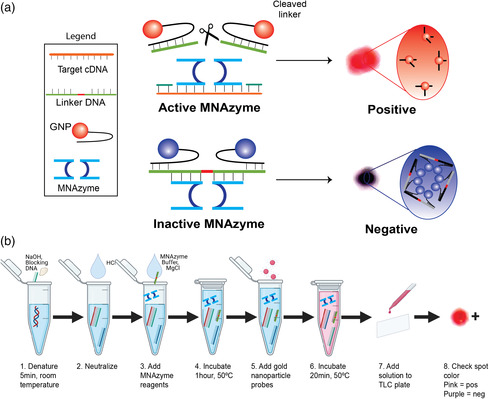
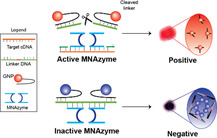
a) Mechanism for detection using the MNAzyme‐GNP system. b) Operational workflow for using the MNAzyme‐GNP system. Following isothermal reverse transcription and amplification, the target cDNA is incubated with the MNAzyme, linker DNA, and GNP probes. In the presence of target, the MNAzyme is activated to cleave the linker. Positive samples appear pink. In the absence of target, the MNAzyme is inactive, and the solution appears purple. The color can be determined by eye.
MNAzymes are catalytic nucleic acid enzymes composed of two single stranded DNA sequences. The two halves of the MNAzyme are separated and do not have cleaving activity in the absence of a genomic target.[ 9 ] The genomic target acts as a scaffold for the MNAzyme (Figure S1, Supporting Information). It binds both MNAzyme halves to assemble and activate the MNAzyme. GNPs connected by a DNA linker are also present in the MNAzyme solution. The assembled MNAzymes cleave the linker strand at the location of the uracil. This frees the GNPs and changes the color of the solution from purple to pink (Figure 1a, top). In the absence of target, the solution appears purple, as the MNAzyme is unassembled, and the two GNPs are kept in close proximity via the DNA linker (Figure 1a, bottom). The simple colorimetric readout of the MNAzyme‐GNP assay can be seen with the naked eye. No specialized equipment is necessary, making it easy to identify whether a patient has COVID‐19, influenza, or neither. The key developments lay with the design of the probes, which enabled the differentiation of influenza A and SARS‐CoV‐2, and the optimization of the assay conditions for the detection of clinical samples.
2. Results and Discussions
We analyzed the genomes of influenza A H3N2 and SARS‐CoV‐2 to create a MNAzyme‐GNP test for influenza A and COVID‐19. RNA viruses have high mutation rates that can lead to changes in the viral genome that prevent detection and reduce the clinical sensitivity of diagnostic tests.[ 10, 11, 12 ] The inability to detect viral sources of infection can prevent patients from receiving appropriate treatment. To overcome this pervasive challenge, we used two strategies to obtain high clinical sensitivity. The viral sequences used in this analysis were obtained from NCBI Nucleotide and the Global Initiative for Sharing All Influenza Data (GISAID). Genomes were aligned with the help of Geneious (Geneious 11.1.8). First, we designed MNAzymes for two separate regions of the SARS‐CoV‐2 genome, the E gene, and the ORF1b. These regions are conserved within SARS‐CoV‐2 but not in common cold coronaviruses or other respiratory viruses. While a number of regions have been used to detect SARS‐CoV‐2, we chose regions that could be amplified by primers with high analytical sensitivity, few positional mismatches, and/or were previously validated using clinical specimens.[ 13, 14, 15 ] Furthermore, large‐scale analyses of more than 275 000 SARS‐CoV‐2 sequences in GISAID (updated January 29, 2021) have shown that primers for the E and ORF1ab have the fewest mutations from all genome regions.[ 15 ] This scale of analysis is rare and has enabled our design of high sensitivity SARS‐CoV‐2 probes. Second, we designed a degenerate MNAzyme to detect influenza H3N2, a strain of influenza A that accounted for the majority of influenza infections in 2020.[ 16 ] We identified a highly conserved region of the matrix gene that is present in human influenza A but not other human respiratory viruses. Choosing a unique target region prevents false positive test results and increases the certainty of diagnosis. When a consensus nucleotide could not be identified, a degenerate nucleotide was incorporated at that position. Numerous probes for each viral target were designed and screened for analytical sensitivity. All sequences for detecting viral targets can be found in Table S1, Supporting Information. The strategies leveraged for MNAzyme design enabled the development of an MNAzyme‐GNP assay that can bind and detect target in the presence of viral mutations.
We characterized the cross reactivity and limit of detection of the MNAzyme‐GNP assay using synthetic DNA without amplification. The workflow is described in Figure 1b. Chemical denaturation of DNA completed within 5 min at room temperature. It required only blocking strands complementary to the target and NaOH. The denatured DNA was mixed with target‐specific MNAzyme, MNAzyme buffer, linker strand, MgCl2, and water. The solution was incubated at 50 °C for 1 h before GNP probes were added. The final MNAzyme‐GNP solution was incubated at 50 °C for 20 min to allow GNP aggregation. To best visualize the resulting color, 3 μL of solution was spotted on a thin layer chromatography (TLC) plate. Cross‐reactivity tests between the influenza A and the SARS‐CoV‐2 MNAzyme‐GNP probes were completed using gene specific targets. No cross reactivity was seen between probes and targets for different genes (Figure S2, Supporting Information). In limit of detection studies using the MNAzyme‐GNP assay without amplification, reactions with 1–1010 copies of DNA appeared purple, indicating a negative result. The limit of detection using the naked eye was 1011 DNA copies. These results were validated using UV–Vis spectrophotometry. A shift in the absorbance peak to 523 nm indicated a positive result (the presence of the target sequence in solution). The limit of detection of the MNAzyme‐GNP assay alone was 1011 copies of DNA using both UV–Vis spectrophotometry and colorimetric readout (Figure 2c). This limit of detection would not be sufficient to identify patients infected with SARS‐CoV‐2.[ 17 ]
Figure 2.
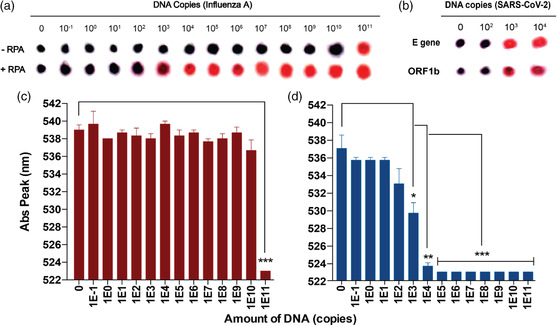
Analytical sensitivity for detecting RNA viruses with and without amplification. Varying amounts of DNA were amplified via RPA and detected with the MNAzyme‐GNP assay. Spot images represent colorimetric readout for a) influenza A or b) SARS‐CoV‐2 DNA on a TLC plate after adjusting for brightness and contrast on ImageJ. All SARS‐CoV‐2 samples were amplified using RPA. DNA copies refer to the amount of DNA per reaction. The bottom bar graphs represent the wavelength of the absorbance peak of the MNAzyme‐GNP solution when detecting influenza A DNA c) without RPA or d) with RPA. Error bars represent standard error of the mean from experimental triplicates. All statistics were calculated on excel using a two‐tailed unpaired T‐test assuming two‐sample equal variance (*p < 0.05, **p < 0.01, and ***p < 0.001). RPA: recombinase polymerase amplification.
We improved the limit of detection by adding an isothermal amplification step. Synthetic viral targets were amplified using RPA. RPA is a form of isothermal amplification that requires no specialized equipment. This rapid amplification requires only one mixing step and one incubation at 37–42 °C. In brief, forward primer and reverse primers, RPA rehydration buffer, and magnesium acetate were mixed with water to a total volume of 48 μL. The solution was added to the RPA pellet with 2 μL of water or serially diluted DNA. The solution was incubated for 30 min at 37–39 °C. The amplified product was purified for use in the MNAzyme‐GNP assay. By adding the isothermal amplification step, the limit of detection improved from 1011 copies of DNA/reaction to 103 copies of DNA/reaction (Figure 2a). A limit of detection of 103 copies of DNA/reaction was also seen when detecting SARS‐CoV‐2 after RPA (Figure 2b). This improvement could be seen by the naked eye and using the UV–Vis spectrophotometer. The increase in sensitivity would allow the MNAzyme‐GNP assay to detect SARS‐CoV‐2 in infected patients.[ 17 ]
We next evaluated the clinical performance of the MNAzyme‐GNP system in a broad patient population. We chose a patient population with a spectrum of respiratory viral infections, including SARS‐CoV‐2, other human coronaviruses, influenza virus, enterovirus, human metapneumovirus, parainfluenza virus, and respiratory syncytial virus. Many patients infected with these viruses present with similar upper respiratory tract symptoms. To differentiate between these infections, clinicians order diagnostic tests. Patients may also be infected with varying amounts of virus. A patient's viral load changes from early to late infection and varies between individuals.[ 17 ] We accounted for this natural variability by testing our system in patients with a wide range of viral loads (Table S2 and S3, Supporting Information). For example, the viral load of SARS‐CoV‐2 positive patients varied ≈2 000 000 orders of magnitude when amplified using the gold standard qRT‐PCR. In total, 79 patient swabs were used when evaluating the MNAzyme‐GNP system.
The clinical specificity and sensitivity of the MNAzyme‐GNP system were evaluated for SARS‐CoV‐2 and influenza A. Viral RNA was extracted from nasopharyngeal and mid‐turbinate swabs. The ground truth diagnosis was determined for COVID‐19 and influenza A. Patients positive for COVID‐19 were identified using qRT‐PCR for the 5’UTR and E gene (Table S2, Supporting Information). Influenza A was identified using the Luminex xTAG Respiratory Viral Panel Fast test (Table S3, Supporting Information). The extracted RNA was reverse transcribed, isothermally amplified, and detected using the MNAzyme‐GNP assay. The SARS‐CoV‐2 assay had a 90% sensitivity (95% CI, 54–99) and 100% positive predictive value (95% CI, 63–100) when detecting SARS‐CoV‐2 from nasopharyngeal swabs. The clinical specificity was 100% (95% CI, 80–100), and the negative predictive value was 95% (95% CI, 74–100) (Figure 3b, and Table S4, Supporting Information). Although cross reactivity with other coronaviruses could have compromised the specificity of the MNAzyme‐GNP assay, we were able to accurately identify patients infected with SARS‐CoV‐2. When detecting influenza A, we achieved the positive and negative predictive values of 100% (95% CI, 84–100) and 91% (95% CI, 69–98), respectively. The clinical sensitivity for influenza A was 93% (95% CI, 75–99%), and specificity was 100% (95% CI, 80–100) (Figure 3a, and Table S5, Supporting Information). The MNAzyme‐GNP system could detect SARS‐CoV‐2 and influenza with high accuracy using minimal laboratory equipment.
Figure 3.
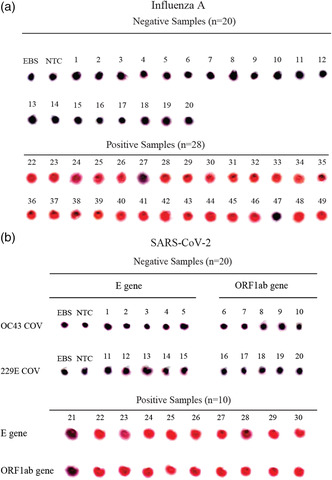
Detection of influenza A and SARS‐CoV‐2 from Clinical Swabs. RNA was extracted from clinical swabs, reverse transcribed, isothermally amplified, and detected with the MNAzyme‐GNP assay. Spot images depict the colorimetric diagnosis of a) influenza A from patient mid‐turbinate swabs and b) SARS‐CoV‐2 from patient nasopharyngeal swabs. OC43 and 229E are nontarget beta‐coronaviruses that infect humans. The E gene and ORF1ab are two regions of the SARS‐CoV‐2 genome. Spot images represent colorimetric readout on a TLC plate after adjusting for brightness and contrast on Image J. Pink indicates a positive test.
In this work, we leveraged isothermal reverse transcription and isothermal amplification to obtain clinically relevant limits of detection with minimal equipment. Other methods for detecting SARS‐CoV‐2 have been highlighted in several review articles.[ 2, 18, 19 ] Some of these detection methods have colorimetric readouts, but few have been evaluated using their intended sample type. Moitra et al. developed a GNP aggregation assay for detecting SARS‐CoV‐2 from culture.[ 20 ] Patient samples were not used, and specificity testing was only done with MERS‐CoV, a related but uncommon coronavirus. Loop‐mediated isothermal amplification has been combined with pH sensitive dyes to detect SARS‐CoV‐2.[ 21 ] In the presence of target, the solution changes from pink to yellow. Other colorimetric sensors detect Cu2+ using nanocellulose or Hg2+ using GNPs, and DNAzymes have not yet been used to detect SARS‐CoV‐2 but were similarly not evaluated using environmental samples.[ 22, 23 ] These colorimetric tests have been successful when detecting pure or spiked samples, but the challenge arises when clinical samples are used.
Clinical validation represents a challenge for new diagnostic technologies. Patient samples have additional matrix complexity, a range of possible target concentrations and mutations in the target sequence. Natural patient variability, which is absent from synthetic samples, can lead to misdiagnosis. Using a broad range of patient samples and samples from related viruses improves test design. These samples will provide a more accurate indication of diagnostic performance compared with spiked samples. Many technologies (while published) are not yet engineered for patient use. They require a redesign before they can be used for diagnosing patients. Redesign is guided by the application and the performance requirements of that application. The MNAzyme‐GNP assay was engineered for readout simplicity and redesigned for high clinical accuracy using patient samples. The redesign step in the diagnostic development process is rarely considered by academic researchers, but it is needed to advance published diagnostic concepts and to help solve the medical challenges facing society.
3. Conclusion
Our study reports the development of an MNAzyme‐GNP system capable of detecting two commonly circulating respiratory viruses. The results of the MNAzyme‐GNP system can be seen with just the naked eye. We envision that the workflow may be further automated to simplify the entire assay process, so that test results are available to clinicians within a single patient visit. We can further expand our overall approach to detect numerous respiratory viruses. Upper respiratory infections have been the leading cause of disease from 1990 to 2017 with more than 17 billion cases in 2017.[ 24 ] A respiratory virus panel can be used to identify the cause of infection even when patients with different viruses present with similar symptoms. The ability to accurately differentiate influenza from COVID‐19 allows clinicians to choose effective treatments that minimize human transmission, suffering, and death.
4. Experimental Section
4.1.
4.1.1.
GNP Synthesis and Conjugation
The colorimetric readout of the MNAzyme‐GNP assay is attributed to the GNPs. We synthesized 15 nm GNPs using the Turkevich method.[ 25 ] In brief, 98 mL of distilled water and 1 mL of 25 nM HAuCL4 were brought to boil in a prewashed flask on a stir plate (set to 300 °C). Once boiling, 1 mL of 33 mg mL−1 sodium citrate tribasic solution was quickly added. The solution was heated and stirred for 10 min before cooling on ice. Dynamic light scattering was used to measure particle size and monodispersity. Tween‐20 was added to a final concentration of 0.01% (v/v). Particles were conjugated with thiolated DNA (Table S1, Supporting Information) by mixing 100 μL of 100 nM GNPs, 100 μL of DNA (2.5 μM of GNP probe 1 and 10 μM of GNP probe 2), 40 μL of 0.1% (v/v) Tween‐20, and 60 μL of water.[ 26 ] The solution was incubated at room temperate for 5 min before adding 100 μL of 100 mM trisodium citrate buffer (pH 3). This mixture incubated another 30 min at room temperature, allowing DNA to bind the particle surface. The GNP surface was then backfilled with polyethylene glycol (PEG). DNA‐conjugated GNPs were mixed with 50 μL 2 mM 1000 Da methoxy‐ and thiol‐terminated PEG and incubated for 30 min at 60 °C. DNA‐conjugated GNPs were then washed by 3× by centrifugation at 16 000 g for 45 min. After the final wash, GNPs were resuspended in 0.01% (v/v) Tween‐20 solution and concentration adjusted to 11 nM.
RNA Extraction
RNA samples for influenza A were extracted from mid‐turbinate swabs, and samples for SARS‐CoV‐2 were extracted from nasopharyngeal swabs. Patient samples were collected at the Sunnybrook Health Sciences Centre. Samples (200 μL) were extracted with EZ1 XL or EZ1 virus mini kit version 2 (Qiagen), eluted in 60 μL of RNAse‐free water, and stored at −80 °C until later use.
Reverse Transcription and RPA
Reverse transcription RPA (RT‐RPA) was performed using TwistAmp Basic RT kit (TwistDX) for influenza A samples. A premix solution containing 2.6 μL of forward primer (10 pmol μL−1), 3.0 μL of reverse primer (10 pmol μL−1), 29.5 μL of rehydration buffer, 1.4 μL of nuclease‐free water, 1 μL of RNAse Inhibitor (BioShop Canada Inc., 40 units μL−1), 2.5 μL of magnesium acetate (280 mM), and 10 μL of extracted RNA was prepared to make a total volume of 50 μL. For negative controls, 10 μL of nuclease‐free water was added instead of extracted RNA. This solution was then transferred to a tube containing the lyophilized enzyme pellet, mixed, and incubated at 40 °C for 30 min. Reverse transcription for SARS‐CoV‐2 was done using the SensiFAST cDNA synthesis kit (Bioline Ltd.). In brief, 5 μL of RNA was mixed with 4 μL 5× TransAmp Buffer, 1 μL reverse transcriptase, and 10 μL DNase/RNase free water and then incubated as per manufacturer instructions. RPA reactions for SARS‐CoV‐2 used a premix of 2.4 μL of each primer (20 pmol μL−1), 29.5 μL of rehydration buffer, 8.2 μL of cDNA, and 5 μL of magnesium acetate. This solution was then transferred to a tube containing the lyophilized enzyme pellet, mixed, and incubated at 39 °C for 40 min.
RT‐RPA products were purified using either the EZ‐10 spin column DNA gel extraction kit (Bio Basic Inc.) or GeneJET PCR purification kit (Thermo Fisher Scientific), eluted into 50 μL, visualized by agarose gel electrophoresis (135 V, 3% agarose gel, 30 min), and stored at 4 °C for later use. For gel electrophoresis, low molecular weight ladder (New England Biolands) was used.
Denaturation and Blocking for RPA Products
Analytical sensitivity of the MNAzyme‐GNP assay was measured using 1 μL of purified RPA product, 2 μL of blocking strands mix (final concentration of 50 pmol μL−1 for each strand), and 2 μL of TE (Tris‐EDTA) buffer. The solution was incubated at 95 °C for 10 min and then 40 °C for 10 min. Clinical sensitivity and specificity were measured using 5 μL of purified RT‐RPA product and 2 μL of blocking strands mix (final concentration of 50 pmol μL−1 for each strand). The final solution was incubated at 95 °C for 10 min, and at 40 °C for 10 min.
MNAzyme‐GNP Readout
Analytical sensitivity was measured using 4 μL of blocked RPA amplicons mixed with 1 μL of 10× MNAzyme buffer (0.1 m Tris‐HCl, 0.5 m KCl, pH 8.3), 1 μL of 300 mM MgCl2, 1 μL of virus‐specific MNAzyme (4 μM) 1 μL of 1 μM of Linker, and 2 μL of water. For negative control, we used 5 μL of elution buffer and blocking strands mix. The mixture was incubated at 50 °C for 1 h. After incubation, 10 μL of the GNP probe mixture was added to the samples and negative control and incubated at 50 °C for 20 min to allow aggregation of GNPs. 3 μL of sample was then deposited on the surface of a TLC plate. The remaining sample was measured using a UV–Vis spectrophotometer to record the peak absorbance wavelength. Clinical sensitivity and specificity measurements used 6 μL of blocked RPA amplicons.
Statistical Analysis
Data were statistically analyzed using GraphPad Prism 6 and Microsoft Excel 2013. The student t‐test (two tails) was used for hypothesis testing between data pairs.
Conflict of Interest
The authors declare no conflict of interest.
Data Availability Statement
The data that supports the findings of this study are available in the supplementary material of this article.
Supporting information
Supplementary Material
Acknowledgements
H.N.K. and M.A.A.M. contributed equally to this work. W.C.W.C. would like to thank CIHR, NSERC, Connaught ISI for funding support. H.N.K. would like to thank the Canadian Institute for Health Research (CIHR), the McLaughlin Institute, the Mr. and Mrs. Ruggles Innovation Award, and the Paul Cadario Doctoral Fellowship in Global Engineering for funding. M.A.A.M. would like to thank the Ministry of Higher Education and Mission sector, Egypt. J.K. would like to thank the Natural Sciences and Engineering Research Council (NSERC) of Canada and the Centre for Global Engineering for Paul Cadario for funding. All authors would like to thank Dr. Abdullah Muhammad Syed for providing Image J script to process all the TLC spots images and Ayden Malekjahani for help with RPA optimization.
The data that supports the findings of this study are available in the supplementary material of this article.
References
- 1. Grief S. N., Prim. Care 2013, 40, 757. [DOI] [PMC free article] [PubMed] [Google Scholar]
- 2. Udugama B., Kadhiresan P., Kozlowski H. N., Malekjakani A., Osborne M., Li V. Y. C., Chen H., Mubareka S., Gubbay J. B., Chan W. C. W., ACS Nano 2020, 14, 3822. [DOI] [PubMed] [Google Scholar]
- 3. Wiersinga W. J., Rhodes A., Cheng A. C., Peacock S. J., Prescott H. C., JAMA 2020, 324, 782. [DOI] [PubMed] [Google Scholar]
- 4. Lansbury L., Rodrigo C., Leonardi-Bee J., Nguyen-Van-Tam J., Lim W. S., Cochrane Database Syst. Rev. 2019, 2, CD010406. [DOI] [PMC free article] [PubMed] [Google Scholar]
- 5. RECOVERY Collaborative Group , New Engl. J. Med. 2020. [Google Scholar]
- 6. World Health Organization , Considerations for Quaratine of Contacts of COVID-19 Cases Interm Guidance, https://www.who.int/publications/i/item/considerations-for-quarantine-of-individuals-in-the-context-of-containment-for-coronavirus-disease-(covid-19) (accessed: December 2020).
- 7. Della Ventura B., Cennamo M., Minopoli A., Campanile R., Bolletti Censi S., Terracciano D., Portella G., Velotta R., ACS Sens. 2020, 5, 3043. [DOI] [PMC free article] [PubMed] [Google Scholar]
- 8. Zagorovsky K., Chan W. C. W., Angew. Chem., Int. Ed. 2013, 52, 3168. [DOI] [PubMed] [Google Scholar]
- 9. Mokany E., Bone S. M., Young P. E., Doan T. B., Todd A. V., J. Am. Chem. Soc. 2009, 132, 1051. [DOI] [PMC free article] [PubMed] [Google Scholar]
- 10. Hoang Vu Mai P., Ung Thi Hong T., Nguyen Le Khanh H., Nguyen Thanh T., Le Thi T., Nguyen Vu S., Nguyen Phuong A., Tran Thi Thu H., Vuong Duc C., Le Ouynh M., Western Pac. Surveill. Response J. 2019, 10, 32. [DOI] [PMC free article] [PubMed] [Google Scholar]
- 11. Nagy A., Jiřinec T., Jiřincová H., Černíková L., Havlíčková M., Sci. Rep. 2019, 9, 1630. [DOI] [PMC free article] [PubMed] [Google Scholar]
- 12. Sanjuan R., Nebot M. R., Chirico N., Mansky L. M., Belshaw R., J. Virol. 2010, 84, 9733. [DOI] [PMC free article] [PubMed] [Google Scholar]
- 13. Corman V. M., Landt O., Kaiser M., Molenkamp R., Meijer A., Chu D. K., Bleicker T., Brünink S., Schneider J., Schmidt M. L., Mulders D. G., Haagmans B. L., van der Veer B., van den Brink S., Wijsman L., Goderski G., Romette J.-L., Ellis J., Zambon M., Peiris M., Goossens H., Reusken C., Pg Koopmans M., Drosten C., Eurosurveillance 2020, 25, 2000045. [Google Scholar]
- 14. Zhang Z., Abudayyeh O. O., Gootenberg J. S., Sciences C., Mathers L., unpublished 2020.
- 15. Shu Y., McCauley J., Eurosurveillance 2020, 22, 30494. [Google Scholar]
- 16. World Health Organization , Influenza Update, https://www.who.int/influenza/surveillance_monitoring/updates/latest_update_GIP_surveillance/en/ (accessed: October 2020).
- 17. Walsh K. A., Jordan K., Clyne B., Rohde D., Drummond L., Byrne P., Ahern S., Carty P. G., O’Brien K. K., O’Murchu E., O’Neill M., Smith S. M., Ryan M., Harrington P., J. Infect. 2020, 81, 357. [DOI] [PMC free article] [PubMed] [Google Scholar]
- 18. Alpdagtas S., Ilhan E., Uysal E., Sengor M., Ustundag C. B., Gunduz O., APL Bioeng. 2020, 4, 041506. [DOI] [PMC free article] [PubMed] [Google Scholar]
- 19. Bhalla N., Pan Y., Yang Z., Payam A. F., ACS Nano 2020, 14, 7783. [DOI] [PMC free article] [PubMed] [Google Scholar]
- 20. Moitra P., Alafeef M., Dighe K., Frieman M. B., Pan D., ACS Nano 2020, 14, 7617. [DOI] [PMC free article] [PubMed] [Google Scholar]
- 21. Chow F. W-N., Chan T. T.-Y., Tam A. R., Zhao S., Yao W., Fung J., Cheng F. K.-K., Lo G. C.-S., Chu S., Aw-Yong K. L., Tang J. Y.-M., Tsang C.-C., Luk H. K.-H., Wong A. C.-P., Li K. S.-M., Zhu L., He Z., Tam E. W. T., Chung T. W.-H., Wong S. C. Y., Que T.-L., Fung K. S.-C., Lung D. C., Wu A. K.-L., Hung I. F.-N., Woo P. C.-Y., Lau S. K.-P., Int. J. Mol. Sci. 2020, 21, 5380. [Google Scholar]
- 22. Ram B., Jamwal S., Ranote S., Chauhan G. S., Dharela R., ACS Appl. Polym. Mater. 2020, 2, 5290. [Google Scholar]
- 23. Chen J., Pan J., Chen S., Chem. Commun. 2017, 53, 10224. [DOI] [PubMed] [Google Scholar]
- 24. GBD , Lancet 2018, 392, 1789.30496104 [Google Scholar]
- 25. Frens G., Nat. Phys. Sci. 1973, 20, 241. [Google Scholar]
- 26. Zhang X., Servos M. R., Liu J., J. Am. Chem. Soc. 2012, 134, 7266. [DOI] [PubMed] [Google Scholar]
Associated Data
This section collects any data citations, data availability statements, or supplementary materials included in this article.
Supplementary Materials
Supplementary Material
Data Availability Statement
The data that supports the findings of this study are available in the supplementary material of this article.