Abstract
Aim
This study aimed to investigate hemogram parameters and C‐reactive protein (CRP) that can be used in clinical practice to predict mortality in hospitalized patients with a diagnosis of COVID‐19.
Methods
This cohort study was conducted at University Hospital, which is a designated hospital for COVID‐19 patients. Adult patients who were admitted to our hospital emergency department with suspected COVID‐19 and who were hospitalized in our institution with a COVID‐19 diagnosis were analysed.
Results
There were 148 patients hospitalized with COVID‐19. All‐cause mortality of follow‐up was 12.8%. There were statistically significant results between the two groups (survivors and nonsurvivors), which were classified based on hospital mortality rates, in terms of the lymphocyte to C‐reactive protein ratio (LCRP), systemic immune inflammation index (SII), neutrophil‐to‐lymphocyte ratio (NLR), platelet‐to‐lymphocyte ratio (PLR), CRP concentration and comorbid disease. In a receiver operating characteristic (ROC), curve analysis, LCRP, NLR, PLR and SII area under the curve (AUC) for in‐hospital mortality were 0.817, 0.816, 0.733 and 0.742, respectively. Based on an LCRP value of 1 for in‐hospital mortality, the sensitivity and specificity rates were 100% and 86.8%, respectively. Based on the average SII of 2699 for in‐hospital mortality, the sensitivity, specificity and accuracy rates were 68.4%, 77.5% and 76.3%, respectively.
A total of 19 patients died during hospitalization. All of these patients had an LCRP level ≤ 1; 14 had an NLR level ≤ 10.8; 13 had an SII ≥ 2699 (Fisher's exact test, P = .000). Independent predictors of in‐hospital mortality rates were LCRP < 1, PLR, SII ≥ 2699, white blood cell count, CRP, age, comorbidities, and ICU stay.
Conclusions
We concluded that inflammatory parameters, such as LRCP, SII and NLR, were associated with disease severity and could be used as potentially important risk factors for COVID‐19 progression.
What’s known
COVID‐19 has infected approximately 32 million people.
The patient load has seriously disturbed medical institutions.
There are studies showing that inflammation markers are used as an early warning signal of severe COVID‐19 infection
What’s new
SII and LCRP are two new markers in this topic.
CRP, SII, PLR and NLR exhibited the largest area under the curve, with the highest specificity and sensitivity.
Decreased LCRP and increased SII can be considered independent biomarkers for indicating poor clinical outcomes.
1. INTRODUCTION
The new coronavirus (COVID‐19) referred to as severe acute respiratory syndrome coronavirus 2 (SARS‐CoV‐2) appeared in Wuhan, China, on 31 December 2019 and spread across the globe. 1 The World Health Organisation subsequently declared a pandemic. 2 , 3 COVID‐19 has infected approximately 20 million people and caused 724 000 deaths. 4 The patient load has seriously disturbed medical institutions. The media has reported that health institutions in some countries were insufficient and that there was nowhere for patients to be hospitalized.
In hospitals where there are many patient admissions, distinguishing critical patients is one of the most sensitive issues. It is important to determine which patients have a high risk of death and which have critical illness. It has become important to classify risk factors that could reveal the severity of cases of coronavirus disease 2019 (COVID‐19).
The high pathogenicity of COVID‐19 is known. However, the reason has not yet been revealed. The disease progresses more seriously in patients with comorbidities. Proinflammatory cytokines and immune inflammation may be involved in its pathophysiology. The occurrence of lymphopenia and neutrophilia has been reported in several studies. Systemic immune inflammation (SII) index, which is an inflammation‐related index, is a comprehensive combination based on the counting's of peripheral lymphocyte, neutrophil and platelet. The formula of SII index is as follows: SII =platelet count ×neutrophil/lymphocyte count. The D dimer concentration, troponin concentration, neutrophil count, lymphocyte count, neutrophil‐to‐lymphocyte ratio (NLR) and C‐reactive protein (CRP) concentration, which are markers of inflammation, have been analysed in previous studies. 1 , 5 , 6 , 7 , 8 The LRCP is a parameter that can be used as an inflammation marker, similar to NLR. This rate occurs, especially in bacterial infections, by dividing the lymphocyte level the amount of which will decrease relatively, with the CRP whose blood value will increase. Its use as an inflammatory marker is extremely new. In a review that we recently conducted, only two studies that have investigated this ratio have been identified in the literature, and both works involved cancer patients. At the end of these studies, they reported that the LCRP was an inflammation marker associated with mortality and postoperative management. 9 , 10 However, the clinical implications of these results still remain unclear.
In this retrospectively reviewed, we aimed to investigate whether severe or fatal COVID‐19 in patients who presented to the emergency department (ED) of our hospital was related to specific laboratory test results and comorbidities during the first admission.
2. MATERIALS AND METHODS
2.1. Study design and setting
This single‐center cohort study was conducted at XXX University Training and Research Hospital, which is a designated hospital for COVID‐19 patients. Before the study was conducted, approval was obtained from the University Human Research Ethics Committee (No: 200114). Adult patients (ie, patients aged 18 years or older) who were admitted to our hospital ED with suspected COVID‐19 and who were hospitalized in our institution with clinical findings, thoracic computed tomography (CT) and/or polymerase chain reaction (PCR) test results of definite or a high probability of COVID‐19 were analyzed.
2.2. Definitions
Diagnoses of COVID‐19 were made according to World Health Organization interim guidance and confirmed by RNA detection of SARS‐CoV‐2 by an onsite clinical laboratory. 11 If a patient's PCR test was negative, the presence of clinical signs (fever of 38.3°C, cough or shortness of breath) that could not be explained by any other disease or the presence of COVID‐19 findings on thoracic CT caused the patient to be evaluated as a possible case of COVID‐19.
2.3. Selection of participants
We also examined the data of patients who were hospitalized in the ward or the intensive care unit (ICU) with a diagnosis of COVID‐19 between March 11 and June 30, 2020. A list of the patients who were diagnosed and examined with the COVID 19‐code U17.1 was collected from the hospital's department of information technology, and both the patients’ files and imaging were retrospectively examined. The inclusion criteria were as follows: age of 18 years old or older, diagnosis of COVID‐19 and hospitalization. The exclusion criteria included those younger than 18 years, pregnant patients and patients who lacked data.
2.4. Study protocol and follow‐up evaluation
As a general practice in our hospital, these patients are evaluated by an emergency medicine specialist after being admitted to the ED. Complete blood count, glucose, kidney, liver function, electrolyte and CRP examinations are requested; a chest radiograph or chest CT is performed; and if necessary, a consultation is requested.
The patients evaluated by a consultant are admitted based on laboratory test and CT results. According to the severity of COVID‐19, patients are admitted to the general ward or ICU by the consultant who evaluates the patients. All these data are saved in the patients’ files and the hospital's electronic medical record. The data of the patients were obtained from the electronic medical record of our hospital and the individual patient files.
2.5. Data collection
For each patient, one senior emergency medicine resident who blinded to the study objectives and hypothesis manually abstracted all data (demographics, clinical characteristics, hemodynamic parameters, laboratory test results, and outcomes) from clinician notes or medical history sections within the electronic health record, entered them into standardized chart abstraction tool, and then imported the data into SPSS 22.0 (SPSS, Inc, Chicago, IL) for statistical analyses. Because the laboratory markers and other parameters were studied routinely in the daily practice of our hospital for hospitalized patient, no missing data were found. A form was created to be individually completed for each patient. The form included the following parameters: patient age, gender, admission complaint, comorbidities, vital signs, CT findings and laboratory values obtained from the blood samples collected in the ED. The laboratory values included white blood cell (WBC) count, hemoglobin (Hb) concentration, lymphocyte count, platelet (Plt) count, CRP concentration, NLR, SII and PLR (the platelet count divided by the lymphocyte count). The LCRP values (the lymphocyte count divided by the CRP concentration) were also calculated and recorded. The following details were recorded during hospitalization: where the patient was hospitalized (ICU or general ward), hospital length of stay (LOS), ICU admission and all‐cause in‐hospital mortality rate.
2.6. Laboratory methods
The blood test results of the patients during their first admissions to the ED of our hospital were reviewed. During the study period, blood samples were drawn in tubes containing sodium citrate and analysed at room temperature using a Pentra DF Nexus Hariba medical device in the biochemistry laboratory. These blood samples were analysed for the following parameters: WBC count (4.5‐11.0 × 10³/µL), Hb (13.5‐16 g/dL), neutrophil count (2‐12 × 103/mL), lymphocyte count (1‐4.9 × 10³/mL), Plt count (156‐373 × 103/µL) and CRP concentration (0‐5 mg/L).
2.7. Statistical analysis
The data were analysed using the Statistical Package for Social Sciences 20.0 for Windows (SPSS Inc, Chicago, IL). The normality of distribution for the quantitative data was evaluated using the Kolmogorov‐Smirnov test. Parametric tests (ie, the independent samples t test and the Tukey's post hoc test) were applied to normally distributed data, and non‐parametric tests (ie, the Mann‐Whitney U test and the Kruskal‐Wallis test) were applied to non‐normally distributed data. Continuous data are expressed as the mean ± standard deviation or median (range), as appropriate. All differences with a P value of .05 or less were considered statistically significant. The area under the ROC curve was calculated and used to evaluate diagnostic accuracy. The cumulative survival rate was calculated using the Kaplan‐Meier method, and differences in survival between the groups were compared using the log‐rank test. To identify variables associated with in‐hospital mortality, the data were initially analysed with a univariate analysis. Significant variables were subsequently used for a stepwise forward logistic regression analysis. In addition, sensitivity and specificity evaluations for mortality were conducted.
3. RESULTS
There were 160 patients hospitalized in our ED with suspected COVID‐19. Of these, nine were excluded due to younger than 18 years, two were excluded because they were pregnant, and one was excluded due to lacked data. After excluding these patients, 148 patients included this study (Table 1). The mean age (SD) of these patients was 59.45 ± 21.00 years (range, 18‐94 years), and 56 (37.8%) patients were women. Demographic, comorbidities, complaint, blood pressure (BP), pulse, CT finding and laboratory results of the patients are shown in Table 2.
TABLE 1.
Patient flow chart. Flow chart depicting patient flow
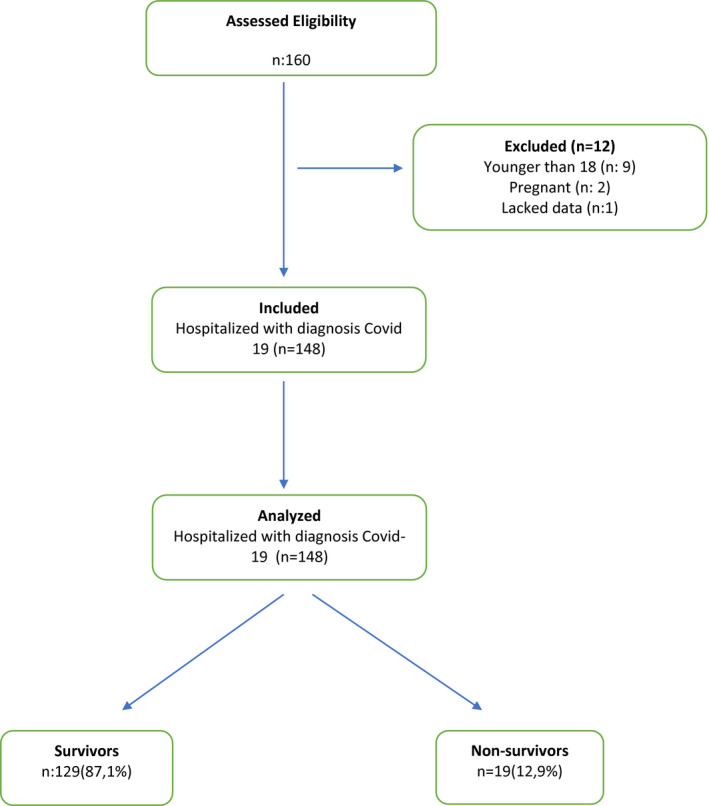
TABLE 2.
The statistical results of the groups according to in‐hospital mortalty (survivors‐non‐survivors)
|
Survivors n: 129 |
Nonsurvivors n: 19 |
Total n: 148 |
P value | |
|---|---|---|---|---|
| Age (years old) | 57.91 ± 20.95 | 69.89 ± 18.68 | 59.45 ± 21.00 | ≤.05 |
| Gender (F/M) | 87/42 | 5/14 | 92/56 | ≤.05 |
| Complaint | ||||
| Fever | 50 (38.7%) | 4 (21.0%) | 54 (36.5%) | ≥.05 |
| Shortness of breath | 68 (52.7%) | 11 (57.8%) | 79 (53.4%) | ≥.05 |
| Cough | 94 (72.8%) | 12 (63.1%) | 106 (71.6%) | ≥.05 |
| Myalgia | 49 (37.9%) | 12 (63.1%) | 61 (41.2%) | ≤.05 |
| Diarrhea | 30 (23.2%) | 3 (15.7%) | 33 (22.3%) | ≥.05 |
| Blood pressure | ||||
| ≤140/90 mmHg | 87 (67.4%) | 7 (36.8%) | 94 (63.5%) | ≥.05 |
| >140/90 mmHg | 42 (32.5%) | 12 (63.1%) | 54 (36.5%) | |
| Pulse | ||||
| 60‐80 beats/min | 41 (31.7%) | 5 (26.3%) | 46 (31.1%) | ≥.05 |
| 80‐100 beats/minute | 40 (31.0%) | 4 (21.0%) | 44 (29.7%) | ≥.05 |
| 100‐120 beats/min | 43 (33.3%) | 5 (26.3%) | 48 (32.4%) | ≥.05 |
| >120 beats/min | 5 (3.8%) | 5 (26.3%) | 10 (6.8%) | ≤.05 |
| Comorbid disease a | 68 (52.7%) | 16 (84.2%) | 84 (56.8%) | ≤.05 |
| DM | 20 (15.5%) | 6 (31.5%) | 26 (17.6%) | ≥.05 |
| HT | 43 (33.3%) | 11 (57.8%) | 54 (36.7%) | ≤.05 |
| COPD | 24 (18.6%) | 4 (21.0%) | 28 (18.9%) | ≥.05 |
| CAD | 33 (25.5%) | 9 (47.3%) | 42 (28.4%) | ≤.05 |
| CRF | 13 (10.0%) | 3 (15.7%) | 16 (10.8%) | ≥.05 |
| CVD | 9 (6.9%) | 2 (10.5%) | 11 (7.4%) | ≥.05 |
| Malignancy | 9 (6.9%) | 2 (10.5%) | 11 (7.4%) | ≥.05 |
| CT | ||||
| Compatible with Covid 19 | 87 (67.4%) | 14 (73.6%) | 101 (68.2%) | ≥.05 |
| Incompatible with Covid 19 | 42 (32.5%) | 5 (26.3%9 | 47 (31.8%) | |
| CT finding | ≥.05 | |||
| Ground glass opacity | 77 (59.6%) | 14 (73.6%) | 91 (61.5%) | ≥.05 |
| Nodular lesions | 45 (35.8%) | 8 (42.1%) | 53 (35.8%) | ≥.05 |
| Consolidation | 33 (25.5%) | 6 (31.5%) | 39 (26.4%) | ≥.05 |
| Air bronchogram | 40 (31.0%) | 7 (36.8%) | 47 (31.8%) | ≥.05 |
| Irregular paving stones | 38 (29.4%) | 7 (36.8%)) | 45 (30.4%) | ≥.05 |
| Bronchiectasis | 16 (12.4%) | 5 (26.3%) | 21 (14.2%) | ≥.05 |
| Infiltration | 17 (13.1%) | 5 (26.3%) | 22 (14.9%) | ≥.05 |
| Reticular pattern | 34 (26.3%) | 3 (15.7%) | 37 (25.0%) | ≥.05 |
| Atelectasis | 14 (10.8%) | 3 (15.7%) | 17 (11.0%) | ≥.05 |
| Disposition (ICU/Ward) | ≤.05 | |||
| WBC (×103/µL) | 10.05 ± 5.37 | 11.28 ± 5.70 | 10.21 ± 5.41 | ≥.05 |
| Neutrophil (K/mL) | 7.51 ± 4.99 | 10.05 ± 5.11 | 7.83 ± 5.06 | ≤.05 |
| Lymphocyte (K/mL) | 1.55 ± 0.96 | 0.59 ± 0.32 | 1.42 ± 0.96 | ≤.05 |
| CRP (mg/L) (min‐max) | 78.62 (1.00‐445.38) | 192.27 (99.30‐618.89) | 93.2 (1.0‐618.8) | ≤.05 |
| NLR | 9.40 (0.52‐83.64) | 21.00 (3.87‐62.73) | 10.89 (0.52‐83.64) | ≤.05 |
| PLR (min‐max) | 261.5 (46.6‐1628.0) | 427.9 (106.0‐1184.0) | 282.90 (46.61‐1628.00) | ≤.05 |
| LCRP | 0.36 (0.0‐3.94) | 0.03 (0.0‐0.1) | 0.32 (0.0‐3.94) | ≤.05 |
| SII (min‐max) | 2445 (83‐34 041) | 4426 (100‐10 977) | 2699 (83‐34 041) | ≤.05 |
Bold indicates statistical significant value (P < .05).
Abbreviations: CAD, coronary artery disease; COPD, chronic obstructive pulmonary disease; CRF, chronic renal failure; CRP, C‐reactive protein; CT, computed tomography; CVD, cerebrovascular disease; DM, diabetes mellitus; F, female; HT, hypertension; ICU, intensive care unit; LCRP, lymphocyte C‐reactive protein ratio; M, male; min, minute; NLR, neutrophil lymphocyte ratio; PLR, platelet lymphocyte ratio; SII, systemic immune‐inflammation index; WBC, white blood cell.
Some patients had got more than one comorbid disease.
It was observed that 112 (75.7) of the patients were admitted to COVID‐19 wards; 36 (24.3%) were admitted to the ICU. Of these patients, 19 (12.8%) patients died in the hospital, and 129 (87.2%) were discharged.
When the patients were divided into two groups as survivors and nonsurvivors according to hospital mortality and compared, statistically significant differences were observed in age, gender, complaint of myalgia, HR comorbid disease, HT, CAD, hospitalization in ICU, neutrophil count, lymphocyte count, CRP concentration, LCRP ratio, NLR, PLR and SII (P ≤ .05). However, no significant differences were observed in complaints of dyspnoea, cough, fever or diarrhoea; BP, diabetes mellitus (DM), chronic obstructive pulmonary disease (COPD), chronic renal failure (CRF), cerebrovascular disease (CVD), malignancy, laboratory test results for the WBC count or Plt count (Table 2).
When the LCRP ratio, NLR, PLR and SII were measured in the ROC curve analysis, the closer the AUC was to 1, the more valuable the marker was. The AUC of the LCRP ratio, NLR, PLR and SII for in‐hospital mortality was 0.817 (95% CI: 0.747‐0.886; P = .00), 0.816 (95% CI: 0.735‐0.896; P = .00), 0.733 (95% Cl: 0.628‐0.838; P = .01) and 0.742 (95% Cl: 0.620‐0.864; P: .01) respectively, indicating that there was a strong relationship between in‐hospital mortality and the LCRP ratio, NLR, PLR and SII (Figures 1, 2, 3, 4). Based on an LCRP ratio of 1 for in‐hospital mortality, the sensitivity, specificity and accuracy rates were 100%, 86.8% and 88.5%, respectively. Based on the average NLR of 10.89 for in‐hospital mortality, the sensitivity, specificity and accuracy rates were 73.6%, 76.7% and 76.3%, respectively. Based on the average PLR of 289.90 for in‐hospital mortality, the sensitivity, specificity and accuracy rates were 57.8%, 68.9% and 67.3%, respectively. Based on the average SII of 2699 for in‐hospital mortality, the sensitivity, specificity and accuracy rates were 68.4%, 77.5% and 76.3%, respectively (Table 3).
FIGURE 1.
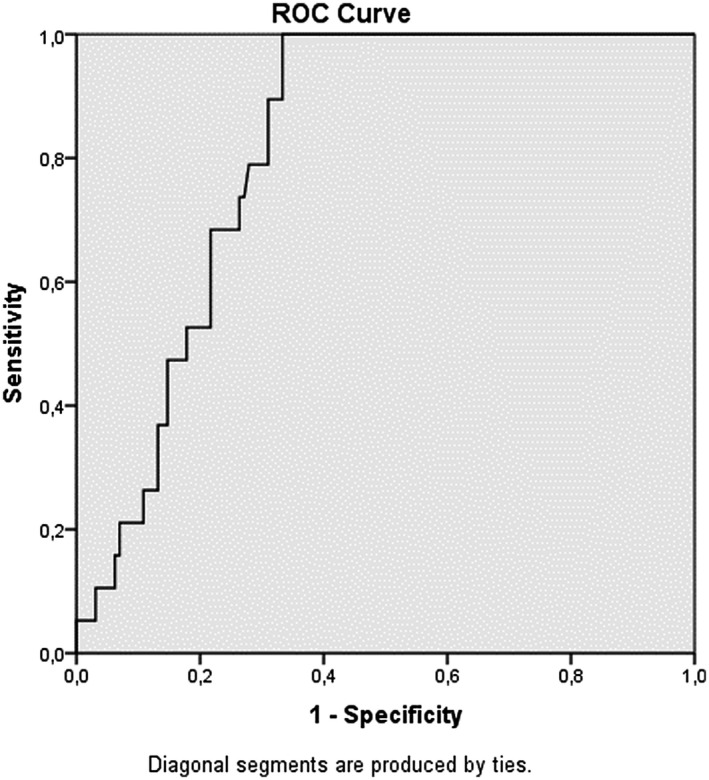
Receiver operating characteristic (ROC) curve analizi lymphocyte C‐reactive protein ratio (LCRP)
FIGURE 2.
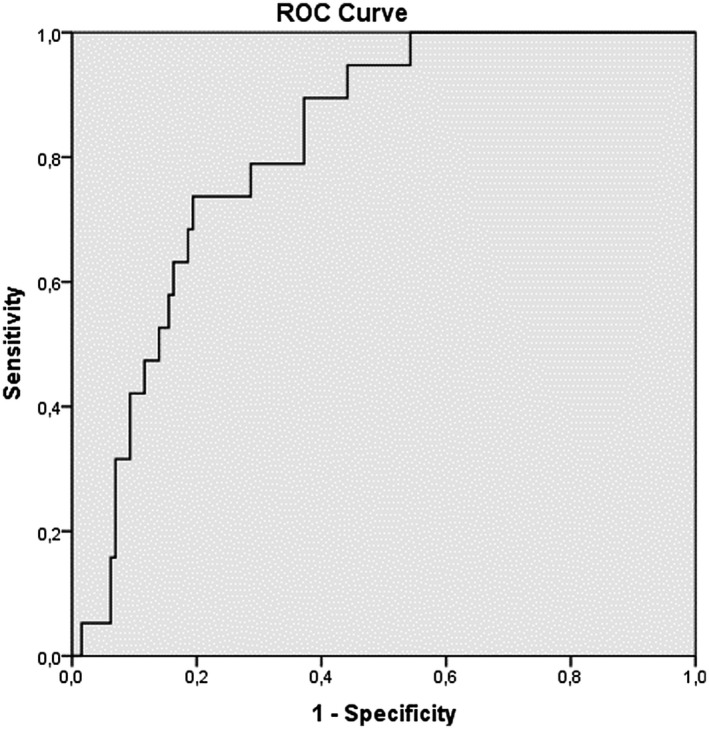
Receiver operating characteristic (ROC) curve analizi neutrophil lymphocyte ratio (NLR)
FIGURE 3.
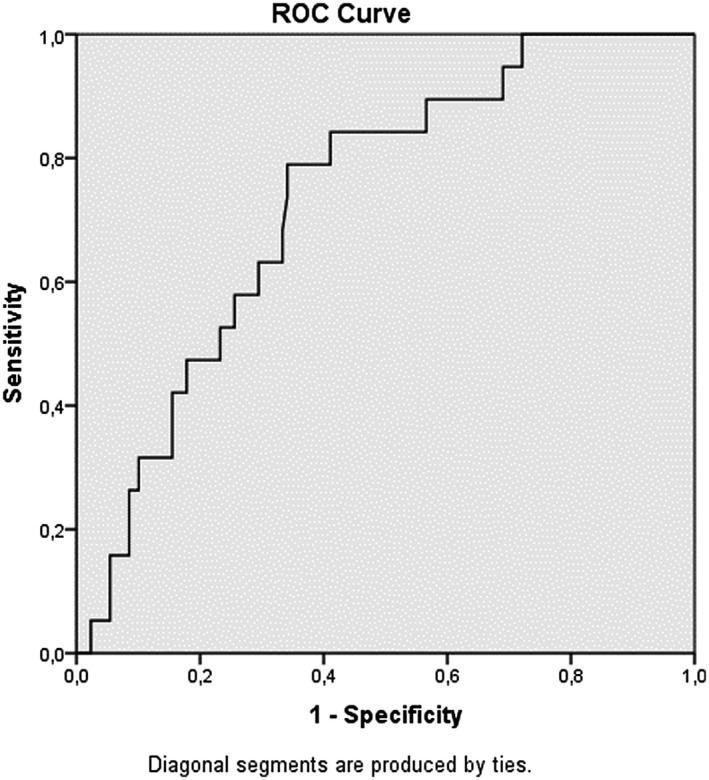
Receiver operating characteristic (ROC) curve analizi platelet lymphocyte ratio (PLR)
FIGURE 4.
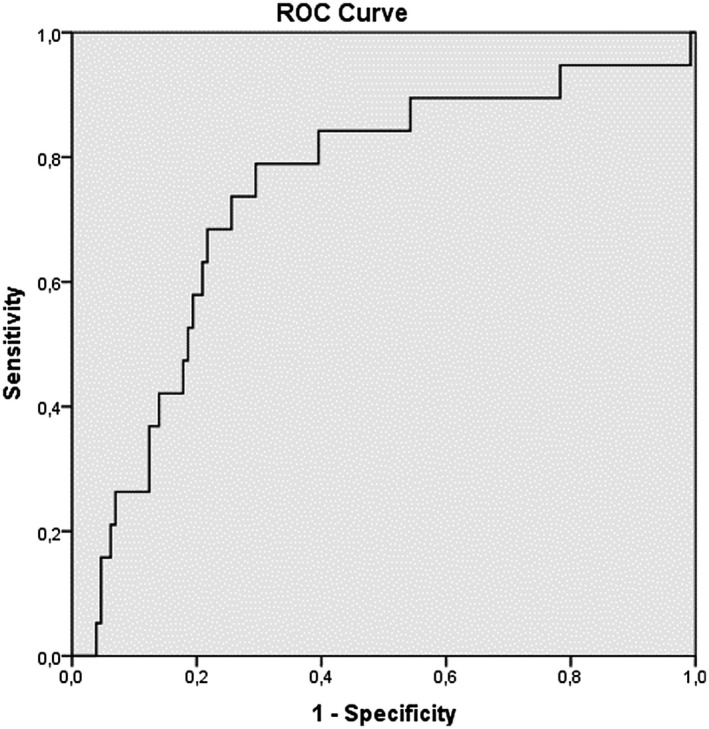
Receiver operating characteristic (ROC) curve analizi systemic immune‐inflammation index (SII)
TABLE 3.
Sensitivity and specificity in terms of in‐hospital mortality when LCRP ≤ 1, NLR ≥ 10.89, PLR ≥ 289.9 and SII ≥ 2699 are taken
| LCRP ≤ 1 | Mortality Yes | Mortality No | Sensitivity | Specificity | Accuracy | PPV | NPV |
|---|---|---|---|---|---|---|---|
| Positive | 19 | 17 | 100% | 86.8% | 88.5% | 52.7% | 100% |
| Negative | 0 | 112 | |||||
| NLR ≥ 10.89 | Mortality Yes | Mortality No | Sensitivity | specificity | Accuracy | PPV | NPV |
| Positive | 14 | 30 | 73.6% | 76.7% | 76.3% | 31.8% | 95.1% |
| Negative | 5 | 99 | |||||
| PLR ≥ 289.9 | Mortality Yes | Mortality No | Sensitivity | specificity | Accuracy | PPD | NPD |
| Positive | 11 | 37 | 57.8% | 68.9% | 67.3% | 22.9% | 91.1% |
| Negative | 8 | 82 | |||||
| SII ≥ 2699 | Mortality Yes | Mortality No | Sensitivity | specificity | Accuracy | PPD | NPD |
| Positive | 13 | 29 | 68.4% | 77.5% | 76.3% | 30.9% | 94.3% |
| Negative | 6 | 100 |
Abbreviations: LCRP, lymphocyte C reactive protein ratio; NLR, neutrophil lymphocyte ratio; NPV, negative predictive value; PLR, platelet lymphocyte ratio; PPV, positive predictive value; SII, systemic ımmune‐ınflammation ındex.
A total of 19 patients died during hospitalization. All of these patients had an LCRP ratio ≤ 1; 14 had an NLR ≥ 10.8; 13 had a SII ≥ 2699, and 11 had a PLR ≥ 289.9 (Fisher's exact test, P = .00). Figures 5 and 6 show the Kaplan‐Meier survival curve for the LCRP and SII ratio according to these cut‐off values. Patients with LCRP ratios below the cut‐off value and SII ratios above the cut‐off value had significantly higher mortality rates than those with LCRP ratios above the cut‐off value and SII ratios below the cut‐off value (log‐rank test = 2.663; P = .00). Independent predictors for in‐hospital mortality were LCRP ≤ 1, PLR, CRP concentration, age, comorbidities, SII ≥ 2699 and ICU stay (Table 4).
FIGURE 5.
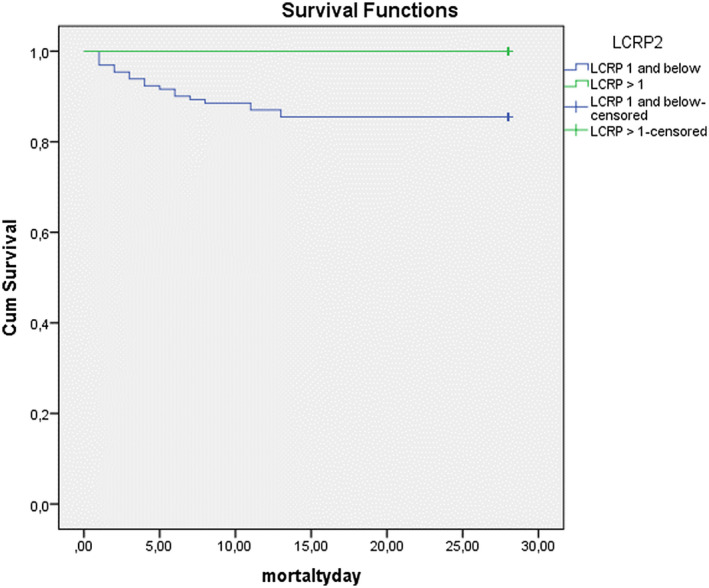
The Kaplan‐Meier survival curve for lymphocyte C‐reactive protein ratio (LCRP)
FIGURE 6.
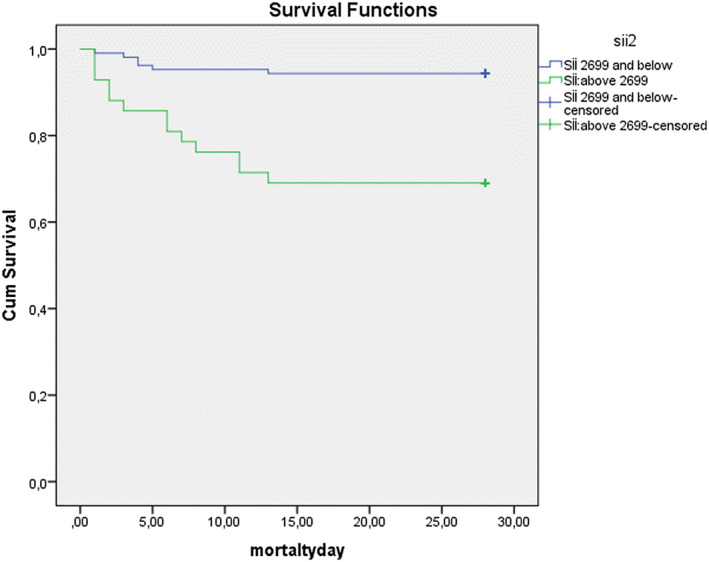
The Kaplan‐Meier survival curve for systemic immune‐inflammation index (SII)
TABLE 4.
Multivariate logistic regression analysis for the prediction of mortality
| Variables for 28 d | Odds ratio | 95% CI | P |
|---|---|---|---|
| Stay ICU | 10.651 | 3.828‐29.634 | .000 |
| SII ≥ 2699 | 7.471 | 2.609‐21.392 | .000 |
| Commorbit disease | 3.030 | 1.007‐9.0140 | .049 |
| LCRP ≤ 1 | 2.340 | 1.377‐6.326 | .015 |
| Age | 1.030 | 1.005‐1.057 | .021 |
| CRP | 1.007 | 1.004‐1.010 | .000 |
| PLR ≥ 289.9 | 0.9981 | 0.997‐1.000 | .021 |
Abbreviations: ICU, intensive care unit; LCRP, lymphocyte C reactive protein ratio; NLR, neutrophil lymphocyte ratio; PLR, platelet lymphocyte ratio, SII, systemic immune‐inflammation index.
4. DISCUSSION
Based on the blood tests performed at the time of ED admission, the LCRP and SII were associated with both the need for mortality. Patients’ comorbidities are an important predictor of mortality in COVID‐19. In our study, the LRCP ratio, SII and comorbidities were independent predictors of mortality (odds ratios for comorbid disease, LCRP and SII: 3.03, 2.34 and 7.47, respectively). In our study, 19 patients died during hospitalization, and all of these patients had an LCRP ratio ≤ 1, and 14 patients had an SII ≥ 2699. Our study is valuable because it is the first study of the LCRP ratio and SII in SARS‐CoV‐2 infection, and its results demonstrated successful prediction of mortality.
COVID‐19 is a global disease, and a significant number of patients require critical care. 10 As it is difficult to follow a large number of patients in the hospital, choosing patients with a worse prognosis seems to be one of the most important goals for medicine at present. Viral infection is closely related to the human immune system, and good immune function can help the body eliminate foreign microorganisms and control infections. 12 , 13 Irregular immune cell responses are thought to play important roles in the severity of viral disease. 12 , 14 In addition, peripheral blood inflammatory parameters also significantly change with COVID‐19 progression. Therefore, new research has focused on available laboratory data to assess and predict clinical severity in patients with COVID‐19. 12 Hematological biomarkers used to classify COVID‐19 patients include WBC count, lymphocyte count, neutrophil count, NLR, platelet count, PLR and hemoglobin. 15 Many studies have reported that an abnormal inflammatory response in patients with COVID‐19 is an important predictor of mortality. These studies state that the WBC count and CRP concentration increase, and the lymphocyte count decreases in severe disease. NLR can also be used to predict mortality in COVID‐19, as in many inflammatory‐related diseases. 15 , 16 , 17 , 18 , 19 Yang et al 20 reported lymphopenia in 80% of patients with critical COVID‐19 infection, whereas Chen et al 6 reported lymphopenia only 25% of patients with mild COVID‐19 infection. These observations suggest that lymphopenia may be related to infection severity. Qin et al 21 studied 452 patients with COVID‐19 and found that severe cases involved a higher neutrophil count but lower lymphocyte count compared to patients with milder COVID‐19 and that NLR, therefore, tended to be higher in the severe group. In our study, WBC count, CRP concentration, NLR and PLR elevation and lymphocyte count decline were associated with both mortality and intensive care requirement in accordance with the literature. Although the LCRP ratio is a new marker, our results show compatibility with those in the literature because the LCRP ratio demonstrates inflammation and predicts mortality similar to other markers.
Similar to other markers, SII can be used as a new marker calculated by the countings of peripheral blood cells and showing inflammation. In this study, it has been shown to be a more objective marker with better predictive reliability for host immune and inflammatory status and prognosis. When the literature is investigated, it is seen that SII is used in several oncological studies. 22 , 23 , 24 Our study is the first to evaluate the infection process. When evaluated together with the results, we think that its contribution to the literature will carry importance.
Patients with COVID‐19 who are elderly or who have comorbidities progress to have more serious clinical findings. 8 , 25 A study by Zang et al of patients with a mean age of 62 revealed that the presence of underlying comorbidities was related to the severity of COVID‐19. 8 , 26 After dividing cases into two groups as serious and mild, Dong et al stated that the average age in serious cases was 60 years and that these cases involved comorbidities more frequently than the mild cases. 27 In our study, the mortality of our patients increased with age and comorbidities, and these results are compatible with those in the literature.
In summary, we cautiously conclude that immunoinflammatory parameters, such as the NLR, PLR, SII and LRCP ratio, are associated with disease mortality and can be used to predict disease progression and mortality. In addition, a decreased LCRP ratio and increased PLR, SII and NLR, which reflect inflammation, can also indicate a poor prognosis. Therefore, inflammatory parameters, especially the LCRP ratio, SII, NLR and PLR, in COVID‐19 can assist in the diagnosis of prediction of mortality.
5. LIMITATIONS
First, our study has limited data, because it is a retrospective study. It is known that some of the index/ratios obtained from the hemogram are also affected by conditions such as obesity and long‐term smoking. However, obesity and smoking histories of the patients were not questioned in our study. In addition, the number of patients with PCR positive results and the number of fatalities were low. For this reason, generalisation of these results to all of society may not be appropriate. Broad, multicentre studies are needed.
DISCLOSURE
The authors declared no conflict of interest.
Acar E, Demir A, Yıldırım B, Kaya MG, Gökçek K. The role of hemogram parameters and C‐reactive protein in predicting mortality in COVID‐19 infection. Int J Clin Pract. 2021;75:e14256. 10.1111/ijcp.14256
REFERENCES
- 1. Huang C, Wang Y, Li X, et al. Clinical features of patients infected with 2019 novel coronavirus in Wuhan, China. Lancet. 2020;395:497‐506. [DOI] [PMC free article] [PubMed] [Google Scholar]
- 2. Boserup B, McKenney M, Elkbuli A. The impact of the COVID‐19 pandemic on emergency department visits and patient safety in the United States. Am J Emerg Med. 2020;38:1732‐1736. [DOI] [PMC free article] [PubMed] [Google Scholar]
- 3. Coronavirus disease (COVID‐19) Pandemic; 2020. https://covid19.who.int/?gclid=Cj0KCQjw3s_4BRDPARIsAJsyoLMe7IA60hUoTk26HnPP94AU‐ocwR8T9_AYk__KxhBq12vAwelk2GcAaAkSmEALw_wc. Accessed July 19, 2020.
- 4. WHO Coronavirus Disease (COVID‐19) Dashboard. https://covid19.who.int/. Accessed August 8, 2020.
- 5. Zhang Y, Chen B, Wang L, Wang R, Yang X. Systemic immune‐inflammation index is a promising noninvasive marker to predict survival of lung cancer: a meta‐analysis. Medicine (Baltimore). 2019;98:e13788. [DOI] [PMC free article] [PubMed] [Google Scholar]
- 6. Chen N, Zhou M, Dong X, et al. Epidemiological and clinical characteristics of 99 cases of 2019 novel coronavirus pneumonia in Wuhan, China: a descriptive study. Lancet. 2020;395:507‐513. [DOI] [PMC free article] [PubMed] [Google Scholar]
- 7. Fan BE, Chong V, Chan S, et al. Hematologic parameters in patients with COVID‐19 infection. Am J Hematol. 2020;95:E131‐E134. [DOI] [PubMed] [Google Scholar]
- 8. Guan W, Ni Z, Hu Y, et al. Clinical characteristics of coronavirus disease 2019 in China. N Engl J Med. 2020;382:1708‐1720. [DOI] [PMC free article] [PubMed] [Google Scholar]
- 9. Okugawa Y, Toiyama Y, Yamamoto A, et al. Lymphocyte‐C‐reactive protein ratio as promising new marker for predicting surgical and oncological outcomes in colorectal cancer. Ann Surg. 2019;272:342‐351. [DOI] [PubMed] [Google Scholar]
- 10. Okugawa Y, Toiyama Y, Fujikawa H, et al. Prognostic potential of lymphocyte‐C‐reactive protein ratio in patients with rectal cancer receiving preoperative chemoradiotherapy. J Gastrointest Surg. 2020;25:492‐502. [DOI] [PubMed] [Google Scholar]
- 11. The Fifth Revised Trial Version of the Novel Coronavirus Pneumonia Diagnosis and Treatment Guidance. http://www.nhc.gov.cn/yzygj/s7652m/202002/41c3142b38b84ec4a748e60773cf9d4f. Accessed July 19, 2020.
- 12. Feng X, Li S, Sun Q, et al. Immune‐inflammatory parameters in COVID‐19 cases: a systematic review and meta‐analysis. Front Med (Lausanne). 2020;7:301. [DOI] [PMC free article] [PubMed] [Google Scholar]
- 13. Xia X, Wu J, Liu H, et al. Epidemiological and initial clinical characteristics of patients with family aggregation of COVID‐19. J Clin Virol. 2020;127:104360. [DOI] [PMC free article] [PubMed] [Google Scholar]
- 14. Channappanavar R, Perlman S. Pathogenic human coronavirus infections: causes and consequences of cytokine storm and immunopathology. Semin Immunopathol. 2017;39:529‐539. [DOI] [PMC free article] [PubMed] [Google Scholar]
- 15. Zheng Y, Xu H, Yang M, et al. Epidemiological characteristics and clinical features of 32 critical and 67 noncritical cases of COVID‐19 in Chengdu. J Clin Virol. 2020;127:104366. [DOI] [PMC free article] [PubMed] [Google Scholar]
- 16. Henry BM, Oliveira MHS, de Benoit S, Plebani M, Lippi G. Hematologic, biochemical and immune biomarker abnormalities associated with severe illness and mortality in coronavirus disease 2019 (COVID‐19): a meta‐analysis. Clin Chem Lab Med. 2020;58:1021‐1028. [DOI] [PubMed] [Google Scholar]
- 17. Ponti G, Maccaferri M, Ruini C, Tomasi A, Ozben T. Biomarkers associated with COVID‐19 disease progression. Crit Rev Clin Lab Sci. 2020;57:389‐399. [DOI] [PMC free article] [PubMed] [Google Scholar]
- 18. Imran MM, Ahmed U, Usman U, Ali M, Shaukat A, Gul N. Neutrophil/lymphocyte ratio – a marker of COVID‐19 pneumonia severity. Int J Clin Pract. Accepted Articles. [DOI] [PubMed] [Google Scholar]
- 19. Imran MM, Ahmed U, Usman U, Ali M, Shaukat A, Gul N. Neutrophil/Lymphocyte Ratio – A Marker of COVID‐19 Pneumonia Severity. Int J Clin Pract. 2021;75:e13698. [DOI] [PubMed] [Google Scholar]
- 20. Yang X, Yu Y, Xu J, et al. Clinical course and outcomes of critically ill patients with SARS‐CoV‐2 pneumonia in Wuhan, China: a single‐centered, retrospective, observational study. Lancet Respir Med. 2020;8:475‐481. [DOI] [PMC free article] [PubMed] [Google Scholar]
- 21. Qin C, Zhou L, Hu Z, et al. Dysregulation of immune response in patients with COVID‐19 in Wuhan, China. Clin Infect Dis. 2020;71:762‐768. [DOI] [PMC free article] [PubMed] [Google Scholar]
- 22. Tong YS, Tan J, Zhou XL, Song YQ, Song YJ. Systemic immune‐inflammation index predicting chemoradiation resistance and poor outcome in patients with stage III non‐small cell lung cancer. J Transl Med. 2017;15:221. [DOI] [PMC free article] [PubMed] [Google Scholar]
- 23. Hong X, Cui B, Wang M, et al. Systemic immune‐inflammation index, based on platelet counts and neutrophil‐lymphocyte ratio, is useful for predicting prognosis in small cell lung cancer. Tohoku J Exp Med. 2015;236:297‐304. [DOI] [PubMed] [Google Scholar]
- 24. Gao Y, Zhang H, Li Y, et al. Preoperative increased systemic immune‐inflammation index predicts poor prognosis in patients with operable non‐small cell lung cancer. Clin Chim Acta. 2018;484:272‐277. [DOI] [PubMed] [Google Scholar]
- 25. Pan F, Yang L, Li Y, et al. Factors associated with death outcome in patients with severe coronavirus disease‐19 (COVID‐19): a case‐control study. Int J Med Sci. 2020;17:1281‐1292. [DOI] [PMC free article] [PubMed] [Google Scholar]
- 26. Zhang L, Yan X, Fan Q, et al. D‐dimer levels on admission to predict in‐hospital mortality in patients with Covid‐19. J Thromb Haemost. 2020;18:1324‐1329. [DOI] [PMC free article] [PubMed] [Google Scholar]
- 27. Dong Y, Zhou H, Li M, et al. A novel simple scoring model for predicting severity of patients with SARS‐CoV‐2 infection. Transbound Emerg Dis. 2020;67:2823‐2829. [DOI] [PMC free article] [PubMed] [Google Scholar]


