

Abstract
Background
The coronavirus disease 2019 (COVID‐19) has a tremendous influence in general public's behaviors; however, changes in the status of regularly scheduled outpatient visits in Japan during COVID‐19 pandemic are still unknown.
Methods
This cross‐sectional study was conducted in May 2020. Participants were recruited by an Internet‐based survey company. A total of 659 patients (54% male, average age 60 ± 14 years) who had regularly scheduled outpatient visits prior to the onset of COVID‐19 were enrolled. Participants answered four questions (“decrease in medical visit frequency,” “inability to take regular medication,” “deterioration of a chronic disease,” and “utilization of telephone/online medical care”) and stated whether they had a fear of acquiring infection at a medical facility. The associations between answers, fear of infection, and socio‐demographic factors were examined.
Results
Among the participants, 37.8% had decreased their medical visits, 6.8% were unable to take regular medications, 5.6% experienced a deterioration of chronic disease, and 9.1% utilized telephone/online medical care. Fear of being infected by COVID‐19 at medical facilities was strongly associated with a reduced frequency of medical visits and lack of regular medications even after adjusting for socio‐demographic factors and current medical histories.
Conclusions
During the first wave of COVID‐19, approximately 40% of participants reduced their frequency of medical visits. It is important to continue implementing thorough infection control measures at facilities and educating the public the importance of keeping chronic diseases in good condition, as well as promoting telephone/online medical care.
Keywords: COVID‐19, decrease in medical visit frequency, fear of infection at medical facilities, inability to take regular medications, utilization of telephone/online medical care
We conducted an Internet survey of 2,400 Japanese men and women in May 2020 and analyzed changes in the medical visit behavior/status of 659 people who had regularly visited to medical institutions before the coronavirus disease 2019 pandemic. Among the participants, 37.8% had decreased their medical visits, 6.8% were unable to take regular medications, 5.6% experienced a deterioration of chronic disease, and 9.1% utilized telephone/online medical care.
![]()
1. INTRODUCTION
The coronavirus disease 2019 (COVID‐19) epidemic has become a global challenge. Because of the nationwide spread of COVID‐19 infections and the increasing number of deaths,1, 2 a state of emergency was declared in April 2020 by the Japanese Ministry of Health, Labor and Welfare (JMHLW). As COVID‐19 spreads, there have been clusters of COVID‐19 reported at medical facilities,3 and patients have refrained from visiting them. Under the current circumstances, even though many citizens practice infection prevention measures, COVID‐19 cases are not decreasing.
Studies have shown that COVID‐19 is more serious in the elderly and those with hypertension, diabetes, heart disease, chronic respiratory disease, and cancer.4, 5, 6, 7, 8, 9 Therefore, it is particularly important that these patients keep their diseases under control to prevent death. During the COVID‐19 pandemic, the number of outpatient visits at many medical facilities decreased, according to aggregated data from outpatient billing receipts.10 Changes in the medical treatment status of Japanese outpatients (decrease in visit frequency, inability to take regular medications, and deterioration of chronic disease) and socio‐demographic factors that influenced outpatient status are not well understood. Therefore, this study was conducted to examine changes in the treatment behavior and health status of patients undergoing regular outpatient visits and to identify the factors that influenced those behaviors during the COVID‐19 pandemic.
2. MATERIALS AND METHODS
2.1. Study design and subjects
This study was a cross‐sectional study utilizing the data obtained for some studies,11, 12, 13 which has been conducted to examine the influence of the COVID‐19 on general Japanese population. Participants were recruited from a Japanese Internet‐based survey company that has approximately 1.12 million registrants as of January 2020. We collected data from 2400 people aged 20‐79 years (sampling by gender and 10‐year age group; 12 groups, n = 200 in each group) who were living in the Tokyo metropolitan area. The company randomly chosen potential respondents from the registrants. The number of potential respondents in each stratified sample group was determined by dividing 200 by the response rate for the corresponding socio‐demographic group. The response rate was then computed based of the results of past surveys conducted by the research company. The company sent an email on February 25, 2020, inviting registrants to participate in the survey (n = 8156).
Survey questions were sent via a URL in an email. Once 200 people in each group responded, we closed the group. The first survey was completed on February 27. Participants were given points equivalent to 50 Japanese yen (JPY) per response. The third survey, which included items regarding the status of outpatient visits, was conducted between May 12 and 17 with 2400 subjects. This third survey was conducted after the state of emergency, that had been declared in seven prefectures on April 7 and was expanded nationwide on April 16,14 was lifted in some prefectures.
In the third survey, we asked participants whether they had had regular outpatient visits before the onset of COVID‐19 (as of fall 2019). Participants who answered “I had regular visits to the hospital outpatient department” or “I had regular visits to the clinic” were included in the study. We excluded respondents who only selected pollinosis (hay fever) from the list of potential current medical conditions, as pollinosis is often treated with over‐the‐counter medication and does not necessarily lead to an outpatient visit. Respondents who were missing socio‐demographic information or whose answers were of suspect accuracy or honesty were also excluded.
2.2. Measurement
Changes in outpatient visit status: We asked participants about the status of their outpatient visits: a decrease in medical visit frequency, an inability to take regular medications, a deterioration of a chronic illness, and utilization of telephone/online medical care (yes/no format).
Fear of being infected at medical facilities: We asked participants if they were afraid of being infected with COVID‐19 at medical facilities (yes / no format).
Assessment of socio‐demographic attributes and lifestyle‐related factors: Gender, age, residential area (Tokyo Metropolis / Tokyo suburbs [Saitama Prefecture / Chiba Prefecture / Kanagawa Prefecture] / Northern Kanto [Gunma Prefecture / Tochigi Prefecture / Ibaraki Prefecture]), marital status (single, divorced, or widowed), living arrangement (alone or with others), education (university graduate or above/high school or below), working status (yes / no format), and annual household income (<5 million JPY / ≥5 million JPY) provided by the research company were used.
Smoking status (smoking / nonsmoking), alcohol consumption (≥3 days per week / <2 days per week), and exercise habits (≥30 minutes of light sweating exercise twice a week / none) were reported. Participants also rated their health (very good, good, not very good, and not good) and reported their current illnesses (hypertension, diabetes, heart disease, stroke, respiratory disease, and cancer).
2.3. Statistical analysis
The prevalence of those who answered yes to 4 medical treatment status, that is, “decrease in medical visit frequency,” “inability to take regular medication,” “deterioration of chronic illness,” and “utilization of telephone/online medical care,” was calculated for each socio‐demographic attribute and compared using the chi‐square test.
Multivariable logistic regression analysis was performed to clarify the factors independently related to the medical treatment situation. The dependent variables were four measurement of medical treatment status. The independent variables of model 1 were gender, age, residential area, marital status, living arrangement, education, working status, annual household income, lifestyle (smoking, alcohol consumption, and exercise habits), self‐rated health, type of medical facility, and fear of being infected at medical facilities. In model 2, in addition to the independent variables in model 1, the presence or absence of a current illness (hypertension, diabetes, heart disease, stroke, respiratory disease, or cancer) (yes/no format) was added. In model 3, in addition to the independent variables discussed in model 2, decrease in medical visit frequency was included as an independent variable.
Statistical analyses were performed using IBM SPSS Statistics for MAC, version 26 (IBM Japan). The significance level was set at P < .05.
3. RESULTS
A total of 877 people met the inclusion criteria of “visited hospitals or clinics” before the fall of 2019. Respondents were excluded as follows: only reporting pollinosis for their current medical history (n = 207), lacking basic information (n = 8), and suspect credibility (n = 3) (specifically, 3 men in their 20s who answered that they had a history of ≥4 diseases when asked about their current medical history; the validity of the data was judged to be low by two researchers independently). As a result, 659 people (75.1%) were included in the study (Figure 1).
FIGURE 1.
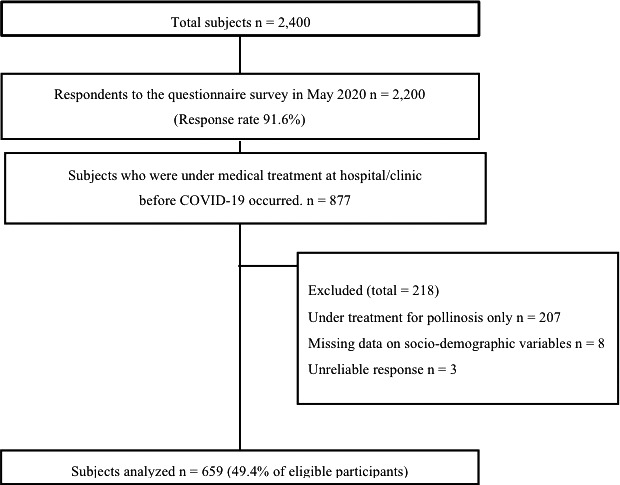
Participant flow
Table 1 shows the socio‐demographic characteristics of the participants. In total, 54.2% of the participants were male. Sixty‐one percentage of the participants were 60‐79 years, 33.8% lived in the Tokyo Metropolis. The location of visits was divided fairly equally between hospitals (55.8%) and clinics (44.2%). Three‐quarters (75.3%) of the respondents answered that they were afraid of being infected with COVID‐19 at a medical facility.
TABLE 1.
Participant characteristics (n = 659)
| n | % | |
|---|---|---|
| Gender | ||
| Male | 357 | 54.2 |
| Female | 302 | 45.8 |
| Age (years) | ||
| 20‐39 | 82 | 12.4 |
| 40‐59 | 174 | 26.4 |
| 60‐79 | 403 | 61.1 |
| Residential area | ||
| Tokyo Metropolis | 223 | 33.8 |
| Tokyo suburbsa | 360 | 54.6 |
| Northern Kantob | 76 | 11.5 |
| Marital status | ||
| Married | 452 | 68.6 |
| Single, divorced, widowed | 207 | 31.4 |
| Living arrangement | ||
| Living alone | 113 | 17.1 |
| Living with others | 546 | 82.9 |
| Education | ||
| University graduate or above | 350 | 53.1 |
| Less than junior college graduate | 309 | 46.9 |
| Working status | ||
| Yes | 336 | 51.0 |
| No | 323 | 49.0 |
| Annual household income | ||
| Less than 5 million JPY | 329 | 49.9 |
| More than 5 million JPY | 330 | 50.1 |
| Smoking status | ||
| Smoker | 104 | 15.8 |
| Nonsmoker or ex‐smoker | 555 | 84.2 |
| Alcohol consumption | ||
| More than 3 d/wk | 235 | 35.7 |
| Less than 3 d/wk | 424 | 64.3 |
| Exercise habitsc | ||
| Yes | 244 | 37.0 |
| No | 415 | 63.0 |
| Self‐rated health | ||
| Good, very good | 526 | 79.8 |
| Not very well, not good | 133 | 20.1 |
| Type of medical facilities participants were visiting | ||
| Hospital | 368 | 55.8 |
| Clinic | 291 | 44.2 |
| Fear of infection at medical facilities | ||
| Yes | 496 | 75.3 |
| No | 163 | 24.7 |
| Current medical histories | ||
| Hypertension | 324 | 49.2 |
| Diabetes | 104 | 15.8 |
| Heart disease | 53 | 8.00 |
| Stroke | 14 | 2.10 |
| Respiratory disease | 58 | 8.80 |
| Cancer | 36 | 5.50 |
| Others / None of above | 217 | 31.7 |
Tokyo suburbs include Saitama, Chiba, and Kanagawa prefecture.
Northern Kanto includes Gunma, Tochigi, and Ibaraki prefecture.
Exercise habits are defined as participating light sweating exercise regularly 3 times a week.
Treatment‐related behavior and status of all participants are shown in Table 2. A decrease in medical visit frequency was reported by 37.8%, but an inability to take regular medication was reported by only 6.8% of participants and deterioration of a chronic illness by 5.6%. Furthermore, 9.1% utilized telephone/online medical care.
TABLE 2.
Treatment‐related behavior/status (n = 659)
| n | % | |
|---|---|---|
| Decrease in medical visit frequency | 249 | 37.8 |
| Inability to take regular medication | 45 | 6.8 |
| Deterioration of chronic disease | 37 | 5.6 |
| Utilization of telephone/online medical care | 60 | 9.1 |
The status of medical visits/behaviors by socio‐demographic factors is presented in Table 3.
TABLE 3.
Prevalence of treatment‐related behaviors and status by socio‐demographic and lifestyle‐related factors
| Decrease in medical visit frequency | Inability to take regular medication | Deterioration of chronic disease | Utilization of telephone/online medical care | ||||||||||
|---|---|---|---|---|---|---|---|---|---|---|---|---|---|
| n | % | P‐value* | n | % | P‐value* | n | % | P‐value* | n | % | P‐value* | ||
| (n = 659) | 249 | 37.8 | 45 | 6.8 | 37 | 5.6 | 60 | 9.1 | |||||
| Gender | |||||||||||||
| Female | 302 | 135 | 44.7 | <.001 | 20 | 6.6 | .847 | 20 | 6.6 | .301 | 30 | 9.9 | .496 |
| Male | 357 | 114 | 31.9 | 25 | 7.0 | 17 | 4.8 | 30 | 8.4 | ||||
| Age (years) | |||||||||||||
| 20‐39 | 82 | 37 | 45.1 | .218 | 13 | 15.9 | .001 | 12 | 14.6 | <.001 | 11 | 13.4 | .017 |
| 40‐59 | 174 | 69 | 39.7 | 14 | 8.0 | 15 | 8.6 | 7 | 4.0 | ||||
| 60‐79 | 403 | 143 | 35.5 | 18 | 4.5 | 10 | 2.5 | 42 | 10.4 | ||||
| Residential area | |||||||||||||
| Tokyo Metropolis | 223 | 97 | 43.5 | .035 | 16 | 7.2 | .603 | 15 | 6.7 | .202 | 26 | 11.7 | .244 |
| Tokyo suburbsa | 360 | 131 | 36.4 | 22 | 6.1 | 21 | 5.8 | 29 | 8.1 | ||||
| Northern Kantob | 76 | 21 | 27.6 | 7 | 9.2 | 1 | 1.3 | 5 | 6.6 | ||||
| Marital status | |||||||||||||
| Married | 452 | 177 | 39.2 | .282 | 32 | 7.1 | .706 | 22 | 4.9 | .218 | 43 | 9.5 | .590 |
| Single, divorced, widowed | 207 | 72 | 34.8 | 13 | 6.3 | 15 | 7.2 | 17 | 8.2 | ||||
| Living arrangement | |||||||||||||
| Living alone | 113 | 44 | 38.9 | .781 | 6 | 5.3 | .482 | 9 | 8.0 | .233 | 12 | 10.6 | .539 |
| Living with others | 546 | 205 | 37.5 | 39 | 7.1 | 28 | 5.1 | 48 | 8.8 | ||||
| Education | |||||||||||||
| University graduate or above | 350 | 131 | 37.4 | .841 | 26 | 7.4 | .516 | 18 | 5.1 | .576 | 33 | 9.4 | .758 |
| Less than junior college graduate | 309 | 118 | 38.2 | 19 | 6.1 | 19 | 6.1 | 27 | 8.7 | ||||
| Working status | |||||||||||||
| Yes | 336 | 125 | 37.2 | .753 | 29 | 8.6 | .061 | 24 | 7.1 | .082 | 25 | 7.4 | .130 |
| No | 323 | 124 | 38.4 | 16 | 5.0 | 13 | 4.0 | 35 | 10.8 | ||||
| Annual household income | |||||||||||||
| Less than 5 million JPY | 329 | 114 | 34.7 | .098 | 20 | 6.1 | .446 | 16 | 4.9 | .403 | 31 | 9.4 | .777 |
| More than 5 million JPY | 330 | 135 | 40.9 | 25 | 7.6 | 21 | 6.4 | 29 | 8.8 | ||||
| Smoking status | |||||||||||||
| Smoker | 104 | 36 | 34.6 | .468 | 11 | 10.6 | .099 | 9 | 8.7 | .142 | 7 | 6.7 | .359 |
| Nonsmoker or ex‐smoker | 555 | 213 | 38.4 | 34 | 6.1 | 28 | 5.0 | 53 | 9.5 | ||||
| Alcohol consumption | |||||||||||||
| More than 3days / week | 235 | 92 | 39.1 | .591 | 17 | 7.2 | .759 | 8 | 3.4 | .067 | 24 | 10.2 | .462 |
| Less than 3days / week | 424 | 157 | 37.0 | 28 | 6.6 | 29 | 6.8 | 36 | 8.5 | ||||
| Exercise habitsc | |||||||||||||
| Yes | 244 | 96 | 39.3 | .527 | 16 | 6.6 | .832 | 13 | 5.3 | .806 | 35 | 14.3 | <.001 |
| No | 415 | 153 | 36.9 | 29 | 7.0 | 24 | 5.8 | 25 | 6.0 | ||||
| Self‐rated health | |||||||||||||
| Very good, good | 526 | 191 | 36.3 | .121 | 37 | 7.0 | .677 | 17 | 3.2 | <.001 | 50 | 9.5 | .477 |
| Somehow no good, no good | 133 | 58 | 43.6 | 8 | 6.0 | 20 | 15.0 | 10 | 7.5 | ||||
| Type of medical facilities participants were visiting | |||||||||||||
| Hospital | 368 | 129 | 35.1 | .104 | 27 | 7.3 | .561 | 27 | 7.3 | .031 | 39 | 10.6 | .134 |
| Clinic | 291 | 120 | 41.2 | 18 | 6.2 | 10 | 3.4 | 21 | 7.2 | ||||
| Fear of infection at medical facilities | |||||||||||||
| Yes | 496 | 220 | 44.4 | <.001 | 42 | 8.5 | .004 | 28 | 5.6 | .953 | 51 | 10.3 | .067 |
| No | 163 | 29 | 17.8 | 3 | 1.8 | 9 | 5.5 | 9 | 5.5 | ||||
| Current medical histories | |||||||||||||
| Hypertension | |||||||||||||
| + | 324 | 109 | 33.6 | .031 | 15 | 4.6 | .028 | 16 | 4.9 | .458 | 29 | 9.0 | .892 |
| − | 335 | 140 | 41.8 | 30 | 9.0 | 21 | 6.3 | 31 | 9.3 | ||||
| Diabetes | |||||||||||||
| + | 104 | 34 | 32.7 | .243 | 7 | 6.7 | .966 | 4 | 3.8 | .393 | 9 | 8.7 | .862 |
| − | 555 | 215 | 38.7 | 38 | 6.8 | 33 | 5.9 | 51 | 9.2 | ||||
| Heart disease | |||||||||||||
| + | 53 | 14 | 26.4 | .075 | 1 | 1.9 | .105 | 4 | 7.5 | .346 | 7 | 13.2 | .197 |
| − | 606 | 235 | 38.8 | 44 | 7.3 | 33 | 5.4 | 53 | 8.7 | ||||
| Stroke | |||||||||||||
| + | 14 | 4 | 28.6 | .472 | 1 | 7.1 | .632 | 2 | 14.3 | .183 | 1 | 7.1 | .631 |
| − | 645 | 245 | 38.0 | 44 | 6.8 | 35 | 5.4 | 59 | 9.1 | ||||
| Respiratory disease | |||||||||||||
| + | 58 | 29 | 50.0 | .045 | 6 | 10.3 | .195 | 5 | 8.6 | .218 | 4 | 6.9 | .540 |
| − | 601 | 220 | 36.6 | 39 | 6.5 | 32 | 5.3 | 56 | 9.3 | ||||
| Cancer | |||||||||||||
| + | 36 | 9 | 25.0 | .104 | 1 | 2.8 | .277 | 2 | 5.6 | .671 | 4 | 11.1 | .419 |
| − | 623 | 240 | 38.5 | 44 | 7.1 | 35 | 5.6 | 56 | 9.0 | ||||
Tokyo suburbs include Saitama, Chiba, and Kanagawa prefecture.
Northern Kanto includes Gunma, Tochigi, and Ibaraki prefecture.
Exercise habits are defined as participating light sweating exercise regularly 3 times a week.
P‐value was calculated by chi‐square test.
The rate of “decrease in medical visit frequency” was significantly different by gender (P < .001), residential area (P = .035), presence or absence fear of being infected at medical facilities (P < .001), presence or absence of hypertension (P = .031), and respiratory illness (P = .045). The rate of “decrease in medical visit frequency” was higher among women, respondents living in the Tokyo Metropolis, respondents with a fear of being infected at medical facilities, respondents without current hypertension, and respondents with respiratory illness.
The rate of “inability to take regular medication” was significantly different with age (P = .001), presence or absence of fear of being infected at medical facilities (P = .004), and the presence or absence of hypertension (P = .028). The rate of “inability to take regular medication” was highest in respondents aged 20‐30 years, respondents who were afraid of being infected at medical facilities, and respondents without hypertension. The rate of “deterioration of chronic illness” was highest in respondents aged 20‐30 years, respondents whose self‐rated health was poor (P < .001), and respondents who regularly visited the hospital (P = .031). The rate of utilization of telephone/online medical care was significantly higher in participants aged 20‐30 years (P = .017) and those who regularly exercised (P < .001).
The factors related to “decrease in medical visit frequency” and “inability to take regular medication” are shown in Table 4A. In model 1, females (odds ratio [OR] = 1.73; 95% confidence interval [CI] = 1.16‐2.57; P = .007), respondents aged 20‐30 years (OR = 1.93; 95% CI = 1.08‐3.46; P = .027), respondents living in the Tokyo Metropolis (OR = 2.12; 95% CI = 1.14‐3.95; P = .018), respondents who were married (OR = 1.69; 95% CI = 1.00‐2.86; P = .049), respondents whose self‐rated health was poor (OR = 1.71; 95% CI = 1.10‐2.65; P = .017), and respondents who were afraid of being infected at medical facilities were significantly more likely to report a “decrease in medical visit frequency.” Even in model 2, which adjusted for the presence or absence of current medical conditions, all covariates except for age were significantly associated with a decreased frequency of visits.
TABLE 4.
Factors related to treatment‐related behavior/status—Results of multiple logistic regression analyses
| (A) | Decrease in medical visit frequency | Inability to take regular medication | ||||||||||||||
|---|---|---|---|---|---|---|---|---|---|---|---|---|---|---|---|---|
| Model 1a | Model 2b | Model 1a | Model 2b | Model 3c | ||||||||||||
| OR | 95%CI | P‐value* | OR | 95%CI | P‐value* | OR | 95%CI | P‐value* | OR | 95%CI | P‐value* | OR | 95%CI | P‐value* | ||
| Gender | ||||||||||||||||
| Female | 1.78 | (1.21‐2.61) | .003 | 1.73 | (1.16‐2.57) | .007 | 0.91 | (0.45‐1.85) | .798 | 0.91 | (0.44‐1.88) | .793 | 0.76 | (0.34‐1.67) | .490 | |
| Male (ref) | 1.00 | 1.00 | 1.00 | 1.00 | 1.00 | |||||||||||
| Age (years) | ||||||||||||||||
| 20‐39 | 1.93 | (1.08‐3.46) | .027 | 1.61 | (0.86‐3.00) | .135 | 4.80 | (1.90‐12.2) | .001 | 4.03 | (1.48‐11.0) | .007 | 3.49 | (1.16‐10.5) | .027 | |
| 40‐59 | 1.51 | (0.97‐2.34) | .070 | 1.37 | (0.87‐2.17) | .176 | 2.22 | (0.97‐5.10) | .061 | 1.98 | (0.84‐4.68) | .121 | 1.83 | (0.73‐4.59) | .196 | |
| 60‐79 (ref) | 1.00 | 1.00 | 1.00 | 1.00 | 1.00 | |||||||||||
| Residential area | ||||||||||||||||
| Tokyo Metropolis | 2.09 | (1.14‐3.86) | .018 | 2.12 | (1.14‐3.95) | .018 | 0.75 | (0.28‐2.03) | .575 | 0.79 | (0.29‐2.16) | .640 | 0.53 | (0.17‐1.66) | .275 | |
| Tokyo suburbs | 1.50 | (0.83‐2.70) | .177 | 1.45 | (0.80‐2.62) | .225 | 0.63 | (0.25‐1.64) | .347 | 0.62 | (0.24‐1.62) | .330 | 0.50 | (0.17‐1.48) | .210 | |
| Northern Kanto (ref) | 1.00 | 1.00 | 1.00 | 1.00 | 1.00 | |||||||||||
| Marital status | ||||||||||||||||
| Married | 1.66 | (0.99‐2.78) | .055 | 1.69 | (1.00‐2.86) | .049 | 1.49 | (0.59‐3.76) | .402 | 1.56 | (0.60‐4.06) | .361 | 0.97 | (0.34‐2.75) | .957 | |
| Single, divorced, widowed (ref) | 1.00 | 1.00 | 1.00 | 1.00 | 1.00 | |||||||||||
| Living arrangement | ||||||||||||||||
| Living alone | 1.69 | (0.91‐3.12) | .095 | 1.66 | (0.89‐3.10) | .109 | 0.74 | (0.22‐2.44) | .615 | 0.76 | (0.22‐2.57) | .657 | 0.40 | (0.11‐1.51) | .179 | |
| Living with others (ref) | 1.00 | 1.00 | 1.00 | 1.00 | 1.00 | |||||||||||
| Education | ||||||||||||||||
| University graduate or above | 1.02 | (0.71‐1.48) | .898 | 1.03 | (0.71‐1.50) | .877 | 1.06 | (0.53‐2.14) | .869 | 1.11 | (0.55‐2.23) | .781 | 1.09 | (0.52‐2.29) | .821 | |
| Less than junior college graduate (ref) | 1.00 | 1.00 | 1.00 | 1.00 | 1.00 | |||||||||||
| Working status | ||||||||||||||||
| Yes | 1.03 | (0.63‐1.69) | .895 | 1.00 | (0.61‐1.64) | .992 | 1.90 | (0.85‐4.22) | .116 | 1.83 | (0.82‐4.08) | .138 | 1.28 | (0.56‐2.94) | .555 | |
| No (ref) | 1.00 | 1.00 | 1.00 | 1.00 | 1.00 | |||||||||||
| Annual household income | ||||||||||||||||
| Less than 5 million JPY | 0.72 | (0.50‐1.04) | .080 | 0.72 | (0.49‐1.05) | .084 | 1.08 | (0.53‐2.22) | .830 | 1.09 | (0.53‐2.23) | .825 | 1.33 | (0.60‐2.93) | .486 | |
| More than 5 million JPY (ref) | 1.00 | 1.00 | 1.00 | 1.00 | 1.00 | |||||||||||
| Smoking status | ||||||||||||||||
| Smoker | 1.28 | (0.89‐1.84) | .181 | 1.27 | (0.88‐1.84) | .196 | 1.11 | (0.56‐2.18) | .763 | 1.13 | (0.57‐2.23) | .731 | 1.83 | (0.72‐4.63) | .203 | |
| Nonsmoker or ex‐smoker (ref) | 1.00 | 1.00 | 1.00 | 1.00 | 1.00 | |||||||||||
| Alcohol consumption | ||||||||||||||||
| More than 3days / week | 1.17 | (0.82‐1.68) | .378 | 1.18 | (0.82‐1.70) | .363 | 0.92 | (0.47‐1.80) | .806 | 0.92 | (0.46‐1.82) | .803 | 0.90 | (0.43‐1.90) | .788 | |
| Less than 3days / week (ref) | 1.00 | 1.00 | 1.00 | 1.00 | 1.00 | |||||||||||
| Exercise habits | ||||||||||||||||
| Yes | 0.96 | (0.64‐1.44) | .847 | 0.95 | (0.64‐1.43) | .822 | 1.20 | (0.56‐2.59) | .639 | 1.19 | (0.54‐2.62) | .668 | 0.70 | (0.33‐1.50) | .366 | |
| No (ref) | 1.00 | 1.00 | 1.00 | 1.00 | 1.00 | |||||||||||
| Self‐rated health | ||||||||||||||||
| Not very well, not good | 1.62 | (1.06‐2.48) | .027 | 1.71 | (1.10‐2.65) | .017 | 0.93 | (0.40‐2.15) | .862 | 0.96 | (0.41‐2.26) | .929 | 0.59 | (0.23‐1.54) | .280 | |
| Good, very good (ref) | 1.00 | 1.00 | 1.00 | 1.00 | 1.00 | |||||||||||
| Type of medical facilities participants were visiting | ||||||||||||||||
| Hospital | 0.75 | (0.53‐1.05) | .091 | 0.80 | (0.57‐1.14) | .213 | 1.10 | (0.58‐2.10) | .768 | 1.20 | (0.62‐2.33) | .581 | 1.42 | (0.7‐2.9) | .332 | |
| Clinic (ref) | 1.00 | 1.00 | 1.00 | 1.00 | 1.00 | |||||||||||
| Fear of infection at medical facilities | ||||||||||||||||
| Yes | 4.00 | (2.52‐6.36) | <.001 | 3.92 | (2.46‐6.25) | <.001 | 6.23 | (1.85‐20.9) | .003 | 6.16 | (1.83‐20.8) | .003 | 3.39 | (0.89‐12.84) | .073 | |
| No (ref) | 1.00 | 1.00 | 1.00 | 1.00 | 1.00 | |||||||||||
| Current medical histories | ||||||||||||||||
| Hypertension | ||||||||||||||||
| + | 0.84 | (0.58‐1.22) | .365 | 0.69 | (0.33‐1.43) | .316 | 0.73 | (0.33‐1.61) | .432 | |||||||
| − (ref) | 1.00 | 1.00 | 1.00 | |||||||||||||
| Diabetes | ||||||||||||||||
| + | 0.98 | (0.60‐1.63) | .948 | 1.45 | (0.57‐3.70) | .432 | 1.75 | (0.61‐5.01) | .297 | |||||||
| − (ref) | 1.00 | 1.00 | 1.00 | |||||||||||||
| Heart disease | ||||||||||||||||
| + | 0.53 | (0.26‐1.07) | .075 | 0.27 | (0.03‐2.14) | .214 | 0.40 | (0.05‐3.57) | .413 | |||||||
| − (ref) | 1.00 | 1.00 | 1.00 | |||||||||||||
| Stroke | ||||||||||||||||
| + | 0.88 | (0.26‐3.02) | .841 | 1.32 | (0.15‐11.2) | .802 | 1.99 | (0.19‐21.11) | .569 | |||||||
| − (ref) | 1.00 | 1.00 | 1.00 | |||||||||||||
| Respiratory disease | ||||||||||||||||
| + | 1.46 | (0.81‐2.65) | .212 | 1.60 | (0.60‐4.26) | .349 | 1.59 | (0.55‐4.63) | .393 | |||||||
| − (ref) | 1.00 | 1.00 | 1.00 | |||||||||||||
| Cancer | ||||||||||||||||
| + | 0.51 | (0.22‐1.19) | .121 | 0.52 | (0.07‐4.10) | .534 | 0.79 | (0.09‐6.96) | .831 | |||||||
| − (ref) | 1.00 | 1.00 | 1.00 | |||||||||||||
| Decrease in medical visit frequency | ||||||||||||||||
| Yes | 28.5 | (8.31‐97.56) | <.001 | |||||||||||||
| No (ref) | 1.00 | |||||||||||||||
| (B) | Deterioration of chronic disease | Utilization of telephone/online medical care | ||||||||||||||
|---|---|---|---|---|---|---|---|---|---|---|---|---|---|---|---|---|
| Model 1a | Model 2b | Model 3c | Model 1a | Model 2b | ||||||||||||
| OR | 95%CI | p‐value* | OR | 95%CI | P‐value* | OR | 95%CI | P‐value* | OR | 95%CI | P‐value* | OR | 95%CI | P‐value* | ||
| Gender | ||||||||||||||||
| Female | 1.59 | (0.72‐3.54) | .255 | 1.68 | (0.73‐3.87) | .225 | 1.57 | (0.67‐3.67) | .298 | 1.26 | (0.68‐2.36) | .464 | 1.28 | (0.67‐2.47) | .459 | |
| Male (ref) | 1.00 | 1.00 | 1.00 | 1.00 | 1.00 | |||||||||||
| Age (years) | ||||||||||||||||
| 20–39 | 5.79 | (1.99‐16.8) | .001 | 7.18 | (2.21‐23.3) | .001 | 6.92 | (2.12‐22.6) | .001 | 1.75 | (0.74‐4.15) | .203 | 1.83 | (0.72‐4.69) | .206 | |
| 40–59 | 2.85 | (1.08‐7.57) | .035 | 3.00 | (1.10‐8.22) | .032 | 2.86 | (1.04‐7.87) | .042 | 0.45 | (0.18‐1.11) | .082 | 0.45 | (0.18‐1.14) | .093 | |
| 60–79 (ref) | 1.00 | 1.00 | 1.00 | 1.00 | 1.00 | |||||||||||
| Residential area | ||||||||||||||||
| Tokyo Metropolis | 4.41 | (0.54‐36.3) | .167 | 4.93 | (0.58‐41.6) | .143 | 4.00 | (0.47‐33.8) | .203 | 2.00 | (0.71‐5.69) | .192 | 1.99 | (0.69‐5.68) | .201 | |
| Tokyo suburbs | 3.91 | (0.49‐31.2) | .198 | 4.53 | (0.55‐37.2) | .159 | 3.97 | (0.48‐32.6) | .199 | 1.28 | (0.46‐3.57) | .635 | 1.28 | (0.46‐3.60) | .639 | |
| Northern Kanto (ref) | 1.00 | 1.00 | 1.00 | 1.00 | 1.00 | |||||||||||
| Marital status | ||||||||||||||||
| Married | 1.41 | (0.52‐3.84) | .506 | 1.37 | (0.50‐3.79) | .540 | 1.31 | (0.47‐3.64) | .610 | 1.49 | (0.59‐3.72) | .399 | 1.45 | (0.58‐3.61) | .429 | |
| Single, divorced, widowed (ref) | 1.00 | 1.00 | 1.00 | 1.00 | 1.00 | |||||||||||
| Living arrangement | ||||||||||||||||
| Living alone | 1.40 | (0.42‐4.59) | .584 | 1.36 | (0.41‐4.59) | .617 | 1.33 | (0.39‐4.48) | .651 | 1.91 | (0.69‐5.29) | .216 | 1.90 | (0.68‐5.29) | .223 | |
| Living with others (ref) | 1.00 | 1.00 | 1.00 | 1.00 | 1.00 | |||||||||||
| Education | ||||||||||||||||
| University graduate or above | 0.66 | (0.30‐1.47) | .313 | 0.67 | (0.30‐1.52) | .340 | 0.62 | (0.27‐1.43) | .266 | 1.01 | (0.55‐1.85) | .984 | 0.99 | (0.54‐1.84) | .979 | |
| Less than junior college graduate (ref) | 1.00 | 1.00 | 1.00 | 1.00 | 1.00 | |||||||||||
| Working status | ||||||||||||||||
| Yes | 1.95 | (0.78‐4.88) | .152 | 2.14 | (0.84‐5.44) | .109 | 1.61 | (0.63‐4.09) | .318 | 0.70 | (0.29‐1.70) | .431 | 0.71 | (0.29‐1.72) | .445 | |
| No (ref) | 1.00 | 1.00 | 1.00 | 1.00 | 1.00 | |||||||||||
| Annual household income | ||||||||||||||||
| Less than 5 million JPY | 0.69 | (0.30‐1.60) | .386 | 0.72 | (0.31‐1.70) | .452 | 0.76 | (0.32‐1.79) | .526 | 0.95 | (0.51‐1.74) | .859 | 0.92 | (0.50‐1.70) | .789 | |
| More than 5 million JPY (ref) | 1.00 | 1.00 | 1.00 | 1.00 | 1.00 | |||||||||||
| Smoking status | ||||||||||||||||
| Smoker | 0.58 | (0.24‐1.39) | .217 | 0.58 | (0.24‐1.40) | .223 | 2.26 | (0.87‐5.85) | .093 | 1.34 | (0.75‐2.41) | .322 | 1.36 | (0.75‐2.45) | .308 | |
| Nonsmoker or ex‐smoker (ref) | 1.00 | 1.00 | 1.00 | 1.00 | 1.00 | |||||||||||
| Alcohol consumption | ||||||||||||||||
| More than 3 d/wk | 1.53 | (0.69‐3.43) | .298 | 1.59 | (0.70‐3.61) | .264 | 0.55 | (0.22‐1.35) | .190 | 2.60 | (1.47‐4.62) | .001 | 2.64 | (1.47‐4.72) | .001 | |
| Less than 3 d/wk (ref) | 1.00 | 1.00 | 1.00 | 1.00 | 1.00 | |||||||||||
| Exercise habits | ||||||||||||||||
| Yes | 1.54 | (0.63‐3.78) | .346 | 1.64 | (0.65‐4.10) | .294 | 1.43 | (0.62‐3.28) | .401 | 0.77 | (0.40‐1.49) | .431 | 0.76 | (0.39‐1.49) | .423 | |
| No (ref) | 1.00 | 1.00 | 1.00 | 1.00 | 1.00 | |||||||||||
| Self‐rated health | ||||||||||||||||
| Not very well, not good | 6.21 | (2.86‐13.5) | < .001 | 5.71 | (2.57‐12.7) | <.001 | 5.19 | (2.31‐11.7) | <.001 | 0.89 | (0.42‐1.88) | .764 | 0.88 | (0.41‐1.88) | .736 | |
| Good, very good (ref) | 1.00 | 1.00 | 1.00 | 1.00 | 1.00 | |||||||||||
| Type of medical facilities participants were visiting | ||||||||||||||||
| Hospital | 1.62 | (0.74‐3.58) | .230 | 1.52 | (0.67‐3.42) | .317 | 1.62 | (0.71‐3.68) | .249 | 1.82 | (1.02‐3.24) | .043 | 1.79 | (0.99‐3.23) | .054 | |
| Clinic (ref) | 1.00 | 1.00 | 1.00 | 1.00 | 1.00 | |||||||||||
| Fear of infection at medical facilities | ||||||||||||||||
| Yes | 1.51 | (0.64‐3.55) | .349 | 1.56 | (0.64‐3.78) | .327 | 1.16 | (0.46‐2.93) | .755 | 1.77 | (0.82‐3.80) | .144 | 1.77 | (0.82‐3.79) | .146 | |
| No (ref) | 1.00 | 1.00 | 1.00 | 1.00 | 1.00 | |||||||||||
| Current medical histories | ||||||||||||||||
| Hypertension | ||||||||||||||||
| + | 1.55 | (0.67‐3.56) | .304 | 1.63 | (0.71‐3.75) | .253 | 0.99 | (0.53‐1.83) | .961 | |||||||
| − (ref) | 1.00 | 1.00 | 1.00 | |||||||||||||
| Diabetes | ||||||||||||||||
| + | 0.72 | (0.20‐2.61) | .621 | 0.72 | (0.20‐2.62) | .615 | 0.99 | (0.44‐2.23) | .975 | |||||||
| − (ref) | 1.00 | 1.00 | 1.00 | |||||||||||||
| Heart disease | ||||||||||||||||
| + | 1.60 | (0.44‐5.73) | .474 | 1.88 | (0.53‐6.74) | .332 | 1.49 | (0.60‐3.71) | .389 | |||||||
| − (ref) | 1.00 | 1.00 | 1.00 | |||||||||||||
| Stroke | ||||||||||||||||
| + | 2.15 | (0.32‐15.0) | .430 | 2.04 | (0.30‐13.7) | .465 | 1.04 | (0.12‐9.07) | .970 | |||||||
| − (ref) | 1.00 | 1.00 | 1.00 | |||||||||||||
| Respiratory disease | ||||||||||||||||
| + | 1.51 | (0.50‐4.58) | .464 | 1.37 | (0.44‐4.26) | .591 | 0.61 | (0.20‐1.88) | .390 | |||||||
| − (ref) | 1.00 | 1.00 | 1.00 | |||||||||||||
| Cancer | ||||||||||||||||
| + | 1.45 | (0.28‐7.49) | .654 | 1.59 | (0.30‐8.33) | .586 | 1.07 | (0.33‐3.44) | .914 | |||||||
| − (ref) | 1.00 | 1.00 | 1.00 | |||||||||||||
| Decrease in medical visit frequency | ||||||||||||||||
| Yes | 2.26 | (1.01‐5.04) | .047 | |||||||||||||
| No (ref) | 1.00 | |||||||||||||||
Independent variables of model 1 were gender, age, residential area, marital status, living arrangement, education, working status, annual household income, lifestyle (smoking status, alcohol consumption, and exercise habits), self‐reported health, type of medical facility participants were visiting, and fear of being infected at medical facilities.
In model 2, in addition to the independent variables discussed in model 1, the presence or absence of a current illness (hypertension, diabetes, heart disease, stroke, respiratory disease, and cancer) was input as an independent variables.
In model 3, in addition to the independent variables discussed in model 2, decrease in visit frequency was input as an independent variable.
P‐value was calculated by a multivariable logistic regression analysis.
Respondents aged 20‐30 years (OR = 4.03; 95% CI = 1.48‐11.0; P = .007) and who were afraid of being infected at medical facilities (OR = 6.16; 95% CI = 1.83‐20.8; P = .003) were significantly more likely to report an “inability to take regular medication.”
Respondents aged 20‐30 years (OR = 7.18; 95% CI = 2.21‐23.3; P = .001), those aged 40‐50 years (OR = 3.00; 95% CI = 1.10‐8.22; P = .032), and those whose self‐rated health was poor (OR = 5.71; 95% CI = 2.57‐12.67; P < .001) were significantly more likely to report a “deterioration of chronic disease” (Table 4B).
In the results of model 3, "inability to take regular medication" and "worsening of chronic disease" were significantly associated with "decrease in medical visit frequency" (OR = 28.5; 95% CI = 8.31‐97.56; P < .001, OR = 2.26; 95% CI = 1.01‐5.04; P = .047, respectively) (Table 4A,B).
Respondents whose visiting medical institution was a hospital (OR = 1.79; 95% CI = 0.99‐3.23; P = .054) had a nonsignificantly higher tendency to use telephone/online medical care than those who had visited a clinic.
4. DISCUSSION
Among patients who had regularly scheduled outpatient visits, the proportion of patients who visited less frequently during the first wave of COVID‐19 was high—approximately 40% in the Tokyo metropolitan area. However, fewer than 10% of patients were unable to take their regular medications or reported deterioration in their chronic illnesses. Fear of being infected at medical facilities was strongly associated with a decrease in both visit frequency and an inability to take regular medications.
In this study, which was conducted in May 2020 just before the state of emergency was lifted in all prefectures for the first wave of COVID‐19, we found that the frequency of visits had decreased by 37.8%. We believe that our study is the first to report the degree of decrease in the frequency of medical treatment for those who regularly visit medical facilities. On the basis of the number of billing receipts, the Japanese Ministry of Health, Labor and Welfare (Central Social Insurance Medical Council) reported that the number of outpatient clinic visits in May 2020 was 79% of the previous year.10 Although it is not possible to directly compare the results of these two studies, we considered the following reasons for the discrepancy between the percentages. First, it is possible that the decrease in the frequency of visits in this study can be explained by the inclusion of visits in departments other than the internal medicine department; nationally, decreases in receipt counts have been reported for specific departments such as pediatrics or otolaryngology.10 Second, those who received telephone/online medical care did not go directly to the medical facilities; therefore, they may have reported that their “frequency of visits has decreased.”
Overall, the decrease in medical visit frequency was relatively high at approximately 40%. Furthermore, only about 7% of patients were unable to take regular medications, and only 5.6% reported a deterioration of their illness. Following a Ministry notification15 on February 28 recommending long‐term prescriptions, many doctors may have prevented patients from running out of regular medications by giving long‐term prescriptions. According to an analysis of the Japan Medical Information Research Institute's prescription information database, the average number of prescription days in April and May increased by 18% and 16%, respectively, from the same month of the previous year.16 In each month, the average number of prescription days increased compared with that of the previous year. In general, it cannot be said whether more frequent visits to medical institutions are better, and a decrease in the number of visits is not necessarily judged to be problematic. Particularly, during the COVID‐19 pandemic, it is also important to consider the appropriate use of medical human resources. Adjustment of the medical visit interval between visits as well as utilizing telephone/online visits should be considered for chronic diseases according to the severity of the disease.
The factors associated with a decrease in medical visit frequency during the early wave of COVID‐19 were fear of being infected at medical facilities, residency in the Tokyo Metropolis, self‐rated poor health, and being married. One reason why the fear of being infected at medical facilities was strongly related to the decrease in visit frequency may be that a large cluster of COVID‐19 patients in the inpatient ward of a hospital in Tokyo was widely reported in the news.17 Gender was also significantly associated with a decrease in medical visit frequency. Women were 1.7 times more likely to have fewer medical visits than men. A previous study reported that there was only a slight gender difference in the decrease in visit frequency for patients with medical needs (the rate of decrease in medical visit frequency was 34% for men and 37% for women).18 Various factors may be playing an intertwined role in medical visit frequency. Age (a younger age is correlated with fewer medical visits), economic situation (a younger age and financial distress are correlated with fewer consultations), and time constraints may all affect visit frequency. Given that this study was conducted under the special circumstances of the first wave of COVID‐19, we cannot be sure of the role that COVID‐19 played for women during this period compared with the periods used in previous studies. Women may have been more likely to reduce their medical visit frequency because, at almost all ages, they were more likely than men to fear being infected at medical facilities. We have previously reported that women were significantly more likely than men to implement the five WHO recommendations to prevent COVID‐19 infection.19 Women were also more aware of their hygienic environment and more concerned about infection, thus possibly affecting the frequency of visits. The lower frequency of medical visits and failure to take medication regularly, especially among younger respondents, may have been influenced by the lower severity of their underlying diseases. The finding that living in the Tokyo Metropolis was related to the decrease in visiting frequency is plausible as Tokyo has the country's highest population density and the highest rate of infections.
In previous studies, the elderly and patients with underlying diseases, notably hypertension, diabetes, cardiovascular disease, respiratory disease, and malignant tumors, are at high risk of becoming very ill when infected with COVID‐19.4, 5, 6, 7, 8, 9 In Japan, it was feared that medical visits of the elderly and patients undergoing regular medical treatments for chronic diseases would be greatly affected. However, in our study, elderly respondents (aged 60‐70 years) did not report significant decreases in medical visit frequency, an inability to take regular medications, or a deterioration of chronic illness. Young people aged 20‐30 years were more likely to report an inability to take regular medications. Decrease in medical visit frequency, inability to take regular medication, and deterioration of chronic illness were not associated with any specific diseases.
This study found that patients undergoing regular outpatient visits were “afraid of being infected with COVID‐19 at medical facilities,” and that this was strongly associated with a decrease in medical visit frequency and an inability to take regular medications. To reduce the number of patients who drop out of regular medical visits owing to a fear of being exposed to COVID‐19, it is important to continue implementing thorough infection control measures at medical facilities and to inform patients about these efforts. On the other hand, in the current situation where physical distancing is required, it is also necessary to develop and encourage the use of indirect visiting methods such as telephone and online medical care. Indirect outpatient visits may improve patients’ access to their regular medications and thus prevent deterioration of their chronic illnesses. Although online medical care is not widely used in Japan, international data indicate that the number of patient visits to fever clinics has decreased by 50% since the start of online medical care.20 Introducing online medical care poses a financial burden to provider organizations, but telephone medical care only requires a small investment in new equipment. To prevent the decrease in medical visit frequency and inability to access regular medications for patients who are afraid of being infected at medical facilities, the availability of telephone medical care should be increased prior to the next wave of COVID‐19. The results of this study showed that the hospital‐visiting groups tended to utilize telephone medical care more than the clinic‐visiting groups. There is an opportunity for more telephone medical care in clinics, but it does not allow for physical examinations or bloodwork; therefore, it is necessary to consider further measures to prevent the deterioration of chronic diseases. In the past, doctors were required to be trained before providing online medical care, in accordance with the JMHLW “Guidelines for Proper Implementation of Online Medical Care”.21 However, considering the spread of COVID‐19 in April, even doctors who are not currently taking the course can provide telephone/online medical care. It would be useful to inform medical facilities of this training and encourage doctors to undergo learning opportunities regarding the provision of online medical care.22
The limitations of our study are as follows. First, participants in this study were recruited via an Internet research company and the survey was conducted via email. This may have resulted in selection bias, as the target population was based on people with relatively high IT literacy. Fewer than 10% of respondents reported utilizing telephone or online care; the actual utilization in the general population may be even lower. Furthermore, in this study, “telephone medical care” and “online medical care” were collectively investigated as “telephone/online medical care.” Therefore, it is not possible to discuss the utilization status of telephone medical care and online medical care separately. At the time of the study, online medical care was not widely used in Japan and most of the answers likely reflected telephone medical care.
Second, the participants’ ages were in the 20s to 70s. Although it has been indicated that advanced age is a risk factor for COVID‐19 aggravation, this study could not clarify the outpatient status of elderly people >80 years old.
Third, the evaluation of the deterioration of a chronic disease is self‐reported and may lack objectivity. In addition, this study may have been conducted too early in the course of COVID‐19 to accurately assess the degree of deterioration. Finally, this study was conducted during the first wave of COVID‐19 in Japan. If this study was to be conducted during subsequent waves of COVID‐19, it is unclear whether the results would be the same. It is also unclear whether the results of this study can be applied to patients in different countries.
Despite the above limitations, this study clarified the medical treatment status and related factors of outpatients at risk of COVID‐19 aggravation during the first wave of COVID‐19. As of fall 2020, COVID‐19 has not disappeared. As the pandemic continues, medical facilities will need to thoroughly prevent infections and promote telephone/online medical care to mitigate the decrease in in‐person visits, and the inability to take regular medications.
5. CONCLUSION
This cross‐sectional study found that the frequency of outpatient visits decreased approximately 40% during the first wave of COVID‐19, but that fewer than 10% of the respondents had run out of their regular medications or had a deterioration of a chronic disease. Fear of being infected with COVID‐19 at medical facilities was strongly associated with a decrease in medical visit frequency and inability to take regular medications. It is important to continue implementing thorough infection control measures at medical facilities and to inform the public the importance of keeping chronic diseases in good condition as well as promoting telephone/online medical care to avoid decreases in medical visit frequency.
CONFLICT OF INTEREST
The authors have stated explicitly that there are no conflicts of interest in connection with this article.
AUTHOR CONTRIBUTIONS
TTakakubo, YO, and SI designed the study. MM and SI participated in the data collection. TTakakubo and YO undertook the statistical analysis and wrote the manuscript. TTakamiya, NF, HK, SA, IN, and HW assisted in the revision of the manuscript. All authors contributed to and approved the final manuscript.
ETHICAL APPROVAL
This study was approved by the Ethics Committee of Tokyo Medical University, Tokyo, Japan (No: T2019‐0234). Informed consent was obtained from all respondents.
ACKNOWLEDGEMENTS
We express our sincere thanks to all the participants who enrolled in this study.
Takakubo T, Odagiri Y, Machida M, et al. Changes in the medical treatment status of Japanese outpatients during the coronavirus disease 2019 pandemic. J Gen Fam Med. 2021;22:246–261. 10.1002/jgf2.432
IRB Approval: This study was approved by the Ethics Committee of Tokyo Medical University, Tokyo, Japan (No: T2019‐0234).
REFERENCES
- 1.Japanese Ministry of Health, Labor and Welfare (JMHLW) . PCR_positive_daily. [Internet]. 2020. [cited 2020 Nov 19]. Available from: https://www.mhlw.go.jp/stf/covid‐19/open‐data.html
- 2.Japanese Ministry of Health, Labor and Welfare (JMHLW) . Death_total.csv. [Internet]. 2020. [cited 2020 Nov 19]. Available from: https://www.mhlw.go.jp/stf/covid‐19/open‐data.html
- 3.Japanese Ministry of Health, Labor and Welfare (JMHLW) . National cluster map. [Internet]. 2020. [cited 2020 Oct 20]. Available from: https://www.mhlw.go.jp/content/000657332.pdf
- 4.Wu Z, McGoogan JM. Characteristics of and important lessons from the coronavirus disease 2019 (COVID‐19) outbreak in China: summary of a report of 72 314 cases from the Chinese Center for Disease Control and Prevention. JAMA. 2020;323(13):1239–42. [DOI] [PubMed] [Google Scholar]
- 5.Lu L, Zhong W, Bian Z, Li Z, Zhang K, Liang B, et al. A comparison of mortality‐related risk factors of COVID‐19, SARS, and MERS: a systematic review and meta‐analysis. J Infect. 2020;81(4):e18–25. [DOI] [PMC free article] [PubMed] [Google Scholar]
- 6.Williamson EJ, Walker AJ, Bhaskaran K, Bacon S, Bates C, Morton CE, et al. Factors associated with COVID‐19‐related death using OpenSAFELY. Nature. 2020;584(7821):430–6. [DOI] [PMC free article] [PubMed] [Google Scholar]
- 7.Harrison SL, Fazio‐Eynullayeva E, Lane DA, Underhill P, Lip GYH. Comorbidities associated with mortality in 31,461 adults with COVID‐19 in the United States: a federated electronic medical record analysis. PLoS Medicine. 2020;17(9):e1003321. [DOI] [PMC free article] [PubMed] [Google Scholar]
- 8.Smith AA, Fridling J, Ibhrahim D, Porter PS Jr. Identifying patients at greatest risk of mortality due to COVID‐19: a New England perspective. West J Emerg Med. 2020;21(4):785–9. [DOI] [PMC free article] [PubMed] [Google Scholar]
- 9.Wang B, Li R, Lu Z, Huang Y. Does comorbidity increase the risk of patients with COVID‐19: evidence from meta‐analysis. Aging (Albany NY). 2020;12(7):6049–57. [DOI] [PMC free article] [PubMed] [Google Scholar]
- 10.Japanese Ministry of Health, Labor and Welfare (JMHLW) . Response to a new coronavirus infection and its impact. [Internet]. 2020. [cited 2020 Oct 20]. Available from: https://www.mhlw.go.jp/content/12404000/000660347.pdf
- 11.Machida M, Nakamura I, Saito R, Nakaya T, Hanibuchi T, Takamiya T, et al. Incorrect use of face masks during the current COVID‐19 Pandemic among the General Public in Japan. Int J Environ Res Public Health. 2020;17(18):6484. [DOI] [PMC free article] [PubMed] [Google Scholar]
- 12.Machida M, Nakamura I, Saito R, Nakaya T, Hanibuchi T, Takamiya T, et al. Changes in implementation of personal protective measures by ordinary Japanese citizens: a longitudinal study from the early phase to the community transmission phase of the COVID‐19 outbreak. Int J Infect Dis. 2020;96:371–5. [DOI] [PMC free article] [PubMed] [Google Scholar]
- 13.Kikuchi H, Machida M, Nakamura I, Saito R, Odagiri Y, Kojima T, et al. Changes in psychological distress during the COVID‐19 Pandemic in Japan: a Longitudinal Study. J Epidemiol. 2020;30(11):522–8. [DOI] [PMC free article] [PubMed] [Google Scholar]
- 14.Japanese Ministry of Health, Labor and Welfare (JMHLW) . Situation analysis and recommendations for the control of new coronavirus infections. [Internet]. 2020. [cited 2020 Oct 28]. Available from: https://www.mhlw.go.jp/content/10900000/000635389.pdf
- 15.Japanese Ministry of Health, Labor and Welfare (JMHLW) . Handling of medical care and prescriptions using telephones and information and communication devices in response to the increase in the number of patients with new coronavirus infections. [Internet]. 2020. [cited 2020 Oct 22]. Available from: https://www.mhlw.go.jp/content/000602503.pdf
- 16.Medical Information Research Institute . JMIRI Prescription Information Database. [Internet]. 2020. [cited 2020 Oct 22]. Available from: https://www.jmiri.jp/files/topics/20200616_PressRelease.pdf
- 17.Japanese Ministry of Health, Labor and Welfare (JMHLW) . Cluster group Eiju General Hospital Investigation Team support report. [Internet]. 2020. [cited 2020 Oct 22]. Available from: http://www.eijuhp.com/user/media/eiju/chousasiennhoukoku.pdf
- 18.Abe A. An initial analysis of who's withholding medical care: a preliminary study using J‐SHINE. CIS Discussion Paper series No. 603. [Internet]. 2013. [cited 2020 Nov 22] Available from https://hermes‐ir.lib.hit‐u.ac.jp/hermes/ir/re/search/simple/?lang=0&mode=&opkey=R160610427581126&list_sort=1&disp_cnt=20&facet_item=fauth&facet_val1=Abe%2C+Aya&facet_val2=&con_kywd=&cate_schema=1000&chk_schema=1000&codeno=&fc_val=&req=facet
- 19.Machida M, Nakamura I, Saito R, Nakaya T, Hanibuchi T, Takamiya T, et al. Adoption of personal protective measures by ordinary citizens during the COVID‐19 outbreak in Japan. Int J Infect Dis. 2020;94:139–44. [DOI] [PMC free article] [PubMed] [Google Scholar]
- 20.National Health Commission of the People’s Republic of China . Online health services play role in COVID‐19 fight. [Internet]. 2020. [cited 2020 Oct 20]. Available from: https://www.en.nhc.gov.cn/2020‐03/01/c_77147.htm
- 21.Japanese Ministry of Health, Labor and Welfare (JMHLW) . Guidelines for appropriate implementation of online medical care. [Internet]. 2020. [cited 2020 Oct 22]. Available from: https://www.mhlw.go.jp/file/05‐Shingikai‐10801000‐Iseikyoku‐Soumuka/0000201789.pdf
- 22.Japanese Ministry of Health, Labor and Welfare (JMHLW) . The points to note regarding temporary and exceptional treatment of medical care using telephones and information and communication equipment in the event of spread of a novel coronavirus infection. [Internet]. 2020. [cited 2020 Oct 22]. Available from: https://www.mhlw.go.jp/content/000667692.pdf