

Abstract
Purpose
Tracking changes in care utilization of medication for opioid use disorder (MOUD) services before, during, and after COVID‐19‐associated changes in policy and service delivery in a mixed rural and micropolitan setting.
Methods
Using a retrospective, open‐cohort design, we examined visit data of MOUD patients at a family medicine clinic across three identified periods: pre‐COVID, COVID transition, and COVID. Outcome measures include the number and type of visits (in‐person or telehealth), the number of new patients entering treatment, and the number of urine drug screens performed. Distance from patient residence to clinic was calculated to assess access to care in rural areas. Goodness‐of‐Fit Chi‐Square tests and ANOVAs were used to identify differences between time periods.
Findings
Total MOUD visits increased during COVID (436 pre vs. 581 post, p < 0.001), while overall new patient visits remained constant (33 pre vs. 29 post, p = 0.755). The clinic's overall catchment area increased in size, with new patients coming primarily from rural areas. Length of time between urine drug screens increased (21.1 days pre vs. 43.5 days post, p < 0.001).
Conclusions
The patterns of MOUD care utilization during this period demonstrate the effectiveness of telehealth in this area. Policy changes allowing for MOUD to be delivered via telehealth, waiving the need for in‐person initiation of MOUD, and increased Medicaid compensation for MOUD may play a valuable role in improving access to MOUD during the COVID‐19 pandemic and beyond.
Keywords: buprenorphine, COVID‐19, opioid use disorder, rural, telehealth
The COVID‐19 pandemic has caused monumental changes in health care delivery, including the provision of medications for opioid use disorder (MOUD). MOUD is considered to be a life‐saving treatment for individuals with opioid use disorder (OUD), and it is recommended by the Centers for Disease Control as a key strategy for overdose prevention. 1 , 2 , 3 Simultaneously, COVID‐19 may also be increasing demand for MOUD, as the isolation and economic devastation of the pandemic exacerbate substance use disorders and mental health issues. 4 , 5 , 6 , 7 Nationally, harm reduction experts recommended that people who use opioids consider initiating buprenorphine treatment to avoid withdrawal and increased overdose risk if the availability of nonmedical opioids is disrupted. 8 In anticipation of this increased demand, the Drug Enforcement Agency (DEA) and Substance Abuse and Mental Health Service Administration (SAMHSA) altered the guidelines for providing MOUD early in the pandemic. These changes allowed buprenorphine induction via telehealth (including by phone) and waived the Ryan Haight Act's in‐person visit requirement for prescribing controlled substances. 9 Crucially, compensation for telehealth services via Medicaid was also expanded to match the rates for in‐person visits, making telehealth a viable alternative for providers. 10
Based on the projected increase in demand for MOUD services during COVID and the policy changes to allow MOUD to be administered via telehealth, we anticipate increases in the number of total visits and the number of new patients seen during COVID. Further, expanded availability of telehealth for treating OUD may increase access to these services, especially in remote or rural areas where providers with the required credentials, such as the DEA “X”‐waiver, have historically been scarce. 11 , 12 , 13 , 14 As such, we expect to see an increase in the use of MOUD services by patients from rural areas after the COVID‐related changes; however, it is also known that Internet and mobile phone service coverage are each more limited in rural areas, making it unclear to what extent people in rural areas who could benefit from telehealth‐provided MOUD will be able to access this modality. 15 In this study, we aim to explore changes associated with the telehealth policy change in terms of the patient population seen for MOUD, access to MOUD services for rural patients, overall MOUD clinic volume, and changes to the provision of MOUD.
METHODS
Participants and Procedures
We extracted data for patient visits from the electronic health records system at a single family medicine clinic with a high concentration of providers that offer office‐based opioid treatment (OBOT) services in a primarily rural and micropolitan region with a high overdose rate in the Appalachian Mountains. Patients were included if they had ever been prescribed a buprenorphine‐containing medication and had an ICD‐10 diagnosis code for OUD (F11.20, F11.21, and F11.29). Visit data were extracted from November 16, 2019, through June 15, 2020, and subsequently classified as occurring during one of three periods: pre‐COVID (Jaunary 16, 2020–March 15, 2020), the transition phase occurring during the month of COVID‐related changes (March 16, 2020–April 15, 2020), or COVID (April 16, 2020–June 15, 2020). Data from the North Carolina Department of Health and Human Services’ COVID‐19 Dashboard show that COVID was just beginning to appear in North Carolina during the study period. There was 1 death and 119 cases in the pre‐COVID time period, 179 deaths and 6088 cases during the transition time period, and 1062 deaths and 42,985 cases during the COVID time period. 16 Data from November and December of 2019 were used to identify those patients who were established in treatment prior to the start of our pre‐COVID period in order for us to appropriately identify new patients entering OBOT. This study was approved by the Mission Health Institutional Review Board.
Measures
We collected patient demographics, including age, race, sex,i ZIP Code of residence, and insurance type. For each visit, we extracted the date of the visit, type of visit (in‐person, lab, or telehealth), and whether or not a urine drug screen (UDS) was performed. We also obtained the total number of visits that the entire family medicine clinic had during these three time periods. Several additional variables were calculated from the extracted data. First, the distance that patients traveled to reach the clinic was estimated based on the distance between the centroid of their ZIP Code of residence and the centroid of the ZIP Code for the clinic. Second, the number of visits for each patient was calculated for each of the three time periods. Finally, we identified all new patient visits as the first visit occurring for each patient that was not present in the establishment period (November 16, 2019–December 31, 2019). This was then used to calculate the number of new patient visits occurring each week and during each time period of interest. Finally, the Rural‐Urban Continuum Codes (RUCC) produced by the US Department of Agriculture were used to classify ZIP Codes as rural if they had a nonmetro RUCC code (4 or more). 17
Statistical Analysis
We used SAS v9.4 (SAS Institute Inc., Cary, NC) for all data cleaning and analysis. Goodness of fit Chi‐square tests and ANOVAs were used to evaluate changes in the proportions and averages, respectively, of outcomes across all three time periods. For goodness of fit Chi‐square tests, the expected proportions were assumed to be 40% for pre‐COVID and COVID, and 20% for the transition phase based on their respective amount of study time (2, 1, and 2 months, respectively). Prior administrative data for the clinic from 2018 and 2019 closely followed this 40/20/40 distribution from January to June, suggesting that this distribution was appropriate and neither cyclic trends nor seasonality were of concern. Maps were made in ArcGIS Desktop version 10.7.1 (Esri, Redlands, CA) for the purpose of visualizing catchment area changes between time periods.
RESULTS
Patient Demographics
Over the 5‐month study period, a total of 242 patients had at least one visit for OBOT. Of those, 196 were seen pre‐COVID, 171 during the 1‐month transition phase, and 221 post‐policy change. A higher percentage of the patients had a visit during the transition phase than would be expected based on the proportion of time (29.1%, p < 0.001). The patients had a mean age of 37.5 (SD = 11.1), 57.0% were females (n = 138), and they were predominantly White (81.4%, n = 197). The sample had a diverse mix of insurance, including 37.2% Medicaid (n = 90), 26.9% commercial plans (65), and 12.4% Medicare (30). The remaining 23.5% were uninsured (n = 57). These demographics did not vary significantly across the time frames of interest (Table 1).
Table 1.
Patient demographics before, during, and after COVID‐19 policy changes
| Time frame | |||||
|---|---|---|---|---|---|
| Total | Pre‐COVID | Transition | COVID | p value | |
| Patient count, N b | 242 | 196 | 171 | 221 | < 0.001 |
| Age, mean (SD) | 37.5 (11.1) | 38.1 (11.7) | 37.4 (10.5) | 37.4 (11.1) | 0.865 |
| Sex, N (%) | 0.957 | ||||
| Male | 104 (43.0) | 81 (41.3) | 73 (42.7) | 94 (42.5) | |
| Female | 138 (57.0) | 115 (58.7) | 98 (57.3) | 127 (57.5) | |
| Race, N (%) | 0.623 | ||||
| White | 197 (81.4) | 171 (87.2) | 146 (85.4) | 181 (81.9) | |
| Non‐White | 13 (5.4) | 9 (4.6) | 8 (4.7) | 12 (5.4) | |
| Unknown/refused to report | 32 (13.2) | 16 (8.2) | 17 (9.9) | 28 (12.7) | |
| Insurance type, N (%) | 0.984 | ||||
| Commercial | 65 (26.9) | 59 (30.1) | 50 (29.2) | 62 (28.1) | |
| Medicaid | 90 (37.2) | 73 (37.2) | 65 (38.0) | 81 (36.7) | |
| Medicare | 30 (12.4) | 25 (12.8) | 19 (11.1) | 26 (11.8) | |
| Uninsured | 57 (23.5) | 39 (21.6) | 37 (21.6) | 52 (23.5) | |
| Distance from clinic (in miles), mean (SD) | 14.6 (24.2) | 14.3 (19.9) | 14.5 (25.3) | 14.94 (24.9) | 0.960 |
| Office visit | 13.9 (20.2) | 14.5 (19.3) | 15.4 (29.9) | 10.7 (8.1) | 0.5288 |
| Telehealth | 15.7 (28.9) | – | 13.6 (24.2) | 16.4 (30.2) | |
| Lab visit | 13.4 (8.4) | 6.9 (4.4) | 11.9 (‐) | 15.0 (8.8) | |
| Days between visits, mean (SD) | 21.8 (13.1) | 20.3 (10.2) | 21.7 (11.8) | 22.47 (14.6) | 0.095 |
| Days between UDS, mean (SD) | 27.2 (20.4) | 21.1 (10.2) | 26.6 (13.5) | 43.46 (32.2) | < 0.001 |
Descriptive statistics for demographic characteristics of patients seen for OBOT at a family medicine practice before, during, and after changes made due to the COVID‐19 pandemic. Bolded values are significant at p < 0.05.
One‐way Chi‐Square test using the number of months per time period out of total study months (5).
Total patients count is the number of unique patients through the duration of the study, while period totals are unique patients within each time frame.
This article is being made freely available through PubMed Central as part of the COVID-19 public health emergency response. It can be used for unrestricted research re-use and analysis in any form or by any means with acknowledgement of the original source, for the duration of the public health emergency.
Rurality and Access
There were not significant differences in the average distance from the clinic per patient or by visit type between time periods (Table 1). However, a direct comparison of the average distance for telemedicine visits after the policy change (16.4 miles) and office visits during the same time period (10.7 miles) revealed that telemedicine visits were being used for patients who lived significantly farther from the clinic (p = 0.0237) Similarly, in a visualization of the clinic's overall catchment area (Figure 1), there was an increase after the policy change with the greatest increases in patients coming from rural ZIP Codes.
FIGURE 1.
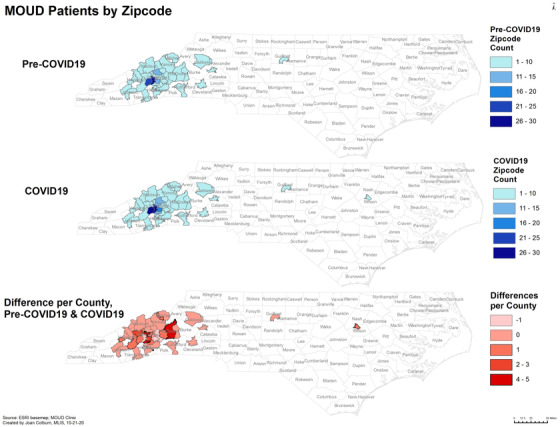
MOUD services catchment area Pre‐COVID‐19, after COVID‐19 policy changes, and the change in patient count per ZIP Code. A grouping of 1‐10 patients was used to protect privacy for ZIP Codes with low patient counts. Patient counts increased in several rural areas after the telehealth policy changes relating to COVID‐19.
Clinic Volume
More overall OBOT visits occurred during the COVID period (581) than pre‐COVID (436) or during the transition phase (254), and a higher proportion of all visits occurred during COVID than would be anticipated based on the proportion of study time (45.7% of visits vs. 40% of total study time; p < 0.001). Furthermore, OBOT visits represented a higher proportion of all visits at the family medicine clinic during the transition (6.4%) and COVID (5.8%) periods than pre‐COVID (4.1%; p < 0.001). There was no significant change in the number of new patient visits throughout the duration of the study (p = 0.755); however, new OBOT patient visits represented a higher percentage of all new patient visits in the family medicine clinic during the transition phase (7.7%) than either pre‐COVID (3.0%) or during COVID (3.4%; p = 0.002).
Practice Changes
The implementation of telemedicine and reduction in face‐to‐face visits being scheduled during the transition and COVID phases resulted in a significant shift in visit locations from office to telemedicine (p < 0.001). During the COVID period, there were also more lab visits (n = 13) scheduled than during the transition (n = 1) or pre‐COVID (n = 3; p < 0.001). For a full examination of visit types over time, see Figure 2. Despite the policy changes and shift in appointment location, the average number of days between patient visits did not change between time periods (p = 0.095), with averages of 20.3 (SD = 10.2) pre‐COVID, 21.7 (SD = 11.8) during the transition, and 22.5 (SD = 14.6) post‐COVID. However, the average number of days between UDS visits increased substantially. The average days between UDS visits increased from 21.1 (SD = 10.2) pre‐COVID to 26.6 (SD = 13.5) during the transition phase and 43.5 (SD = 32.2) during COVID (p < 0.001). There was a sharp reduction on the total number of UDS ordered, decreasing from 409 pre‐COVID to 101 during the transition phase and only 68 during COVID. While lab visits accounted for a small number of all visits where a UDS was administered, there was an increase in the proportion of UDS occurring during lab visits during COVID (7.9%) compared to pre‐COVID (0.5%) and the transition phase (1.5%). See online Appendix 1.
FIGURE 2.
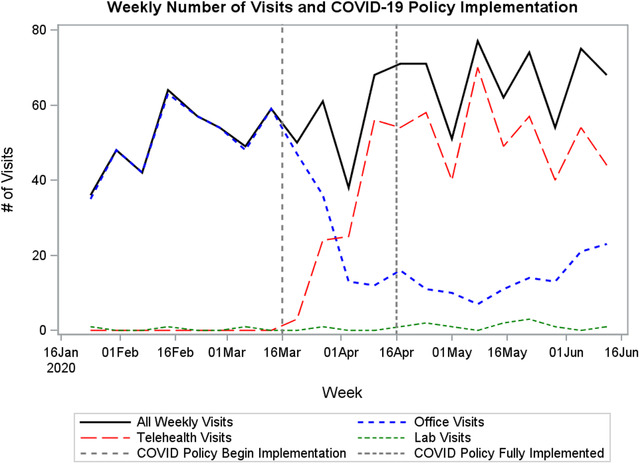
Weekly visit counts at a family medicine clinic offering Office‐Based Opioid Treatment (OBOT) services. Clinic services began transitioning to telehealth on March 16, 2020, due to COVID‐19.
DISCUSSION
Total visits for MOUD services increased during the COVID time periods, indicating that the practice was able to retain current patients and accommodate new intakes during this time. Overall patient count also increased, reflecting increased demand and recognition of the importance of these services. During the COVID transition period, increased visits likely reflected patients obtaining their prescriptions and appointments earlier in preparation for possible quarantine or difficulties accessing care in the future; fortunately, these concerns did not come to pass. In fact, the greater proportion of MOUD visits in relation to overall clinic visits during this time reflects that patients likely had easier access to care as demand for other clinic services fell and more appointments were made available. That this trend continued even after the transition phase ended and demand for other clinic visits began to rebound indicates that MOUD patients were willing to return for in‐clinic appointments and lab‐only visits when it was safe to do so.
We had hypothesized that increased access to telehealth and in‐person appointments may have allowed patients from more distant communities to access care as the catchment area served by our clinic includes rural areas. While the overall average distance of patients from the clinic did not change significantly during the study period, patients using telehealth visits after the policy change lived farther away from the clinic than those who attended in‐person office visits. Additionally, given the mountainous nature of the region, straight‐line distance does not necessarily reflect the reality of the time and distance that patients may be traveling to access care in person. As a result, our result is likely a lower bound of the actual difference in potential commute time for patients using telehealth. There was an increase in the number of patients seen from rural counties during the study period, suggesting a possibility that telehealth provision of MOUD represented increased access in this area. This appears to be a promising area for further qualitative research.
OBOT providers traditionally complete UDS every visit for patients receiving OBOT, though this is not a regulatory requirement. Due to the implementation of telehealth in the COVID and transition periods, the number of UDS decreased sharply. This was an appropriate safety measure to decrease contact between patients and providers as well as allow lab staff to focus on COVID testing. The increase in visits during the COVID period suggests that reduced UDS rates did not generally lead to loss of follow‐up in the patient population; patients were retained in MOUD services and the harm reduction mission of these services was fulfilled.
The MOUD policy changes made in response to the COVID‐19 pandemic have been vocally championed by substance use and harm reduction experts as a step toward much‐needed policy reform, especially with regard to administering MOUD via telehealth. 18 , 19 , 20 The patterns of MOUD care utilization we observed during this period suggest that these policy changes may have improved, or at least maintained, access to MOUD and demonstrate the potential effectiveness of telehealth for MOUD. In the future, a model of MOUD incorporating telehealth visits may allow increased access to services in more remote parts of the catchment area as well as assisting patients without reliable transportation or childcare. While our findings are promising, there is still much work to be done to examine the limitations of telehealth for MOUD. Although the rural communities included in our studies appeared to benefit from improved access, slow or inconsistent Internet and even limited cellular coverage may have prevented this effort from having greater impact. Furthermore, the lack of privacy from household members during telehealth visits may discourage patients from disclosing or seeking help for sensitive issues, such as intimate partner violence. Finally, telehealth visits also do not address known barriers to filling buprenorphine products at rural pharmacies, further complicating the impact these policy changes may have had. 21 , 22
Limitations
This study had several limitations. First, as a purely quantitative study without direct information from patients about their reasons for attending or not attending telehealth visits and their perceptions of it, we can only infer or speculate as to what the results mean. There was no measure of the quality or patient satisfaction with different modalities of care. Future studies should examine patient satisfaction measures and use qualitative data collection to examine the experiences of people in rural areas who did and did not enroll in telehealth MOUD for the first time during the pandemic. Second, there has not been sufficient passage of time to establish if new patients enrolled during this time will be retained in care long term. Future studies should seek to evaluate the impacts of COVID‐19 on MOUD services over a longer time period. Finally, the COVID‐19 pandemic resulted in a myriad of deleterious effects that were simultaneous, multifaceted, and widespread. As such, there are almost assuredly confounding factors that impacted who sought and received MOUD services. Future studies should strive to examine changes in MOUD access at the population level where the generalized impacts of COVID‐19 can be better controlled.
ENDNOTE
i Assigned sex at birth (ASAB) as indicated in the electronic health record (EHR); this practice allows providers to identify a patient's correct sex and/or gender manually through an override process; however, by and large, a data pull will reflect ASAB. We acknowledge this limitation of the EHR likely results in an under‐reflection of noncisgender OUD patients—an important consideration as LGBTQ populations are at increased structural risk for SUD and overdose, particularly in the South.
Supporting information
Appendix 1. Visit changes over time
ACKNOWLEDGEMENTS
We wish to acknowledge Joan Colburn for her contribution to this manuscript in the form of GIS & Mapping support.
Hughes PM, Verrastro G, Fusco CW, Wilson CG, Ostrach B. An examination of telehealth policy impacts on initial rural opioid use disorder treatment patterns during the COVID‐19 pandemic. J Rural Health. 2021;37:467–472. 10.1111/jrh.12570
Dr. Wilson's current affiliations are 4 and 5. At the time of study completion, her affiliations were 1, 3, and 4.
REFERENCES
- 1. Schuckit MA. Treatment of opioid‐use disorders. N Engl J Med. 2016;375(4):357‐368. [DOI] [PubMed] [Google Scholar]
- 2. National Academies of Sciences, Engineering, and Medicine . Medications for Opioid Use Disorder Save Lives. National Academies Press; 2019. [PubMed] [Google Scholar]
- 3. Carroll J, Green T, Noonan R. Evidence‐Based Strategies for Preventing Opioid Overdose: What's Working in the United States, 2018. Centers for Disease Control; 2018. Accessed December 2, 2019. https://www.cdc.gov/drugoverdose/pdf/pubs/2018‐evidence‐based‐strategies.pdf
- 4. Volkow ND. Collision of the COVID‐19 and addiction epidemics. Ann Intern Med. 2020;173(1):61‐62. [DOI] [PMC free article] [PubMed] [Google Scholar]
- 5. Slavova S, Rock P, Bush HM, Quesinberry D, Walsh SL. Signal of increased opioid overdose during COVID‐19 from emergency medical services data. Drug Alcohol Depend. 2020;214:108176. [DOI] [PMC free article] [PubMed] [Google Scholar]
- 6. Wakeman SE, Green TC, Rich J. An overdose surge will compound the COVID‐19 pandemic if urgent action is not taken. Nat Med. 2020;26(6):819‐820. [DOI] [PMC free article] [PubMed] [Google Scholar]
- 7. Ostrach B, Buer L, Armbruster S, Brown H, Yochym G, Zaller N. COVID‐19 and rural harm reduction challenges in the US Southern Mountains. J Rural Health. 2021;37(1):252‐255. [DOI] [PMC free article] [PubMed] [Google Scholar]
- 8. National Harm Reduction Coalition . COVID‐19 Guidance for People Who Use Drugs and Harm Reduction Programs. Harm Reduction Coalition Blog. 2020. Accessed September 28, 2020. https://harmreduction.org/hrc2/blog/covid‐19‐guidance‐for‐people‐who‐use‐drugs‐and‐harm‐reduction‐programs/
- 9. U.S. Drug Enforcement Agency, Diversion Control Division . COVID‐19 Information Page. Accessed August 3, 2020. https://www.deadiversion.usdoj.gov/coronavirus.html
- 10. Assistant Secretary for Public Affairs . Telehealth: Delivering Care Safely During COVID‐19. 2020. Accessed October 16, 2020. https://www.hhs.gov/coronavirus/telehealth/index.html
- 11. Weintraub E, Greenblatt AD, Chang J, Himelhoch S, Welsh C. Expanding access to buprenorphine treatment in rural areas with the use of telemedicine. Am J Addict. 2018;27(8):612‐617. [DOI] [PubMed] [Google Scholar]
- 12. Andrilla CHA, Patterson DG, Garberson LA, Coulthard C, Larson EH. Geographic variation in the supply of selected behavioral health providers. Am J Prev Med. 2018;54(6):S199‐S207. [DOI] [PubMed] [Google Scholar]
- 13. Flavin L, Malowney M, Patel N, et al. Availability of buprenorphine treatment in the 10 states with the highest drug overdose death rates in the United States. J Psychiatr Pract. 2020;26(1):17‐22. [DOI] [PubMed] [Google Scholar]
- 14. WWAMI Rural Health Research Center . Changes in the Supply of Physicians with a DEA DATA Waiver to Prescribe Buprenorphine for Opioid Use Disorder . Rural Health Research & Policy Centers; 2017. [Google Scholar]
- 15. Whitacre BE, Wheeler D, Landgraf C. What can the national broadband map tell us about the health care connectivity gap?: rural‐urban health care connectivity gap. J Rural Health. 2017;33(3):284‐289. [DOI] [PubMed] [Google Scholar]
- 16. NC DHHS . COVID‐19 Dashboard. COVID‐19 North Carolina Dashboard. 2021. Accessed January 11, 2021. https://covid19.ncdhhs.gov/dashboard [Google Scholar]
- 17. Economic Research Service, U.S. Department of Agriculture . Rural‐Urban Continuum Codes. 2013. Accessed January 7, 2021. https://www.ers.usda.gov/data‐products/rural‐urban‐continuum‐codes/documentation/
- 18. del Pozo B, Beletsky L. No “back to normal” after COVID‐19 for our failed drug policies. Int J Drug Policy. 2020. 83, 10.1016/j.drugpo.2020.102901. [DOI] [PMC free article] [PubMed] [Google Scholar]
- 19. Davis CS, Samuels EA. Continuing increased access to buprenorphine in the United States via telemedicine after COVID‐19. Int J Drug Policy. 2020. 10.1016/j.drugpo.2020.102905. [DOI] [PMC free article] [PubMed] [Google Scholar]
- 20. Harris M, Johnson S, Mackin S, Saitz R, Walley AY, Taylor JL. Low barrier tele‐buprenorphine in the time of COVID‐19: a case report. J Addict Med. 2020;14(4):e136. [DOI] [PMC free article] [PubMed] [Google Scholar]
- 21. Cooper HL, Cloud DH, Freeman PR, et al. Buprenorphine dispensing in an epicenter of the U.S. opioid epidemic: a case study of the rural risk environment in Appalachian Kentucky. Int J Drug Policy. 2020. 85, 10.1016/j.drugpo.2020.102701. [DOI] [PMC free article] [PubMed] [Google Scholar]
- 22. Cooper HLF, Cloud DH, Young AM, Freeman PR. When prescribing isn't enough — pharmacy‐level barriers to buprenorphine access. N Engl J Med. 2020;383(8):703‐705. [DOI] [PubMed] [Google Scholar]
Associated Data
This section collects any data citations, data availability statements, or supplementary materials included in this article.
Supplementary Materials
Appendix 1. Visit changes over time