

PEER REVIEW
The peer review history for this article is available at https://publons.com/publon/10.1111/dom.14382.
The coronavirus disease 2019 (COVID‐19) pandemic has caused a considerable number of deaths. Identifying individuals at higher risk of critical illness and death is critical for planning prevention strategies, such as assigning vaccination priority. Several studies have linked obesity to more severe illness and higher mortality in COVID‐19 patients. 1 , 2 , 3 , 4 However, the relationship between underweight and COVID‐19 mortality remains inconclusive; previous dose‐response meta‐analyses did not include the underweight population in their evidence synthesis. 5 , 6 We conducted a systematic review and dose‐response meta‐analysis to investigate the relationship between body mass index (BMI) and mortality in both obese and underweight patients with COVID‐19.
We followed the Preferred Reporting Items for Systematic Reviews and Meta‐analyses (PRISMA) guidelines. 7 The protocol was registered in the International Platform of Registered Systematic Review and Meta‐analysis Protocols (registration number: INPLASY2020120090). We searched the PubMed, Embase, Cochrane Library, Scopus and Web of Science databases from inception until February 11, 2021 using the keywords “COVID‐19”, “body mass index", “obesity”, “overweight”, “underweight” and “mortality.” Details of the search strategies and article selection process are shown in the Supplementary Materials. We included studies if they: (i) reported mortality risk for patients with COVID‐19; (ii) divided patients into at least three different BMI categories and reported the relative risk (RR) of mortality for each category; and (iii) reported adjusted estimates (adjustment for age and sex at minimum). We only included studies that reported at least three BMI categories and the numbers of patients and deaths for each BMI category to investigate a potential nonlinear trend in dose‐response meta‐analysis. Both clinical trials and observational studies that provided sufficient data were eligible. Review articles, case reports, editorials, letters and conference abstracts were excluded. Studies that reported only crude estimates without adjusting for confounders were excluded. The primary outcome was mortality. Three reviewers (H.K.H., K.B. and D.P.H.) independently assessed the relevant articles to identify eligible studies, three reviewers (H.K.H., K.B. and D.P.H.) independently extracted the data, and two reviewers (K.B. and D.P.H.) assessed the quality of the studies using the Newcastle‐Ottawa Scale. 8 Discrepancies were resolved via discussion among the study team.
We first conducted a meta‐analysis for the difference in the risk of mortality between the highest and the lowest category of BMI using a DerSimonian and Laird random‐effects model (the high vs. low meta‐analysis). 9 We then conducted the random‐effects dose‐response meta‐analysis to estimate the linear and nonlinear trends in the association between BMI and mortality. 10 The linear trend was estimated by using the generalized least squares model described by Greenland and Longnecker. 11 We used the two‐stage approach to estimating the nonlinear trend by first fitting a restricted cubic splines model with knots at the 10th, 50th and 90th percentiles for each study and then undertaking a multivariate meta‐analysis for the model variables. 12 The Wald test was used to test for nonlinearity by comparing the model fit between the linear and nonlinear models. When the BMI level was presented as a range, the dose was assigned using the midpoint of the upper and lower boundaries; for the open‐ended highest and lowest BMI categories, the width between the boundaries was assumed to be equal to that of the adjacent category. RRs for mortality with 95% confidence intervals (CIs) were used to report the outcome. For the dose‐response meta‐analysis, a sensitivity analysis was conducted by pooling only studies specifically evaluating underweight patients (BMI < 18.5 kg/m2). We assessed heterogeneity among studies with I 2 statistics. The heterogeneity was considered low, moderate and high for I 2 < 50%, 50% to 75%, and > 75%, respectively. 13 Potential publication bias was assessed using funnel plots, Egger's test and Begg's test. 14 , 15 A leave‐one‐out sensitivity analysis was performed to evaluate the influence of each study on the overall pooled estimate. All statistical tests were two‐sided, with the significance level set at 5%. Statistical analyses were conducted using Stata version 15.1 (StataCorp, College Station, Texas) and R software version 4.0.2 (R Foundation for Statistical Computing, Vienna, Austria).
Institutional ethical approval was not required because this was a meta‐analysis of primary published studies only.
Of the 7443 potential studies screened, 4455 duplicate studies, 2393 irrelevant studies, and 567 studies without usable data on this topic were excluded, yielding 28 studies comprising 112 682 patients for the analysis (Figure S1). 1 , 16 , 17 , 18 , 19 , 20 , 21 , 22 , 23 , 24 , 25 , 26 , 27 , 28 , 29 , 30 , 31 , 32 , 33 , 34 , 35 , 36 , 37 , 38 , 39 , 40 , 41 , 42 The characteristics of the included studies are summarized in Table 1. The mean ages of the patients ranged from 51 to 71 years, the proportion of female participants ranged from 9% to 67%, and the sample sizes ranged from 191 to 25 952. The majority of the included studies were conducted in the United States and Europe and were retrospective cohort studies. Among them, 13 studies evaluated underweight patients specifically. 16 , 18 , 19 , 21 , 22 , 24 , 26 , 28 , 29 , 30 , 31 , 34 , 41 All the included studies had an acceptable quality, with a Newcastle‐Ottawa Scale score of ≥7 points (Table S1).
TABLE 1.
Summary of the 28 studies included in the dose‐response meta‐analysis
| First author and year | Study design | Country | Study population | Patient inclusion period | Sample size, n | Mean age, years | Female, % | BMI categories, kg/m2 | Outcome measurement |
|---|---|---|---|---|---|---|---|---|---|
| Anderson 2020 16 | Retrospective cohort | United States | Adults hospitalized with laboratory confirmed SARS‐CoV‐2 infection in NewYork‐Presbyterian /Columbia University Irving Medical Centre and the affiliated Allen Hospital | March 10 to April 24, 2020 | 2466 | 67 a | 42 | <18.5; 18.5–24.9; 25.0–29.9; 30–34.9; 35–39.9; ≥40 | In‐hospital mortality |
| Baronia 2020 17 | Retrospective cohort | Italy | Patients tested positive for SARS‐CoV‐2 RNA admitted to the Fondazione Poliambulanza di Brescia hospital | March 1 to April 11, 2020 | 191 | 66 a | 28.1 | <25; 25–29.9; ≥30 | In‐hospital mortality |
| Czernichow 2020 18 | Prospective cohort | France | Patients tested positive for SARS‐CoV‐2 and hospitalized in one of the Assistance Publique‐Hôpitaux de Paris hospitals | February 1 to April 30, 2020 | 5795 | 59.8 | 34.6 | <18.5; 18.5–24.9; 25–29.9; 30–34.9; 35–39.9; ≥40 | 30‐day mortality |
| Eastment 2020 19 | Retrospective cohort | United States | All VA patients tested positive for SARS‐CoV‐2 in the inpatient or outpatient setting | February 28 to June 21, 2020 | 25 952 | 61.7 | 10.9 | <18.5; 18.5–24.9; 25–29.9; 30–34.9; 35–39.9; ≥40 | 30‐day mortality |
| Fai2r 2020 20 | Retrospective cohort | France | COVID‐19 patients with inflammatory rheumatic disease | Feb 24 to April 17, 2020 | 694 | 56.1 | 66.6 | <30; 30–39.9; ≥40 | 21‐day mortality |
| Goyal 2020 21 | Retrospective cohort | United States | Persons hospitalized with confirmed COVID‐19 at two new York City hospitals | March 3 to may 15, 2020 | 1687 | 66.5 a | 40 | <18.5; 18.5–24.9; 25–29.9; 30–39.9; ≥40.0 | In‐hospital mortality |
| Gu 2020 22 | Retrospective cohort | United States | Patients tested or treated for COVID‐19 at the University of Michigan (Michigan medicine) | March 10 to April 22, 2020 | 1139 | 53.0 | 53.4 | <18.5; 18.5–24.9; 25–29.9; ≥30 | Both inpatient and nonhospitalized mortality |
| Gupta 2020 23 | Retrospective cohort | United States | Adults with COVID‐19 who were admitted to participating ICUs at 65 hospitals across the United States | March 4 to April 4, 2020. | 2215 | 60.5 | 35.2 | <25; 25–29.9; 30–34.9; 35–39.9; ≥40 | 28‐day in‐hospital mortality |
| Hajifathalian 2020 24 | Retrospective cohort | United States | Adult patients admitted with confirmed COVID‐19 in two hospitals (an academic tertiary care referral centre and a smaller community hospital) in New York City | March 4 to April 9, 2020 | 770 | 63.5 | 39 | <18.5; 18.5–29.9; ≥30 | In‐hospital mortality |
| Halasz 2020 25 | Retrospective cohort | Italy | Patients with laboratory‐confirmed COVID‐19 treated with invasive ventilation and admitted to the ICU of Guglielmo da Saliceto Hospital in Piacenza (Italy) | February to April, 2020 | 242 | 64 | 18.2 | 18.5–24.9; 25–29.9; 30–34.9; 35–39.9; ≥40 | 30‐day mortality |
| Hendren 2021 26 | Retrospective cohort | United States | Patients hospitalized with COVID‐19 at 88 US hospitals enrolled in the American Heart Association's COVID‐19 cardiovascular disease registry | Up to July 2020 | 7606 | 63 a | 45 | <18.5; 18.5–24.9; 25–29.9; 30–34.9; 35–39.9; ≥40 | In‐hospital mortality |
| Iannelli 2020 27 | Retrospective cohort | France | Patients with morbid obesity admitted for COVID‐19 | January 1 to may 15, 2020 | 8286 | 59.1 | 48.2 | 30–39.9; 40–50; >50 | COVID‐19‐related death |
| Ioannou 2020 28 | Retrospective cohort | United States | VA enrollees tested positive for SARS‐CoV‐2 identified using data from the Veterans' Affairs corporate data warehouse | February 28 to may 14, 2020 | 10 131 | 63.6 | 9 | <18.5; 18.5–24.9; 25–29.9; 30–34.9; ≥35 | All‐cause mortality at any time after the index date |
| Kabarriti 2020 29 | Retrospective cohort | United States | Patients with COVID‐19 presented for care to the Montefiore Medical Centre whether or not they were admitted as inpatients | March 14 to April 15, 2020 | 5902 | 58 a | 53 | <18.5; 18.5–34.9; ≥35 | All‐cause mortality (before April 27, 2020) |
| Kim 2020 30 | Retrospective cohort | Korea | Confirmed COVID‐19 patients, collected by the Centres for Disease Control and Prevention of Korea | All participants released from isolation by 30 April, 2020 | 4057 | Not reported | 58 | <18.5; 18.5–22.9; 23–24.9; ≥25 | Mortality during follow‐up period |
| Kim 2021 31 | Retrospective cohort | United States | Patients with COVID‐19 admitted to 12 Northwell health system acute‐care hospitals in New York | March 1 to April 27, 2020 | 10 861 | 65 a | 40.5 | <18.5; 18.5–24.9; 25–29.9; 30–34.9; 35–39.9; ≥40 | In‐hospital mortality |
| Klang 2020 32 | Retrospective cohort | United States | Patients with COVID‐19 who were hospitalized in a large academic hospital system in New York City | March 1 to May 17, 2020 | 3406 | Not provided b | 42.4 | <30; 30–39.9; ≥40 | In‐hospital mortality |
| Nakeshbandi 2020 33 | Retrospective Cohort | United States | Patients with COVID‐19 hospitalized at SUNY downstate health sciences University in New York (a COVID‐19‐only hospital) | March 10 to April 13, 2020 | 504 | 68 | 48 | 18.5–24.9; 25–29.9; ≥30 | 30‐day in‐hospital mortality |
| Nimkar 2020 34 | Retrospective case series | United States | Patients with COVID‐19 admitted to a teaching community hospital in new York City | March 10 to may 13, 2020 | 370 | 71 a | 44.3 | <18.5; 18.5–24.9; 25–29.9; ≥30 | In‐hospital mortality |
| Olivas‐Martínez 2021 35 | Prospective cohort | Mexico | Consecutive adult patients hospitalized with severe confirmed COVID‐19 pneumonia at a SARS‐CoV‐2 referral Centre in Mexico City | February 26 to June 5, 2020 | 800 | 51.9 | 39 | 18.5–24.9; 25–29.9; 30–34.9; 35–39.9; ≥40 | In‐hospital mortality |
| Palaiodimos 2020 36 | Retrospective cohort | United States | First 200 patients who presented to the emergency room and were admitted to the inpatient medicine service or ICU with laboratory‐confirmed COVID‐19 at the Montefiore Medical Centre | March 9 to March 22, 2020 | 200 | 64 a | 51 | <25; 25–34; ≥35 | In‐hospital mortality |
| Petrilli 2020 37 | Prospective cohort | United States | Patients with confirmed COVID‐19 at NYU Langone Health, which includes more than 260 outpatient office sites and four acute care hospitals | March 1 to April 8, 2020 | 5279 | 54 a | 50.5 | <25; 25–29.9; 30–39.9; ≥40 | In‐hospital mortality |
| Rottoli 2020 38 | Retrospective cohort | Italy | Patients admitted to the hospital who had a confirmed COVID‐19 diagnosis who were hospitalized in Sant'Orsola Hospital in Bologna, Italy | March 1 and April 20, 2020. | 482 | 66.2 | 37.3 | <30; 30–34.9; ≥35 | 30‐day mortality |
| Schmidt 2021 39 | Prospective cohort | France, Switzerland, and Belgium | Patients admitted to the ICU with laboratory‐confirmed SARS‐CoV‐2 infection | February 25 to may 4, 2020 | 4244 | 63 a | 26 | <25; 25–29.9; 30–34.9; 35–39.9; ≥40 | 90‐day mortality |
| Shah 2020 40 | Retrospective cohort | United States | All hospitalized patients with confirmed COVID‐19 at Phoebe Putney Health System (three Phoebe Putney hospitals) | March 2 to may 6, 2020 | 522 | 63 a | 58.2 | <30; 30–39.9; ≥40 | In‐hospital mortality |
| Smati 2021 1 | Retrospective cohort | France | Patients with type 2 diabetes and confirmed COVID‐19 admitted to 68 French hospitals | 10 March to April 10, 2020 | 1965 | 70.1 | 35.5 | 18.5–24.9; 25–29.9; 30–34.9; ≥35 | 7‐day mortality |
| Tartof 2020 41 | Retrospective cohort | United States | Kaiser Permanente Southern California members diagnosed with COVID‐19 by diagnostic codes or positive laboratory test results | February 13 to May 2, 2020 | 6916 | 49.1 | 55 | <18.5; 18.5–24.9; 25–29.9; 30–34.9; 35–39.9; 40–44.9; ≥45 | 21‐day mortality |
| Yoshida 2021 42 | Retrospective cohort | United States | Sequentially hospitalized adults admitted for COVID‐19 at two tertiary care academic hospitals in New Orleans, LA | February 27 to July 15, 2020 | 776 | 60.5 a | 61.4 | <25; 25–29.9; 30–34.9; 35–39.9; ≥40 | In‐hospital mortality |
Abbreviations: COVID‐19, coronavirus disease 2019; ICU, intensive care unit; VA, Veterans Affairs; SARS‐CoV‐2, severe acute respiratory syndrome coronavirus.
Median is presented.
572 patients were younger than 50 years and 2834 patients were older than 50 years.
In the high versus low meta‐analysis, we found that COVID‐19 patients with a high BMI had an increased risk of mortality (pooled RR 1.33, 95% CI 1.15–1.53; P < 0.001), with moderate heterogeneity (I 2 = 54.2%; Figure S2). There was no evidence of publication bias according to Egger's test (P = 0.270), Begg's test (P = 0.260), or the funnel plot (Figure S3). The leave‐one‐out sensitivity analysis demonstrated that the pooled RR was robust (Figure S4).
In the dose‐response meta‐analysis, a positive dose‐response relationship between BMI and mortality was found based on the linear model. The mortality of patients with COVID‐19 increased by 1.6% for each 1‐kg/m2 increase in BMI (pooled RR 1.016, 95% CI 1.008–1.025), with high heterogeneity (I 2 = 75.9%). However, a significant nonlinear relationship between BMI and mortality was observed (Wald test: P non‐linearity < 0.001). We demonstrated a J‐shaped curve, indicating that both underweight and obese patients had a higher mortality than those with normal weight (Figure 1A). A BMI of approximately 27 kg/m2 appeared to be associated with the lowest mortality risk. Using a BMI of 15 kg/m2 as the reference, the RRs for mortality decreased with BMI initially, and this trend continued until a BMI of approximately 27 kg/m2 (RR 0.836, 95% CI 0.708–0.987). The relationship between BMI and mortality was then reversed, and an upward trend was observed when BMI exceeded 27 kg/m2; the RRs at BMI values of 30, 35, 40 and 45 kg/m2 were 0.855 (95% CI 0.707–1.033), 0.965 (95% CI 0.785–1.186), 1.166 (95% CI 0.942–1.443) and 1.443 (95% CI 1.152–1.807), respectively. There was a moderate between‐study heterogeneity (I 2 = 62.3%). In the sensitivity analysis of the 13 studies with data on underweight patients, the J‐shaped relationship between BMI and mortality remained unchanged, and the nonlinear fit was significantly better than the linear fit (Figure 1B), further supporting the robustness of our findings.
FIGURE 1.
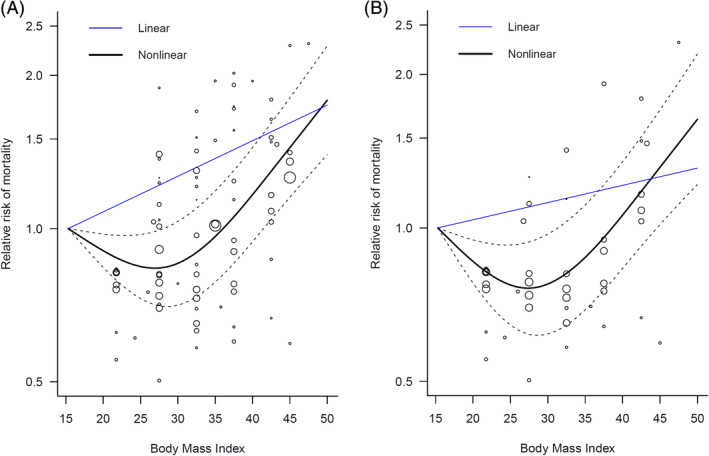
Dose‐response relationship between body mass index and mortality in patients with COVID‐19. (A) Full analysis using all studies listed in Table 1. (B) Sensitivity analysis that included only 13 studies with specific data on underweight patients
To our knowledge, this is the first dose‐response meta‐analysis to demonstrate a J‐curved relationship between BMI and COVID‐19 mortality, indicating that both underweight and obese COVID‐19 patients had a higher mortality risk than patients with normal weight. Our findings are supported by previous studies which suggested a more severe respiratory virus infection or respiratory mortality in both underweight and obese patients. 43 , 44 , 45 We found that overweight patients (BMI 25‐30 kg/m2) seemed to have the lowest COVID‐19 mortality risk, which was compatible with some previous evidence evaluating all‐cause mortality in the general population. 46 However, the observed association between overweight and lower mortality may be subject to the problems of reverse causation and confounding by smoking or other confounders discussed previously in the literature. 47 As our meta‐analysis comprises observational studies only, causality and underlying mechanisms could not be explored and still require further investigation. Despite these limitations, our findings have important public health implications. Awareness of vulnerable populations is critical when developing strategies for prevention, control, and treatment in the current pandemic. For example, the supply of COVID‐19 vaccines is limited worldwide; thus, determining the vaccine priority group was a crucial issue. Patients with obesity are already considered a risk group for assigning high vaccine priority, 48 , 49 but underweight patients have not received comparable attention. Our meta‐analysis shows a poor prognosis of both underweight and obese COVID‐19 patients, so we suggest that the underweight should also be considered an at‐risk group when assigning vaccine priority.
This meta‐analysis has some limitations. First, the majority of the included studies were retrospective, the presence of unadjusted confounders may have biased the relationship between BMI and mortality, and we were unable to determine whether there was a causal relationship between body weight and COVID‐19 mortality. Second, the BMI thresholds for overweight and obesity differed between Asian and Western countries; however, only one Asian study met the inclusion criteria and thus we could not conduct a subgroup analysis of Asian populations. Moreover, the relationship between BMI and the risk of COVID‐19 has been found to differ according to ethnicity. 50 The differences in obesity rates may explain some of the variations in the COVID‐19 mortality rates among countries. 51 Owing to these limitations, more high‐quality studies from different countries and ethnic groups are necessary to validate our findings.
AUTHOR CONTRIBUTIONS
Author contributions were as follows. Study conception and design: Huei‐Kai Huang and Yu‐Kang Tu. Acquisition of data: Huei‐Kai Huang, Khulood Bukhari, Carol Chiung‐Hui Peng, Duan‐Pei Hung and Rachel Huai‐En Chang. Analysis and interpretation of data: Huei‐Kai Huang, Ming‐Chieh Shih and Yu‐Kang Tu. Preparation of manuscript: Huei‐Kai Huang and Yu‐Kang Tu. Critical revisions: Huei‐Kai Huang, Ming‐Chieh Shih, Shu‐Man Lin, Kashif M. Munir and Yu‐Kang Tu. All authors read and approved the final manuscript.
CONFLICTS OF INTEREST
None declared.
Supporting information
Table S1. Quality assessment of the included cohort studies using the Newcastle‐Ottawa Scale
Figure S1. PRISMA flow diagram of the literature search and article selection
Figure S2. Forest plot of the relative risk of mortality for highest versus lowest categories of body mass index in COVID‐19 patients
Figure S3. Funnel plot to assess publication bias in studies comparing mortality between highest versus lowest categories of body mass index in COVID‐19 patients
Figure S4. The leave‐one‐out sensitivity analysis of the relative risk of mortality for highest versus lowest categories of body mass index in COVID‐19 patients with each study omitted individually one at a time
ACKNOWLEDGMENTS
We thank Stella Seal, MLS, from Johns Hopkins University, for her expertise with the database search.
Funding information The authors received no specific funding for this study.
DATA AVAILABILITY STATEMENT
The data that support the findings of this study are available from the corresponding author upon reasonable request.
REFERENCES
- 1. Smati S, Tramunt B, Wargny M, et al. Relationship between obesity and severe COVID‐19 outcomes in patients with type 2 diabetes: results from the CORONADO study. Diabetes Obes Metab. 2021;23(2):391‐403. [DOI] [PMC free article] [PubMed] [Google Scholar]
- 2. Luo XM, Jiaerken YM, Shen ZM, et al. Obese COVID‐19 patients show more severe pneumonia lesions on CT chest imaging. Diabetes Obes Metab. 2021;23(1):290‐293. [DOI] [PMC free article] [PubMed] [Google Scholar]
- 3. Hussain A, Mahawar K, Xia Z, Yang W, El‐Hasani S. Obesity and mortality of COVID‐19. Meta‐analysis. Obes Res Clin Pract. 2020;14(4):295‐300. [DOI] [PMC free article] [PubMed] [Google Scholar] [Retracted]
- 4. Huang Y, Lu Y, Huang YM, et al. Obesity in patients with COVID‐19: a systematic review and meta‐analysis. Metabolism. 2020;113:154378. [DOI] [PMC free article] [PubMed] [Google Scholar]
- 5. Pranata R, Lim MA, Yonas E, et al. Body mass index and outcome in patients with COVID‐19: a dose‐response meta‐analysis. Diabetes Metab. 2020;47(2):101178. [DOI] [PMC free article] [PubMed] [Google Scholar]
- 6. Du Y, Lv Y, Zha W, Zhou N, Hong X. Association of Body mass index (BMI) with critical COVID‐19 and in‐hospital mortality: a dose‐response meta‐analysis. Metabolism. 2020;117:154373. [DOI] [PMC free article] [PubMed] [Google Scholar]
- 7. Moher D, Liberati A, Tetzlaff J, Altman DG. Preferred reporting items for systematic reviews and meta‐analyses: the PRISMA statement. Ann Intern Med. 2009;151(4):264‐269.w264. [DOI] [PubMed] [Google Scholar]
- 8. Wells G, Shea B, O'Connell D, et al. The Newcastle‐Ottawa scale (NOS) for assessing the quality of nonrandomised studies in meta‐analyses. Ottawa Hospital Research Institute website. http://www.ohri.ca/programs/clinical_epidemiology/oxford.asp. Accessed August 22, 2020.
- 9. Higgins J, Green S. Cochrane Handbook for Systematic Reviews of Interventions Version 5.1.0 [updated March 2011]. The Cochrane Collaboration; 2011.
- 10. Orsini N, Li R, Wolk A, Khudyakov P, Spiegelman D. Meta‐analysis for linear and nonlinear dose‐response relations: examples, an evaluation of approximations, and software. Am J Epidemiol. 2012;175(1):66‐73. [DOI] [PMC free article] [PubMed] [Google Scholar]
- 11. Greenland S, Longnecker MP. Methods for trend estimation from summarized dose‐response data, with applications to meta‐analysis. Am J Epidemiol. 1992;135(11):1301‐1309. [DOI] [PubMed] [Google Scholar]
- 12. Desquilbet L, Mariotti F. Dose‐response analyses using restricted cubic spline functions in public health research. Stat Med. 2010;29(9):1037‐1057. [DOI] [PubMed] [Google Scholar]
- 13. Higgins JP, Thompson SG, Deeks JJ, Altman DG. Measuring inconsistency in meta‐analyses. BMJ. 2003;327(7414):557‐560. [DOI] [PMC free article] [PubMed] [Google Scholar]
- 14. Begg CB, Mazumdar M. Operating characteristics of a rank correlation test for publication bias. Biometrics. 1994;50(4):1088‐1101. [PubMed] [Google Scholar]
- 15. Egger M, Davey Smith G, Schneider M, Minder C. Bias in meta‐analysis detected by a simple, graphical test. BMJ. 1997;315(7109):629‐634. [DOI] [PMC free article] [PubMed] [Google Scholar]
- 16. Anderson MR, Geleris J, Anderson DR, et al. Body mass index and risk for intubation or death in SARS‐CoV‐2 infection : a retrospective cohort study. Ann Intern Med. 2020;173(10):782‐790. [DOI] [PMC free article] [PubMed] [Google Scholar]
- 17. Baronio M, Freni‐Sterrantino A, Pinelli M, et al. Italian SARS‐CoV‐2 patients in intensive care: towards an identikit for subjects at risk? Eur Rev Med Pharmacol Sci. 2020;24(18):9698‐9704. [DOI] [PubMed] [Google Scholar]
- 18. Czernichow S, Beeker N, Rives‐Lange C, et al. Obesity doubles mortality in patients hospitalized for severe acute respiratory syndrome coronavirus 2 in Paris hospitals, France: a cohort study on 5,795 patients. Obesity. 2020;28(12):2282‐2289. [DOI] [PMC free article] [PubMed] [Google Scholar]
- 19. Eastment MC, Berry K, Locke E, et al. BMI and outcomes of SARS‐CoV‐2 among US veterans. Obesity. 2020. 10.1002/oby.23111. [DOI] [PMC free article] [PubMed] [Google Scholar]
- 20. FAI2R /SFR/SNFMI/SOFREMIP/CRI/IMIDIATE consortium and contributors . Severity of COVID‐19 and survival in patients with rheumatic and inflammatory diseases: data from the French RMD COVID‐19 cohort of 694 patients. Ann Rheum Dis. 2020;80:527–538. [DOI] [PMC free article] [PubMed] [Google Scholar]
- 21. Goyal P, Ringel JB, Rajan M, et al. Obesity and COVID‐19 in new York City: a retrospective cohort study. Ann Intern Med. 2020;173(10):855‐858. [DOI] [PMC free article] [PubMed] [Google Scholar]
- 22. Gu T, Mack JA, Salvatore M, et al. Characteristics associated with racial/ethnic disparities in COVID‐19 outcomes in an academic health care system. JAMA Netw Open. 2020;3(10):e2025197. [DOI] [PMC free article] [PubMed] [Google Scholar]
- 23. Gupta S, Hayek SS, Wang W, et al. Factors associated with death in critically ill patients with coronavirus disease 2019 in the US. JAMA Intern Med. 2020;180(11):1‐12. [DOI] [PMC free article] [PubMed] [Google Scholar]
- 24. Hajifathalian K, Kumar S, Newberry C, et al. Obesity is associated with worse outcomes in COVID‐19: analysis of early Data from new York City. Obesity. 2020;28(9):1606‐1612. [DOI] [PMC free article] [PubMed] [Google Scholar]
- 25. Halasz G, Leoni ML, Villani GQ, Nolli M, Villani M. Obesity, overweight and survival in critically ill patients with SARS‐CoV‐2 pneumonia: is there an obesity paradox? Preliminary results from Italy. Eur J Prev Cardiol. 2020. 10.1177/2047487320939675. [DOI] [PMC free article] [PubMed] [Google Scholar]
- 26. Hendren NS, de Lemos JA, Ayers C, et al. Association of Body Mass Index and age with Morbidity and mortality in patients hospitalized with COVID‐19: results from the American Heart Association COVID‐19 cardiovascular disease registry. Circulation. 2021;143(2):135‐144. [DOI] [PubMed] [Google Scholar]
- 27. Iannelli A, Bouam S, Schneck AS, et al. The impact of previous history of bariatric surgery on outcome of COVID‐19. A Nationwide medico‐administrative French study. Obes Surg. 2020. 10.1007/s11695-020-05120-z. [DOI] [PMC free article] [PubMed] [Google Scholar]
- 28. Ioannou GN, Locke E, Green P, et al. Risk factors for hospitalization, mechanical ventilation, or death among 10 131 US veterans with SARS‐CoV‐2 infection. JAMA Netw Open. 2020;3(9):e2022310. [DOI] [PMC free article] [PubMed] [Google Scholar]
- 29. Kabarriti R, Brodin NP, Maron MI, et al. Association of Race and Ethnicity with Comorbidities and survival among patients with COVID‐19 at an urban medical Center in new York. JAMA Netw Open. 2020;3(9):e2019795. [DOI] [PMC free article] [PubMed] [Google Scholar]
- 30. Kim SY, Yoo DM, Min C, Wee JH, Kim JH, Choi HG. Analysis of mortality and morbidity in COVID‐19 patients with obesity using clinical epidemiological data from the Korean Center for Disease Control & prevention. Int J Environ Res Public Health. 2020;17(24):9336. 10.3390/ijerph17249336. [DOI] [PMC free article] [PubMed] [Google Scholar]
- 31. Kim TS, Roslin M, Wang JJ, Kane J, Hirsch JS, Kim EJ. BMI as a risk factor for clinical outcomes in patients hospitalized with COVID‐19 in New York. Obesity. 2021;29(2):279‐284. [DOI] [PMC free article] [PubMed] [Google Scholar]
- 32. Klang E, Kassim G, Soffer S, Freeman R, Levin MA, Reich DL. Severe obesity as an independent risk factor for COVID‐19 mortality in hospitalized patients younger than 50. Obesity. 2020;28(9):1595‐1599. [DOI] [PMC free article] [PubMed] [Google Scholar]
- 33. Nakeshbandi M, Maini R, Daniel P, et al. The impact of obesity on COVID‐19 complications: a retrospective cohort study. Int J Obes. 2020;44(9):1832‐1837. [DOI] [PMC free article] [PubMed] [Google Scholar]
- 34. Nimkar A, Naaraayan A, Hasan A, et al. Incidence and risk factors for acute kidney injury and its effect on mortality in patients hospitalized from COVID‐19. Mayo Clin Proc Innov Qual Outcomes. 2020;4(6):687‐695. [DOI] [PMC free article] [PubMed] [Google Scholar]
- 35. Olivas‐Martínez A, Cárdenas‐Fragoso JL, Jiménez JV, et al. In‐hospital mortality from severe COVID‐19 in a tertiary care center in Mexico City; causes of death, risk factors and the impact of hospital saturation. PLoS One. 2021;16(2):e0245772. [DOI] [PMC free article] [PubMed] [Google Scholar]
- 36. Palaiodimos L, Kokkinidis DG, Li W, et al. Severe obesity, increasing age and male sex are independently associated with worse in‐hospital outcomes, and higher in‐hospital mortality, in a cohort of patients with COVID‐19 in the Bronx, New York. Metabolism. 2020;108:154262. [DOI] [PMC free article] [PubMed] [Google Scholar]
- 37. Petrilli CM, Jones SA, Yang J, et al. Factors associated with hospital admission and critical illness among 5279 people with coronavirus disease 2019 in new York City: prospective cohort study. BMJ. 2020;369:m1966. [DOI] [PMC free article] [PubMed] [Google Scholar]
- 38. Rottoli M, Bernante P, Belvedere A, et al. How important is obesity as a risk factor for respiratory failure, intensive care admission and death in hospitalised COVID‐19 patients? Results from a single Italian Centre. Eur J Endocrinol. 2020;183(4):389‐397. [DOI] [PMC free article] [PubMed] [Google Scholar]
- 39. Schmidt M, Hajage D, Demoule A, et al. Clinical characteristics and day‐90 outcomes of 4244 critically ill adults with COVID‐19: a prospective cohort study. Intensive Care Med. 2021;47(1):60‐73. [DOI] [PMC free article] [PubMed] [Google Scholar]
- 40. Shah P, Owens J, Franklin J, et al. Demographics, comorbidities and outcomes in hospitalized Covid‐19 patients in rural Southwest Georgia. Ann Med. 2020;52(7):354‐360. [DOI] [PMC free article] [PubMed] [Google Scholar]
- 41. Tartof SY, Qian L, Hong V, et al. Obesity and mortality among patients diagnosed with COVID‐19: results from an integrated health care organization. Ann Intern Med. 2020;173(10):773‐781. [DOI] [PMC free article] [PubMed] [Google Scholar]
- 42. Yoshida Y, Gillet SA, Brown MI, et al. Clinical characteristics and outcomes in women and men hospitalized for coronavirus disease 2019 in New Orleans. Biol Sex Differ. 2021;12(1):20. [DOI] [PMC free article] [PubMed] [Google Scholar]
- 43. Moser JS, Galindo‐Fraga A, Ortiz‐Hernández AA, et al. Underweight, overweight, and obesity as independent risk factors for hospitalization in adults and children from influenza and other respiratory viruses. Influenza Other Respi Viruses. 2019;13(1):3‐9. [DOI] [PMC free article] [PubMed] [Google Scholar]
- 44. Yu H, Feng Z, Uyeki TM, et al. Risk factors for severe illness with 2009 pandemic influenza a (H1N1) virus infection in China. Clin Infect Dis. 2011;52(4):457‐465. [DOI] [PMC free article] [PubMed] [Google Scholar]
- 45. Kivimäki M, Shipley MJ, Bell JA, Brunner EJ, Batty GD, Singh‐Manoux A. Underweight as a risk factor for respiratory death in the Whitehall cohort study: exploring reverse causality using a 45‐year follow‐up. Thorax. 2016;71(1):84‐85. [DOI] [PMC free article] [PubMed] [Google Scholar]
- 46. Flegal KM, Kit BK, Orpana H, Graubard BI. Association of all‐cause mortality with overweight and obesity using standard body mass index categories: a systematic review and meta‐analysis. JAMA. 2013;309(1):71‐82. [DOI] [PMC free article] [PubMed] [Google Scholar]
- 47. Tobias DK, Hu FB. Does being overweight really reduce mortality? Obesity (Silver Spring). 2013;21(9):1746‐1749. [DOI] [PMC free article] [PubMed] [Google Scholar]
- 48. Public Health England . COVID‐19 vaccination first phase priority groups [Updated February 23, 2021]; 2021. https://www.gov.uk/government/publications/covid-19-vaccination-care-home-and-healthcare-settings-posters/covid-19-vaccination-first-phase-priority-groups. Accessed March 1, 2021.
- 49. Centers for Disease Control and Prevention . People with Certain Medical Conditions [Updated February 22, 2021]; 2021. https://www.cdc.gov/coronavirus/2019-ncov/need-extra-precautions/people-with-medical-conditions.html. Accessed March 1, 2021.
- 50. Razieh C, Zaccardi F, Davies MJ, Khunti K, Yates T. Body mass index and the risk of COVID‐19 across ethnic groups: analysis of UKbiobank. Diabetes Obes Metab. 2020;22(10):1953‐1954. [DOI] [PMC free article] [PubMed] [Google Scholar]
- 51. Gardiner J, Oben J, Sutcliffe A. Obesity as a driver of international differences in COVID‐19 death rates. Diabetes Obes Metab. 2021. 10.1111/dom.14357. [DOI] [PMC free article] [PubMed] [Google Scholar]
Associated Data
This section collects any data citations, data availability statements, or supplementary materials included in this article.
Supplementary Materials
Table S1. Quality assessment of the included cohort studies using the Newcastle‐Ottawa Scale
Figure S1. PRISMA flow diagram of the literature search and article selection
Figure S2. Forest plot of the relative risk of mortality for highest versus lowest categories of body mass index in COVID‐19 patients
Figure S3. Funnel plot to assess publication bias in studies comparing mortality between highest versus lowest categories of body mass index in COVID‐19 patients
Figure S4. The leave‐one‐out sensitivity analysis of the relative risk of mortality for highest versus lowest categories of body mass index in COVID‐19 patients with each study omitted individually one at a time
Data Availability Statement
The data that support the findings of this study are available from the corresponding author upon reasonable request.