Abstract
Understanding human disease, zoonoses and emergence is a global priority. A deep understanding of pathogen ecology and the complex inherent relationships at the agent–environment interface are essential to inform disease control and mitigation and to predict the next zoonotic pandemic. Here, we present the first analysis of social and environmental factors associated with human, zoonotic and emerging pathogen diversity at a global scale, controlling for research effort. Predictor–response associations were captured by generalized additive models. We used national level data to aid in policy development to inform control and mitigation. We show that human population density, land area, temperature and the human development index at the country level are associated with human, emerging and zoonotic pathogen diversity. Multiple models demonstrating society–agent–environment interactions demonstrate that social, environmental and geographical factors predict global pathogen diversity. The analyses demonstrate that weather variables (temperature and rainfall) have the potential to influence pathogen diversity.
Keywords: emerging diseases, environment, geodemography, humans, pathogen diversity, social impact, zoonotic diseases
1. INTRODUCTION
Infectious diseases are a leading threat to both human health and the global economy (Johnson et al., 2015). In a database of 335 emerging infectious disease (EID) events (defined as those caused by newly evolved strains of pathogens such as multi‐drug‐resistant pathogens or pathogens that have recently entered human populations for the first time or pathogens which have recently increased in incidence) between 1940 and 2004, more than 60% had a zoonotic origin (note that zoonotic pathogens were defined as pathogens that originated in non‐human animals) and events increased over time (Jones et al., 2008). Ovser time, we have seen the emergence of many novel pathogens such as severe acute respiratory syndrome coronavirus, H1N1 influenza, Ebola and Nipah virus (Morse et al., 2012; Murphy, 1998). Thirty new diseases including Legionnaires disease, acquired immune deficiency syndrome, hepatitis C, Nipah virus, Helicobacter pylori, severe acute respiratory syndrome, COVID‐19, avian influenza, several viral haemorrhagic fevers and bovine spongiform encephalopathy/variant Creutzfeldt‐Jakob disease have been reported in the last 50 years (Robin & Anthony, 2004). It is speculated that new infectious diseases could emerge anywhere across the globe at any time (Robin & Anthony, 2004), and the next human pandemic might have a zoonotic origin (Lancet, 2012) as evolution works on biodiversity to create novel pathogens.
Anthropogenic disturbances may play an important role in disease emergence and zoonoses. It has been argued that these disturbances primarily result from human incursions into pristine ecosystems and ecotones (Jones et al., 2013), and microorganisms often exploit such circumstances (Robin & Anthony, 2004); however, only limited information is available about the processes and actual facts of EIDs and zoonoses from wildlife globally. It is proposed that the interactions among ecological, biological and social processes in South East Asia enable microbes to exploit new ecological niches, leading to a high risk from emerging infectious diseases in this region (Coker et al., 2011). Rapid environment change and agricultural intensification have been described to play an important role in this phenomenon (Jones et al., 2013). On the contrary, it should also be noted that majority of the recurringly transmissible zoonotic pathogens (with an existing animal reservoir) come from domestic animals with rare occurrence from wildlife sources—except for a few specific diseases in which domiciliated animals such as rodents are the main reservoir hosts. Therefore, the demographic change in domestic animals might be an important factor associated with the emergence of zoonosis, and this needs to be investigated. Understanding the ecological interactions underlying emerging and zoonotic infectious diseases (Qi et al., 2020; Ward et al., 2020a, 2020b) is important for their mitigation and control (Johnson et al., 2015).
Not much is known, and we need to look at all interactions and dynamics for EID and zoonosis to develop a more comprehensive contextual and specific understanding. Rapid increase in food trade and human travel is believed to be some of the main drivers of emergence of pathogens (Kilpatrick & Randolph, 2012). Modelling the dynamic factors underlying infectious diseases can assist the development of disease prevention and control strategies (Heesterbeek et al., 2015). Policymakers will benefit from the generated quantitative evidence for decision‐making and public health policy formulation (Heesterbeek et al., 2015).
To date, disease models to understand the factors responsible for pathogen diversity are limited. There are no mechanistic analyses that capture pathogen (human, zoonotic and emerging) diversity at the society–environment interface and their non‐linear relationships. Predictive modelling using national data to inform country‐specific control programmes is also lacking. Jones and colleagues (Jones et al., 2008), using a global database, analysed 335 EID events reported between 1940 and 2004. However, only the ‘emerging infectious disease events’ data were modelled; the existing non‐linear relationships (between predictor and response variables) were not accounted for and a limited number of socioeconomic and environmental predictor variables were used for model building. Following this, the occurrence of 147 ‘emerging infectious disease events’ for wildlife zoonoses (or just zoonotic origins) was modelled using demographic and environment variables (Allen et al., 2017). However, this study also had some disadvantages as the ongoing linkage of all the diseases with animals could not be established. Biogeographic grouping patterns of 187 human infectious diseases have also been described (Murray et al., 2015).
Building on this previous research focussed on certain events/diseases, we conducted a novel cross‐sectoral assessment rigorously investigating the relative contributions of potential geodemographic, environmental and social factors on the diversity of human, zoonotic and emerging pathogens. Noteworthy among these factors are the driving forces fundamental for emergence of infectious diseases (Binder et al., 1999; Jones et al., 2008; Morens et al., 2010; Robin & Anthony, 2004). A deep understanding of pathogen ecology, as well as the complex inherent relationships at the agent–environment interface, is essential to inform disease control and mitigation and to predict the next pandemic zoonosis. Public health measures are important barriers to disease emergence and zoonoses (Lindgren et al., 2012; Mitchell, 2000). Therefore, the effects of healthcare facilities and expenditure on health, research and development on pathogen diversity were also explored.
We would also like to stress and to make the reader aware of the various uncertainties and controversies surrounding the ontologies used in this and in previous studies conducted on this topic. As per the Joint WHO/FAO Expert Committee on Zoonoses, zoonoses are defined as ‘those diseases and infections which are naturally transmitted between vertebrate animals and man (WHO/FAO, 1959)’. However, even the WHO uses different definitions of the term ‘zoonosis’. For example, these are two other—and very different—definitions of zoonoses used by WHO: (a) ‘A zoonosis is any disease or infection that is naturally transmissible from vertebrate animals to humans’ and (b) that ‘A zoonosis is an infectious disease that has jumped from a non‐human animal to humans’ (https://www.who.int/news‐room/fact‐sheets/detail/zoonoses). This has created a difference in opinion regarding the infectious agents that should be considered as zoonotic pathogens. For example, some people believe that species‐jumping or just zoonotic origin pathogens such as HIV or novel coronavirus (https://www.who.int/news‐room/fact‐sheets/detail/zoonoses) classified as zoonotic by the WHO should be considered non‐zoonotic pathogens because these pathogens are currently not transmitted between non‐human vertebrates and humans. In the current and other studies (Taylor et al., 2001; Woolhouse & Gowtage‐Sequeria, 2005), the standard definition of the WHO (WHO/FAO, 1959) for infectious agent classification was used, whereas Jones et al. (2008) coined a different definition to categorize pathogens as zoonotic (i.e., pathogens that originated in non‐human animals). Therefore, these modelling studies should be carefully interpreted and compared cautiously, due to differences in the ontologies used for zoonotic or emerging pathogens. Note that the results of our study might have been different if we had only considered the recurringly transmissible pathogens (requiring an animal reservoir for maintenance) between humans and non‐human vertebrates as zoonotic pathogens.
Lastly, the zoonotic or emerging pathogens in this study were classified as described in the methods. The isolation of these organisms from different hosts/countries only describes their zoonotic and emerging potential; some of these might not actually be emerging or zoonotic in these specific countries.
2. METHODS
2.1. Microbe–country data set
A species–location interactions data set developed by Wardeh et al. (2015) was used to determine viral, bacterial, parasitic and fungal microbes isolated from vertebrate hosts in different countries. The data set used in the analyses contained 13,892 unique microbe–country interactions (Appendix S1, p 130–408). Full details of microbe‐country data set development are in the (Appendix S1, p 3). Note that there might be reporting bias due to factors such as difference in capacities in different countries and research focus oriented to prior decisions on risk.
2.2. Human, zoonotic and emerging agents
Initially, we classified all microbes into human, zoonotic and emerging agents as reported by Taylor and colleagues (Taylor et al., 2001), and Woolhouse and Gowtage‐Sequeria (Woolhouse & Gowtage‐Sequeria, 2005). Zoonotic pathogens were classified as per the World Health Organization (WHO/FAO, 1959), as ‘diseases and infections that are naturally transmitted between vertebrate animals and humans’.
However, species such as HIV that are no longer transmitted between humans and animals were not considered zoonotic (Taylor et al., 2001). Emerging pathogens were defined as those ‘that have appeared in a human population for the first time or have occurred previously but are increasing in incidence or expanding into areas where they have not previously been reported, usually over the last 20 years’ (IOM, 1992). Human agents were defined as previously reported infectious human pathogens (Taylor et al., 2001) plus additional microbes reported to have a human host (Wardeh et al., 2015). The data set also included human/emerging/zoonotic agents that might not have been presented or reported in human hosts or have demonstrated their zoonotic/emerging potential in a given country but could infect humans and have been demonstrated to be zoonotic/emerging in some other parts of the world. This data set also had information about the microbe type (i.e., whether they were viruses, bacteria, parasites or fungi).
2.3. Country‐specific parameters
We examined published and official data and compiled information for 49 country‐specific geodemographic, social, trade and environmental factors (Appendix S1, pp 4–5).
2.4. Pathogen–country interactions and country‐specific parameters
The unique pathogen–country interactions data were merged with the country‐specific variables to construct the analytical data set. The final data set had information about country‐specific parameters and the numbers of human, emerging, zoonotic and total pathogens isolated from different countries (Appendix S1, pp 6–46).
2.5. Missing data
Initially, we compiled information for 224 countries for 49 variables, but because of a lack of available information the following countries were excluded: Anguilla; Antarctica; Aruba; Bonaire, Sint Eustatius and Saba; British Virgin Islands; Cayman islands; Cook Islands; Curacao; Falkland Islands; Faroe Islands; French Guiana; French Polynesia; Greenland; Guadeloupe; Guam; Isle of Man; Macao; Martinique; Mayotte; Montserrat; New Caledonia; Niue; Northern Mariana Islands; Palestinian territory; Reunion; Saint Helena; Saint Martin; Taiwan; Turks and Caicos Islands; US Virgin Islands; United States Minor Outlying Islands; Wallis and Futuna; and the Channel Islands. The final data set (for the initial modelling) contained information for 190 countries (Appendix S1, pp 6–46).
2.6. Predictors and outcome
We used the country‐specific parameters (Appendix S1, pp 4–5) as key predictors. Three host–pathogen‐associated outcomes were explored: zoonotic emerging and human pathogen diversity at the country level, where the zoonotic/emerging/human pathogen diversity was defined as the total number of different zoonotic/emerging/human pathogens reported from any given country.
2.7. Statistical analysis
Descriptive analyses conducted included the creation of histograms and scatter plots of predictors with outcomes. Data were tested for the assumptions of linearity and normality. A variable was log‐transformed if the assumptions of normality were not met (Appendix S1, p 47). We also detected non‐error, non‐representative outliers (values >1.5‐fold interquartile range) in some predictor variables in the data (original or log‐transformed). These outliers were treated using winsorization, and all further analyses were conducted both using the original and the winsorized data set.
2.7.1. Generalized additive model (GAM)
We built three separate models for the response variables of zoonotic, emerging and human pathogen diversity using both the original and winsorized data. Because of non‐linear associations between some predictors and the outcomes, we compared additive models using non‐linear splines with linear models and retained the model in which the data were a significantly better fit and had a lower Akaike information criterion value.
A correlation matrix was then generated (separately for data with outliers and winsorized data) among the predictor variables to test for collinearity. Initially, only one predictor was retained for the multivariable models from among the predictors having a Pearson correlation coefficient >0.90 (Appendix S1, pp 48–49). From these variables, final multivariable models were constructed. We followed a forward stepwise approach and retained variables with p < .001, followed by retesting of all the variables with p < .25 and all non‐significant variables. A final multivariable model was also re‐tested by individually replacing a non‐linear spline variable with a linear variable and retaining the model in which the data fitted significantly better and had a lower Akaike information criterion value.
Statistical analyses were conducted in the R statistical program (R statistical package version 3·4·0, R Development Core Team [2015], http://www.r‐project.org). We used the parametric function ‘linear’ and non‐parametric function ‘s spline (thin plate regression spline fit)’ to fit the predictor variables. The function ‘ti spline’ was used to determine significant interactions among the combined parametric and non‐parametric response variables. The GAM model fitting separated the linear trend of predictor variables from any other non‐parametric association to determine significance of smoothing variables with non‐linear patterns. The final models were examined for concurvity (a non‐parametric analogue of multicollinearity), and model diagnostics were also examined.
2.8. Controlling for research effort
To control for research effort, we included gross domestic expenditure on research and development (GERD in 000s US dollars) of countries into all the analytic models. All the non‐significant variables were further re‐tested in the models.
2.9. Prediction of the expected response
The GAM models were used to predict the expected response variable using all the available data. In brief, we used data from all 224 countries (for predictions; Appendix S1, pp 50–71), wherever available for all the significant predictors reported in the GAM models.
3. RESULTS
We examined the country data set described above and found a median of 26 (range 1–858) microorganisms, 17 (1–297) human microorganisms, 11 (1–190) zoonotic pathogens and 11 (range 1–94) emerging human pathogens per country. Descriptive analyses are presented in the (Appendix S1, pp 72–77). After excluding variables with a Pearson correlation coefficient >0.90, a total of 28 predictor variables were included in multivariable models (Appendix S1, pp 48–49).
3.1. Generalized additive modelling
In total, all the predictor variables included in the GAM explained 74.8%–87.2% of the deviance in the different models.
3.1.1. Zoonotic pathogen diversity
The logarithm of land area, human development index, logarithm of human population density, logarithm of mean annual temperature (average), logarithm of exports percentage of gross domestic product (GDP) and forest area percentage were associated with zoonotic pathogen diversity Table 1, Figure 1). There were significant interactions between the human development index and the logarithm of mean annual temperature (average), as well as between the human development index and the logarithm of land area (Figure 1).
TABLE 1.
Generalized additive models of zoonotic pathogen diversity (original data, outcome—log number of zoonotic pathogens) reported from different countries
| Variable | Estimate | SE | t Value | Pr(>|t|) |
|---|---|---|---|---|
| Model 1 (zoonotic pathogen diversity, uncontrolled research effort) | ||||
| Parametric coefficients | ||||
| Intercept | 0.80 | 0.38 | 2.08 | 0.04 |
| Log mean annual temperature (average) | Variable involved in interaction | |||
| Smoothed terms | ||||
| Other significant terms and interactions are presented in Figure 1. | ||||
| Model parameters | R‐square·(adjusted) = .71, Deviance explained = 74.8%, Scale estimate = 0.46, n = 152 | |||
| Model 2 (zoonotic pathogen diversity, controlled research effort) | ||||
| Parametric coefficients | ||||
| Intercept | 2.74 | 0.058 | 46.85 | <0.001 |
| Smoothed terms | ||||
| Significant terms are presented in Figure 2. | ||||
| Model Parameters | R‐square adjusted = .76, Deviance explained = 77.3%, Scale estimate = 0.38, n = 111 | |||
FIGURE 1.
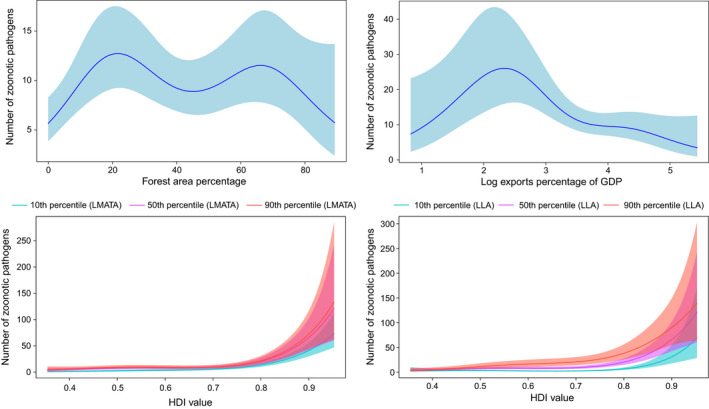
Smoothed curves of the additive effect to the estimated number of zoonotic pathogens (original data–uncontrolled research effort) for the individual environmental and social parameters in the generalized additive model. Shaded areas represent 95% confidence intervals. Plots showing the combined effect of the linear and non‐parametric contributions, as well as significant interactions among smoothed terms, are presented. p‐value for all variables <.001. LLA, Log land area; LMATA, Log mean annual temperature average
After controlling for research effort, only the logarithm of land area, logarithm of human population density, forest area percentage and the research effort (log GERD in US dollars) remained as significant predictors (Table 1, Figure 2).
FIGURE 2.
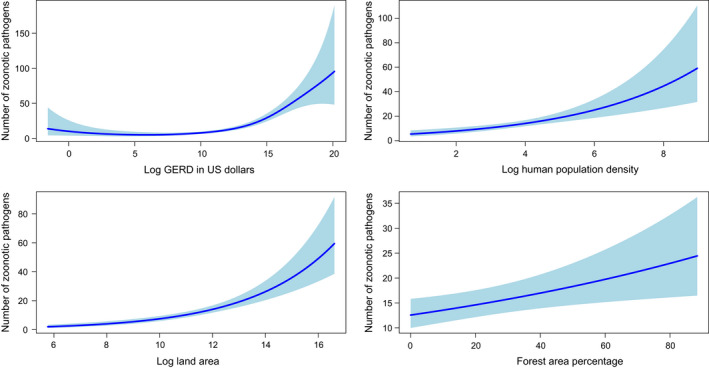
Smoothed curves of the additive effect to the estimated number of zoonotic pathogens (original data–controlled for research effort) for the individual environmental and social parameters in the generalized additive model. Shaded areas represent 95% confidence intervals. Plots showing the combined effect of the linear and non‐parametric contributions are presented. The values in axis legends represent estimated degrees of freedom. p‐value for all variables <.001
Additional results, including the analysis of winsorized data, are presented in the (Appendix S1, pp 78–87).
3.1.2. Emerging pathogen diversity
The GAM showed that emerging pathogen diversity is associated with the logarithm of human population density, agriculture land percentage, logarithm of land area, human development index value, national biodiversity index, longitude and the logarithm of sheep population (Table 2, Figure 3).
TABLE 2.
Generalized additive models of emerging pathogen diversity (outcome—log number of emerging pathogens) reported from different countries
| Variable | Estimate | SE | t Value | Pr(>|t|) |
|---|---|---|---|---|
| Model 3 (emerging pathogen diversity, uncontrolled research effort) | ||||
| Parametric coefficients | ||||
| Intercept | –5.65 | 0.70 | –8.06 | <0.001 |
| Log human population density | 0.51 | 0.05 | 10.50 | <0.001 |
| Agri land percentage | –0.005 | 0.002 | –2.01 | 0.04 |
| Log land area | 0.51 | 0.04 | 11.64 | <0.001 |
| Smoothed terms | ||||
| Significant terms and interactions are presented in Figure 3. | ||||
| Model parameters | R‐square·(adjusted) = .77, Deviance explained = 79.8%, Scale estimate = 0.23, n = 141 | |||
| Model 4 (emerging pathogen diversity, controlled research effort) | ||||
| Parametric coefficient | ||||
| Intercept | –4.93 | 0.89 | –5.54 | <0.001 |
| Log human population density | Variable involved in interaction | |||
| Log land area | Variable involved in interaction | |||
| Longitude | Variable involved in interaction | |||
| Longitude: log human population density | Interaction effect, see Figure 4. | |||
| Smoothed terms | ||||
| Significant terms and interactions are presented in Figure 4. | ||||
| Model parameters | R‐square adjusted = .83, Deviance explained = 86.8%, Scale estimate = 0.16, n = 104 | |||
FIGURE 3.
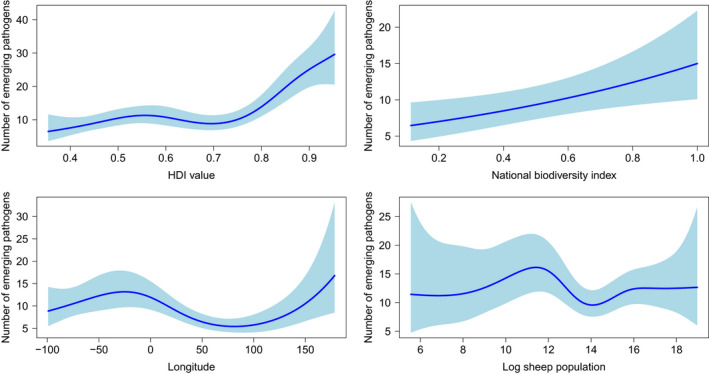
Smoothed curves of the additive effect to the estimated number of emerging pathogens (original data–uncontrolled research effort) for the individual environmental and social parameters in the generalized additive model. Shaded areas represent 95% confidence intervals. Plots showing the combined effect of the linear and non‐parametric contributions are presented. p‐value for all variables <.001 except for national biodiversity index (p = .01) and logarithm of sheep population (p = .037)
After controlling for research effort, emerging pathogen diversity was associated with the logarithm of human population density, logarithm of land area, human development index value and the logarithm of mean annual temperature average (Table 2, Figure 4). Further, significant interaction effects among the human development index value and the logarithm of land area, longitude, and the logarithm of human population density, human development index value, and the logarithm of mean annual temperature average, logarithm of mean annual temperature average and death rate per 1,000 people are reported (Figure 4). Additional results, including analysis of the winsorized data, are presented in the (Appendix S1, pp 88–106).
FIGURE 4.
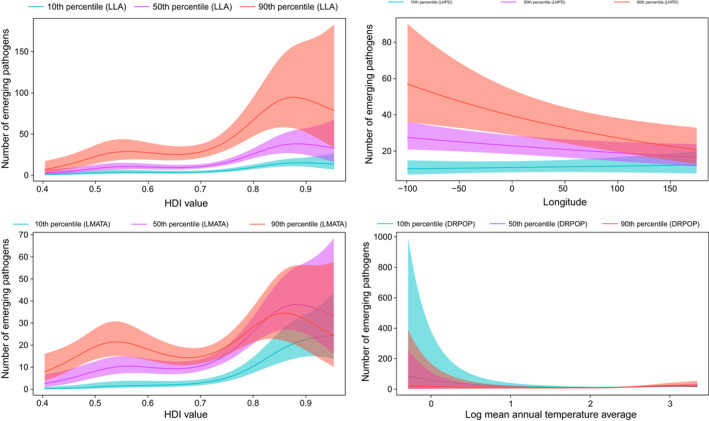
Smoothed curves of the additive effect to the estimated number of emerging pathogens (original data–controlled research effort) for the individual environmental and social parameters in the generalized additive model. Shaded areas represent 95% confidence intervals. Plots showing the significant interactions among smoothed terms are presented. p‐value for all variables <.01 except for interaction effects longitude and logarithm of human population density (p = .03). DRPOP, Death rate per 1,000 people; LHPD, Log human population density; LLA, Log land area; LMATA, Log mean annual temperature average
3.1.3. Human pathogen diversity
The GAM showed a linear relationship of human pathogen diversity with the logarithm of human population density and logarithm of mean annual temperature average. Human pathogen diversity was also associated with the human development index value and national rainfall index (Table 3, Figure 5). Further, significant interaction effects among the human development index value and the logarithm of human population density, the human development index value and the logarithm of land area, the human development index value and the logarithm of mean annual temperature average, national rainfall index, and the logarithm of human population density, human development index value and national rainfall index are reported (Table 3, Figure 5).
TABLE 3.
Generalized additive models of human pathogen diversity (outcome—log number of human pathogens) reported from different countries
| Variable | Estimate | SE | t Value | Pr(>|t|) |
|---|---|---|---|---|
| Model 5 (human pathogen diversity, uncontrolled research effort) | ||||
| Parametric coefficients | ||||
| Intercept | –8.91 | 0.63 | –14.12 | <0.001 |
| Log human population density | Variable involved in interaction | |||
| Log mean annual temperature average | Variable involved in interaction | |||
| Log land area | Variable involved in interaction | |||
| Smoothed terms | ||||
| Significant terms and interactions are presented in Figure 5. | ||||
| Model parameters | R‐square adjusted = .82, Deviance explained = 85.0%, Scale estimate = 0.27, n = 153 | |||
| Model 6 (human pathogen diversity, controlled research effort) | ||||
| Parametric coefficients | ||||
| Intercept | –9.29 | 1.00 | –9.32 | <0.001 |
| Log mean annual temperature average | Variable involved in interaction | |||
| Log land area | Variable involved in interaction | |||
| Log human population density | Variable involved in interaction | |||
| Log GERD in US dollars | 0.05 | 0.03 | 1.47 | 0.14 |
| Log health expenditure | 0.71 | 0.22 | 3.27 | 0.002 |
| percentage GDP | ||||
| Smoothed terms | ||||
| Significant terms and interactions are presented in Figure 6. | ||||
| Model parameters | R‐square adjusted = .79, Deviance explained = 82.4%, Scale estimate = 0.28, n = 100 | |||
Abbreviations: GDP, gross domestic product; GERD, gross domestic expenditure on research and development.
FIGURE 5.
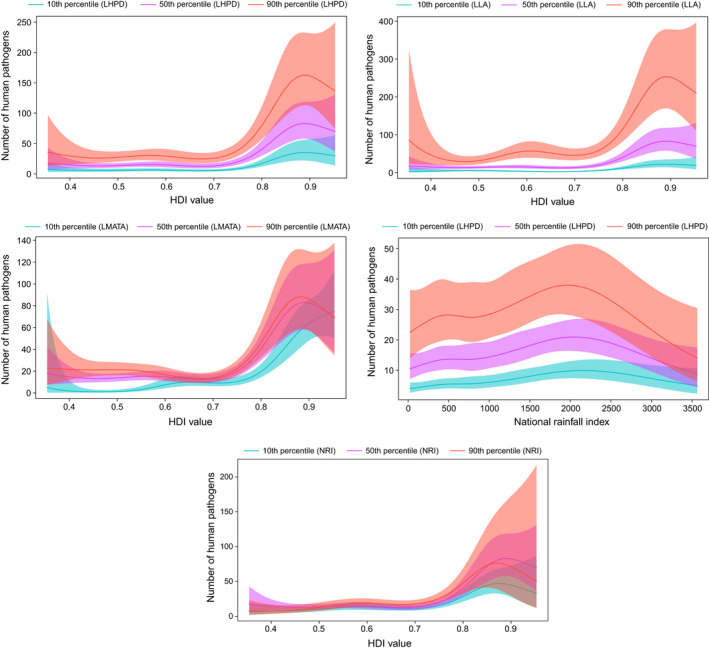
Smoothed curves of the additive effect to the estimated number of human pathogens (original data–uncontrolled research effort) for the individual environmental and social parameters in the generalized additive model. Shaded areas represent 95% confidence intervals. Plots showing the significant interactions among smoothed terms are presented. p‐value for all variables <.001 except for interaction effect human development index value and national rainfall index (p = .03). LHPD, Log human population density; LLA, Log land area; LMATA, Log mean annual temperature average; NRI, National rainfall index
After controlling for research effort, the logarithm of mean annual temperature average, logarithm of land area and logarithm of human population density had a linear association with human pathogen diversity (Table 3). The human development index value and the logarithm of health expenditure per cent GDP were also associated with human pathogen diversity (Figure 6). In addition, significant interaction effects among the human development index value and the logarithm of human population density, the human development index value and the logarithm of mean annual temperature average, the human development index value and the logarithm of land area, national rainfall index and logarithm of mean annual temperature average, national rainfall index and logarithm of land area, logarithm of GERD in US dollars and logarithm of human population density, and logarithm of GERD in US dollars and logarithm of land area are presented (Figure 6). Additional results, including analysis of the winsorized data, are presented in the (Appendix S1, pp 107–121).
FIGURE 6.
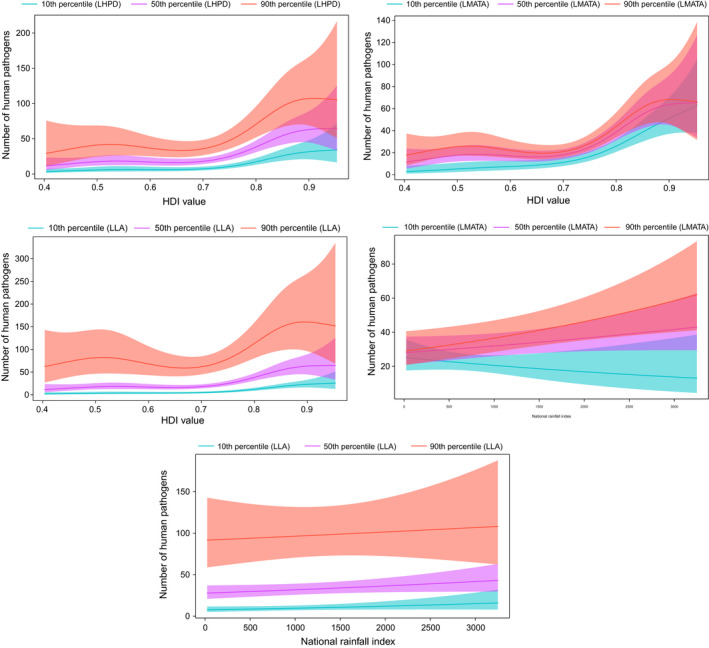
Smoothed curves of the additive effect to the estimated number of human pathogens (original data–controlled research effort) for the individual environmental and social parameters in the generalized additive model. Shaded areas represent 95% confidence intervals. Plots showing the significant interactions among smoothed terms are presented. p‐value for all variables <.01 except for the interaction effect national rainfall index and logarithm of mean annual temperature average (p = .04). LHPD, Log human population density; LLA, Log land area; LMATA, Log mean annual temperature average
3.2. Prediction of the expected response
The predictive values of the response variable for all the GAM models are shown in the (Appendix S1, pp 108–112). A global richness map of pathogen diversity in different countries is shown in Figure 7. The analysis indicates high pathogen diversity in many countries of Latin and North America, Asia, Australia and Europe (Appendix S1, pp 122–126).
FIGURE 7.
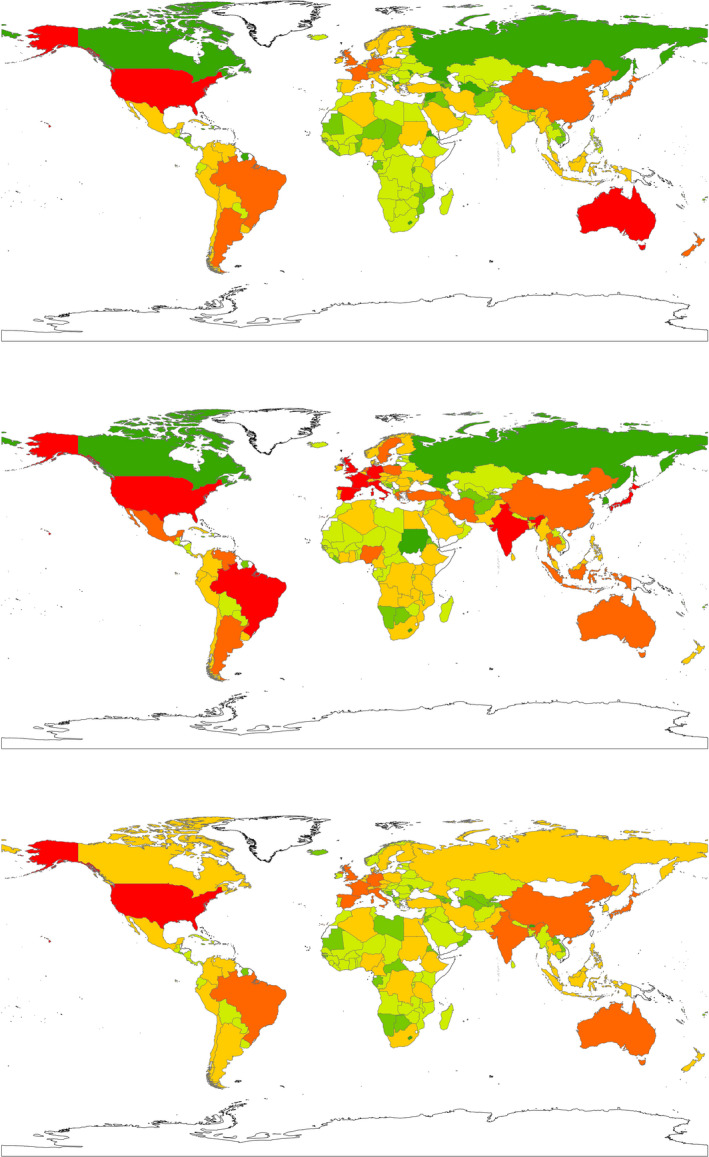
Predicted global richness map of pathogen diversity in different countries—original data (from top to bottom): (a) zoonotic pathogen diversity; (b) emerging pathogen diversity; (c) human pathogen diversity
4. DISCUSSION
We conclude that geodemographic, environmental and social factors to be significant predictors of zoonotic/emerging/human pathogen diversity. We believe that this analysis will help our understanding of the diversity of human, zoonotic and emerging pathogens as well as the associated global risk factors. The data generated are valuable for similar investigations in the future. Overall, we found a large range in the number of human, zoonotic and emerging pathogens reported from different countries. Lack of uniformity is likely due to differences in environmental, social and geographical factors at the country level, as well as potential differences in reporting.
We used national level data in this study, so any country could use these models after collecting the desired data for their own policy development and to inform their control or mitigation actions. However, these models do not account for subnational variations; therefore, the results should be carefully interpreted for countries that have large subnational differences in geodemography, environment and societal characteristics. We also controlled for research effort to produce unbiased results; however, a certain level of uncertainty should be expected in the methods and outcomes. We believe gross domestic expenditure on research and development (GERD) per country to be a more appropriate proxy for controlling for research effort compared to a previously reported study (Jones et al., 2008) that accounted for these biases by quantifying reporting effort in an international journal (JID). The latter is biased; for example, scientists from non‐English speaking countries are likely to have published their research in their native language journals. Many countries or institutes might have not published their research. GERD is a less biased representation of a country's research effort because laboratory support is more likely to translate into the number of pathogens reported from that country. GAM models indicated higher number of emerging pathogens (uncontrolled research effort) for countries in the longitude range of −50.0° to 0° and ≥150°. After controlling for research effort, countries in a longitude range of −100° to −30.0° (North and South American countries) and having high human population density were found to report a higher number of zoonotic pathogens. Although only marginally significant, higher number of emerging pathogens were noted in the lower latitudes. The potential effect of proximity to the equator and hemisphere needs to be further investigated.
Certain variations were recorded in the analysis of winsorized data. For example, additional significant predictors—such as log mean annual temperature average, HDI value and longitude—were also associated with zoonotic pathogen diversity (after controlling for research effort); and the variable forest area percentage became non‐significantly associated with zoonotic pathogen diversity (after controlling for research effort). After controlling for research effort, the predictors for emerging pathogen diversity (original and winsorized data) were similar except that the log health expenditure per cent GDP was additionally associated with emerging pathogen diversity (winsorized data).
We accounted for non‐linear relationships and used 49 socioeconomic and environmental variables during model development. By using pathogen biodiversity rather than EID events as our response variable, we included unknown or future disease emergence.
We found human population density, land area, mean annual temperature (average) and human development index value to be associated with the overall diversity of human, emerging and zoonotic pathogens, and this association is not limited to EID events as reported previously (Jones et al., 2008). The national rainfall index was a significant predictor in the models of human and zoonotic pathogen diversity, but had no role for emerging pathogen diversity. Our analyses indicate that many socioeconomic and environmental factors are equally important for zoonotic and human pathogen diversity, as reported for disease emergence.
Our analysis shows the national biodiversity index as a significant predictor in emerging pathogen diversity models, as for EID events reported by Jones and colleagues (Jones et al., 2008). We also report forest area percentage to be associated with zoonotic pathogen diversity. Forests are home to terrestrial animal biodiversity (Brockerhoff et al., 2017), and deforestation and forest incursions have been linked to zoonosis (Wolfe et al., 2005). We found that the diversity of emerging human pathogens was additionally correlated with longitude and death rate per 1,000 people. This needs to be further explored.
As far as we are aware, environmental and social factors linked to the overall human, and zoonotic pathogen diversity have not been explored previously. In addition to human population density, land area, mean annual temperature (average) and the human development index value, we report many other factors associated with zoonotic diversity, including, for example, forest area percentage and export percentage of GDP. Similarly, human pathogen diversity was associated with log health expenditure percentage GDP and national rainfall index.
Rigorous methodology was followed to compile information related to the pathogen database. However, the main limitation to this study is that the information is still incomplete. Some of the reasons included underreporting of a number of previously known and novel undiscovered pathogens, particularly in less developed countries, and for some of the predictor variables, the latest data available had missing values because recent data had not been updated. The geographical and environmental variations within a country also remain unaccounted for. Influence of different seasons on the pathogen diversity also remains unaccounted for. Lack of predictor data also prevented us from predicting pathogen diversity for all countries across the globe. Lack of data for some countries prevented control for research effort. Further, we could not test this data at the subspecies level, so there could be drastic variations at this level, particularly for disease emergence. However, we believe that availability of our data assist the countries where no predictor/response data are currently available to develop so that the desired information is available for analysis using our models. This will help overcome the limitations associated with incomplete data in the future.
Overall, social and environmental factors and geography are significantly associated with global pathogen diversity. Finally, our analyses demonstrate that weather variables (temperature and rainfall) have the potential to influence pathogen diversity. Further research is required to assess the long‐term impact of these variables. Similarly, the impact of climate change on pathogen diversity is a topic that needs to be researched. We believe future models based on simultaneous testing of host, agent and environment characteristics for prediction will shed more light on disease emergence and zoonoses.
We conclude that weather variables, as well as forest and biodiversity conservation, have the potential to influence human, zoonotic and emerging pathogen diversity in the near future.
CONFLICT OF INTEREST
The authors declare no conflicts of interest.
ETHICAL APPROVAL
Informed consent for collection of epidemiological data was not required, as these data were already coded and available in the public domain. No identifiable personal information was used in this study.
Supporting information
Appendix S1
ACKNOWLEDGEMENTS
The authors thank the Department of Education and Training, Australian Government for providing the 2018 Endeavour Research Fellowship to the primary author to conduct this research.
Singh BB, Ward MP, Dhand NK. Geodemography, environment and societal characteristics drive the global diversity of emerging, zoonotic and human pathogens. Transbound Emerg Dis. 2022;69:1131–1143. 10.1111/tbed.14072
DATA AVAILABILITY STATEMENT
The analysed data are available along with the manuscript. Sources of the raw data used in the analysis have been cited.
REFERENCES
- Allen, T. , Murray, K. A. , Zambrana‐Torrelio, C. , Morse, S. S. , Rondinini, C. , Di Marco, M. , Breit, N. , Olival, K. J. , & Daszak, P. (2017). Global hotspots and correlates of emerging zoonotic diseases. Nature Communications, 8(1), 1124. 10.1038/s41467-017-00923-8 [DOI] [PMC free article] [PubMed] [Google Scholar]
- Binder, S. , Levitt, A. , Sacks, J. , & Hughes, J. (1999). Emerging infectious diseases: Public health issues for the 21st century. Science, 284(5418), 1311–1313. 10.1126/science.284.5418.1311 [DOI] [PubMed] [Google Scholar]
- Brockerhoff, E. G. , Barbaro, L. , Castagneyrol, B. , Forrester, D. I. , Gardiner, B. , González‐Olabarria, J. R. , Lyver, P. O'. B. , Meurisse, N. , Oxbrough, A. , Taki, H. , Thompson, I. D. , van der Plas, F. , & Jactel, H. (2017). Forest biodiversity, ecosystem functioning and the provision of ecosystem services. (Editorial) (Report). Biodiversity and Conservation, 26(13), 3005–3035. 10.1007/s10531-017-1453-2 [DOI] [Google Scholar]
- Coker, R. J. , Hunter, B. M. , Rudge, J. W. , Liverani, M. , & Hanvoravongchai, P. (2011). Emerging infectious diseases in southeast Asia: Regional challenges to control. The Lancet, 377(9765), 599–609. 10.1016/S0140-6736(10)62004-1 [DOI] [PMC free article] [PubMed] [Google Scholar]
- Heesterbeek, H. , Anderson, R. M. , Andreasen, V. , Bansal, S. , De Angelis, D. , Dye, C. , Eames, K. T. D. , Edmunds, W. J. , Frost, S. D. W. , Funk, S. , Hollingsworth, T. D. , House, T. , Isham, V. , Klepac, P. , Lessler, J. , Lloyd‐Smith, J. O. , Metcalf, C. J. E. , Mollison, D. , Pellis, L. , … Viboud, C. (2015). Modeling infectious disease dynamics in the complex landscape of global health. Science, 347(6227), aaa4339. 10.1126/science.aaa4339 [DOI] [PMC free article] [PubMed] [Google Scholar]
- IOM (1992). Institute of Medicine (US) Committee on Emerging Microbial Threats to Health. In Shope R., Lederberg J., & S. C. Oaks, Jr. (Eds.). Emerging infections: Microbial threats to health in the United States. Washington (DC), USA: National Academies Press. [PubMed] [Google Scholar]
- Johnson, P. T. J. , de Roode, J. C. , & Fenton, A. (2015). Why infectious disease research needs community ecology. Science, 349(6252), 1259504. 10.1126/science.1259504 [DOI] [PMC free article] [PubMed] [Google Scholar]
- Jones, B. A. , Grace, D. , Kock, R. , Alonso, S. , Rushton, J. , Said, M. Y. , McKeever, D. , Mutua, F. , Young, J. , McDermott, J. , & Pfeiffer, D. U. (2013). Zoonosis emergence linked to agricultural intensification and environmental change. Proceedings of the National Academy of Sciences of the United States of America, 110(21), 8399–8404. 10.1073/pnas.1208059110 [DOI] [PMC free article] [PubMed] [Google Scholar]
- Jones, K. E. , Patel, N. G. , Levy, M. A. , Storeygard, A. , Balk, D. , Gittleman, J. L. , & Daszak, P. (2008). Global trends in emerging infectious diseases. Nature, 451(7181), 990–993. 10.1038/nature06536 [DOI] [PMC free article] [PubMed] [Google Scholar]
- Kilpatrick, A. M. , & Randolph, S. E. (2012). Drivers, dynamics, and control of emerging vector‐borne zoonotic diseases. The Lancet, 380(9857), 1946–1955. 10.1016/S0140-6736(12)61151-9 [DOI] [PMC free article] [PubMed] [Google Scholar]
- Lancet, T. (2012). Zoonoses uncaged. The Lancet, 380(9857), 1882. 10.1016/S0140-6736(12)62094-7 [DOI] [PubMed] [Google Scholar]
- Lindgren, E. , Andersson, Y. , Suk, J. E. , Sudre, B. , & Semenza, J. C. (2012). Monitoring EU emerging infectious disease risk due to climate change. Science, 336(6080), 418–419. 10.1126/science.1215735 [DOI] [PubMed] [Google Scholar]
- Mitchell, L. C. (2000). Changing patterns of infectious disease. Nature, 406(6797), 762–767. 10.1038/35021206 [DOI] [PubMed] [Google Scholar]
- Morens, D. M. , Folkers, G. K. , & Fauci, A. S. (2010). The challenge of emerging and re‐emerging infectious diseases. Nature, 463(7277), 122. 10.1038/nature08554 [DOI] [PMC free article] [PubMed] [Google Scholar]
- Morse, S. S. , Mazet, J. A. K. , Woolhouse, M. , Parrish, C. R. , Carroll, D. , Karesh, W. B. , Zambrana‐Torrelio, C. , Lipkin, W. I. , & Daszak, P. (2012). Prediction and prevention of the next pandemic zoonosis. The Lancet, 380(9857), 1956–1965. 10.1016/S0140-6736(12)61684-5 [DOI] [PMC free article] [PubMed] [Google Scholar]
- Murphy, F. (1998). Emerging zoonoses. Emerging Infectious Diseases, 4(3), 429–435. 10.3201/eid0403.980324 [DOI] [PMC free article] [PubMed] [Google Scholar]
- Murray, K. A. , Preston, N. , Allen, T. , Zambrana‐Torrelio, C. , Hosseini, P. R. , & Daszak, P. (2015). Global biogeography of human infectious diseases (ECOLOGY) (Report). Proceedings of the National Academy of Sciences of the United States of America, 112(41), 12746–12751. 10.1073/pnas.1507442112 [DOI] [PMC free article] [PubMed] [Google Scholar]
- Qi, H. , Xiao, S. , Shi, R. , Ward, M. P. , Chen, Y. , Tu, W. , Su, Q. , Wang, W. , Wang, X. , & Zhang, Z. (2020). COVID‐19 transmission in Mainland China is associated with temperature and humidity: A time‐series analysis. Science of the Total Environment, 728, 138778. 10.1016/j.scitotenv.2020.138778 [DOI] [PMC free article] [PubMed] [Google Scholar]
- Robin, A. W. , & Anthony, J. M. (2004). Social and environmental risk factors in the emergence of infectious diseases. Nature Medicine, 10(Suppl. 12), S70–S76. 10.1038/nm1150 [DOI] [PMC free article] [PubMed] [Google Scholar]
- Taylor, L. H. , Latham, S. M. , & Woolhouse, M. E. (2001). Risk factors for human disease emergence. Philosophical Transactions of the Royal Society of London. Series B: Biological Sciences, 356(1411), 983–989. 10.1098/rstb.2001.0888 [DOI] [PMC free article] [PubMed] [Google Scholar]
- Ward, M. P. , Xiao, S. , & Zhang, Z. (2020a). Humidity is a consistent climatic factor contributing to SARS‐CoV‐2 transmission. Transboundary and Emerging Diseases, 67(6), 3069–3074. 10.1111/tbed.13766 [DOI] [PMC free article] [PubMed] [Google Scholar]
- Ward, M. P. , Xiao, S. , & Zhang, Z. (2020b). The role of climate during the COVID‐19 epidemic in New South Wales, Australia. Transboundary and Emerging Diseases, 67(6), 2313–2317. 10.1111/tbed.13631 [DOI] [PMC free article] [PubMed] [Google Scholar]
- Wardeh, M. , Risley, C. , McIntyre, M. K. , Setzkorn, C. , & Baylis, M. (2015). Database of host‐pathogen and related species interactions, and their global distribution. Scientific Data, 2, 150049. 10.1038/sdata.2015.49 [DOI] [PMC free article] [PubMed] [Google Scholar]
- WHO/FAO (1959). JOINT WHO/FAO Expert Committee on Zoonoses. World Health Organization Technical Report Series, 58(169), 1–84. [PubMed] [Google Scholar]
- Wolfe, N. D. , Daszak, P. , Kilpatrick, A. M. , & Burke, D. S. (2005). Bushmeat hunting, deforestation, and prediction of zoonotic disease. Emerging Infectious Diseases, 11(12), 1822–1827. 10.3201/eid1112.040789 [DOI] [PMC free article] [PubMed] [Google Scholar]
- Woolhouse, M. E. J. , & Gowtage‐Sequeria, S. (2005). Host range and emerging and reemerging pathogens. (RESEARCH). Emerging Infectious Diseases, 11(12), 1842–1847. 10.3201/eid1112.050997 [DOI] [PMC free article] [PubMed] [Google Scholar]
Associated Data
This section collects any data citations, data availability statements, or supplementary materials included in this article.
Supplementary Materials
Appendix S1
Data Availability Statement
The analysed data are available along with the manuscript. Sources of the raw data used in the analysis have been cited.


