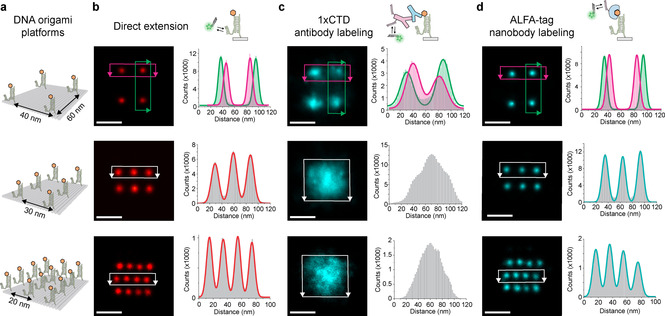
Figure 2.

Designer DNA origami platform for assessment of binder‐dependent spatial resolution. a) Schemes of DNA origami structures with positions of antigens (orange). b–d) Top row: Schemes for DNA‐PAINT imaging of antigen position (b), antibody positions bound to 1×CTD (c), and ALFA‐tag nanobody positions (d). DNA origami sum images of antigen positions (red, b), antibody positions (cyan, c), ALFA‐tag nanobody positions (cyan, d) and corresponding cross‐sectional histogram analysis. Solid lines are multi‐component Gaussian fits to data from the highlighted rectangular regions with the corresponding color scheme of the origami sum images on the left side to them. (n>100 for each structure). Scale bars: 50 nm.
