

Abstract
The diffusion of saturated and unsaturated hydrocarbons is of fundamental importance for many zeolite‐catalyzed processes. Transport of small alkenes in the confined zeolite pores can become hindered, resulting in a significant impact on the ultimate product selectivity and separation. Herein, intracrystalline light olefin/paraffin diffusion through the 8‐ring windows of zeolite SAPO‐34 is characterized by a complementary set of first‐principle molecular dynamics simulations, PFG‐NMR experiments, and pulse‐response temporal analysis of products measurements, yielding information at different length and time scales. Our results clearly show a promotional effect of the presence of Brønsted acid sites on the diffusion rate of ethene and propene, whereas transport of alkanes is found to be insensitive to the presence of acid sites. The enhanced diffusivity of unsaturated hydrocarbons is ascribed to the formation of favorable π–H interactions with acid protons, as confirmed by IR spectroscopy measurements. The acid site distribution is proven to be an important design parameter for optimizing product distributions and separations.
Keywords: acid sites, diffusion, molecular dynamics, olefins, zeolites
The influence of the acid site density on the diffusivities of alkanes and alkenes through the 8‐ring windows of SAPO‐34 was probed using a complementary set of ab initio MD simulations and experimental techniques (PFG‐NMR and TAP pulse‐response measurements). The presence of Brønsted acid sites was found to have a clear promotional effect on alkene diffusion but it does not influence alkane diffusion.
Introduction
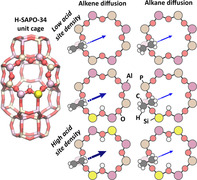
Product selectivity in zeolite‐catalyzed conversions is the result of a complex interplay of catalytic activity, stabilization of key intermediates and transport phenomena.[ 1 , 2 , 3 ] Once formed, the products need to diffuse away from the active centers. Quantifying adsorption and diffusion in the zeolite nanopores is very challenging due to the simultaneous occurrence of various phenomena at different length and time scales. An interesting case study where diffusion limitations were suggested to have a strong correlation with the ultimate product distribution, is the methanol‐to‐hydrocarbons (MTH) process on small‐pore zeolites like SAPO‐34.[ 3 , 4 , 5 , 6 , 7 , 8 , 9 , 10 ] The SAPO‐34 zeolite (CHA topology) consists of large elliptical cages that are connected by two double 6‐ring (d6r) units and six 8‐ring windows, through which diffusion of alkenes and alkanes can take place, as shown in Figure 1. Recently, evidence was given that controlling the acid site distribution may be an important design parameter for various catalytic processes.[ 11 , 12 , 13 ] Nevertheless, the precise influence of the acid site density and distribution on the transport properties in small‐pore zeolites is still unresolved.
Figure 1.
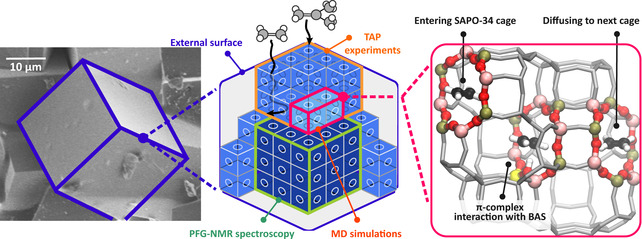
Schematic representation of a SAPO‐34 crystal particle. First‐principle MD simulations are used to study hopping events between adjacent cages, PFG‐NMR spectroscopy is used to estimate intracrystalline diffusivities, and TAP experiments probe diffusion at the outer layers of the crystal.
Pulsed‐field gradient nuclear magnetic resonance (PFG‐NMR) spectroscopy has proven to be one of the most powerful techniques to probe molecular diffusion of small hydrocarbons in zeolites.[ 13 , 14 , 15 , 16 , 17 , 18 ] Hedin et al. established a clear correlation between the size of the pore windows, the size of the diffusing alkenes and the measured self‐diffusivities. [14] Dai and co‐workers measured ethane and ethene diffusivities in SAPO‐34 crystals and observed that ethene diffusion is favored, however, the effect of acid site density was not investigated. [17] Several authors also indicated that propane transport is significantly higher activated than propene in narrow pore zeolites,[ 19 , 20 , 21 , 22 ] while other studies claimed that alkanes and alkenes exhibit similar diffusion characteristics.[ 14 , 23 , 24 ]
Furthermore, several theoretical studies addressed light olefin diffusion in small‐pore zeolites, mostly by performing force field molecular dynamics (MD) simulations.[ 25 , 26 , 27 , 28 , 29 , 30 ] Ethene and propene self‐diffusion coefficients in CHA zeolites have been extracted directly from the force field MD trajectories based on the Einstein relation.[ 31 , 32 , 33 ] However, aside from the zeolite pore confinement, also the host‐guest interactions with the local environment as well as the acid site density and distribution affect the transport of alkenes. Some of the present authors recently showed that force fields might be less accurate when predicting diffusion barriers in complex molecular environments containing active sites and that a first‐principle description is required to accurately account for the explicit interactions with the acid sites. [34]
In this work, we investigate the intracrystalline diffusion behavior of C2 and C3 alkanes and alkenes in SAPO‐34 zeolites with varying acid site density by a combination of first‐principle MD simulations, PFG‐NMR spectroscopy and Temporal Analysis of Products (TAP) pulse‐response experiments. Each technique yields specific information on the diffusion process at different scales (see Figure 1). First‐principle MD simulations allow to characterize interactions with the acid sites at the nanometer scale and examine individual hopping events between neighboring cages of the SAPO‐34 at operating conditions. PFG‐NMR experiments are conducted on large zeolite crystals of 20–30 μm to obtain information on the intracrystalline diffusivity of olefins and paraffins. Since the timescale of the observations is in the order of milliseconds, large zeolite crystals are a prerequisite to extract intracrystalline self‐diffusivities.[ 17 , 29 ] Finally, TAP experiments are conducted over commercial, micron‐sized H‐SAPO‐34 crystals [35] to probe other levels of complexities such as the prominent influence of surface barrier resistances or inhomogeneities in crystallite sizes.[ 36 , 37 , 38 , 39 , 40 ] By monitoring transient responses of probe molecules through an ensemble of crystallites, the TAP method is capable of capturing intrinsic adsorption and diffusion characteristics from the external surface into the outer layers of the SAPO‐34 crystals in the limit of low pore occupancy.
Results and Discussion
First, we assess the molecular mechanism behind the transport of ethene, ethane, propene and propane in the cages of SAPO‐34. As Ghysels et al. noted, diffusion is an activated process, which can be described as a hopping event between adjacent cages.[ 32 , 41 , 42 ] The actual crossing time for a hydrocarbon species is negligible compared to the residence time inside a single cage. To sample these rare events and extract activation barriers, the umbrella sampling (US) technique is applied (cf. Section S1.1 of the SI). This technique has previously proven its validity for studying catalysis and diffusion in zeolites.[ 34 , 43 , 44 , 45 , 46 ]
Free energy profiles for diffusion through the 8‐ring windows of SAPO‐34 are constructed along a pre‐defined collective variable, ξ, which uniquely defines the diffusion path of the hydrocarbon from one cage (ξ<0) through the ring center (ξ=0) into a neighboring cage (ξ>0) (Figure 2 and Figure S1 of the SI). Since all T sites of the CHA topology are equivalent, there are only four distinct crystallographic positions for the acid proton, three of which are situated on an 8‐ring window, while the other is located on a 6‐ring window. To probe the influence of acid sites located on the 8‐ring window, three zeolite models are considered containing either zero ((P+Al)/Si ratio ∞), one ((P+Al)/Si ratio 35) or two ((P+Al)/Si ratio 17) Brønsted acid sites (Figure 2). Note that alkene diffusivity is only influenced by acid sites located on the 8‐ring window through which the diffusion takes place, while acid sites introduced on a neighboring 6‐ring window have no significant impact (see Section S1.5 of the SI).
Figure 2.
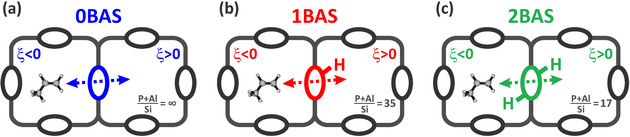
Three H‐SAPO‐34 zeolite models with varying acid site density used in the umbrella sampling (US) simulations. Diffusion is studied through an 8‐ring window containing a) no acid sites; b) a single acid site; c) two acid sites at opposite ring positions.
Figure 3 shows the free energy profiles for diffusion of the C2‐C3 alkenes and alkanes at 600 K, a relevant temperature for MTH conditions. Diffusion of C3 species is significantly more hindered compared to C2 species, which is completely in accordance with the larger size of the C3 adsorbates. The barriers for alkene diffusion show a large variation depending on the number of acid sites on the 8‐ring. In the absence of active sites, a barrier of 38 kJ mol−1 or 57 kJ mol−1 has to be overcome for ethene and propene, respectively. If a single Brønsted acid site is present on the 8‐ring, the barrier is reduced to 20 kJ mol−1 and 44 kJ mol−1, respectively. If the 8‐ring contains two acid sites, the diffusion barrier decreases even further to 10 kJ mol−1 or 34 kJ mol−1. In sharp contrast, the free energy profiles for alkane diffusion appear to be insensitive to the acid site density. The barriers for alkane hopping are characterized by minor fluctuations only and amount to approximately 40 kJ mol−1 for ethane and 68 kJ mol−1 for propane.
Figure 3.
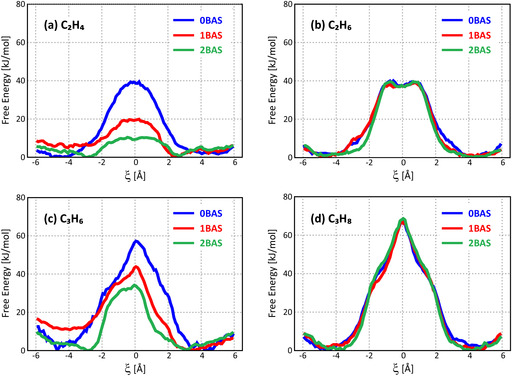
Free energy profile for a) ethene, b) ethane, c) propene, d) propane diffusion at 600 K through an 8‐ring window of SAPO‐34 containing 0, 1, or 2 BASs.
The discrepancy between alkane and alkene diffusion can be explained by the formation of a stabilizing π‐H interaction. While alkanes only exhibit weak van der Waals interactions with the zeolite wall upon adsorption, alkenes can coordinate with the acid site through the formation of an alkene π‐complex.[ 47 , 48 ] The acid site thus acts as a driving force to keep the alkene in the proximity of the 8‐ring. If the 8‐ring is decorated with acid sites, a free energy minimum for the alkene is obtained at a distance of 2.5 Å from the ring center, while this increases to about 4.0 Å in the absence of acid sites. Furthermore, during regular MD simulations, the alkene π‐complex is sampled during the majority of simulation time (cf. Section S1.7 of the SI), reflecting the high stability of this intermediate.
The existence of alkene π‐H interactions has been evidenced by performing FT‐IR spectroscopy measurements for ethene adsorption on H‐SAPO‐34 (cf. Section S3.2 of the SI). The obtained IR spectra for varying dosages of ethene (6 mbar, 40 mbar and 90 mbar) are shown in Figure 4. The spectrum for the pure H‐SAPO‐34 sample (black curve) shows a high frequency component at 3627 cm−1 (more abundant) and low frequency component at 3603 cm−1 indicating the presence of two families of Brønsted acid sites. [49] Upon interaction with varying coverages of ethene (colored curves), a substantial erosion of both peaks can be identified, while simultaneously a broad band with a maximum at around 3307 cm−1 is appearing, corresponding to the formation of π‐adducts with the acid sites. As expected in the case of SAPO materials, the observed downward shift is lower than for aluminosilicate zeolites, in agreement with their lower acidities. [50] At medium and high ethene coverages (red and blue curves), the appearance of two components at 3106 cm−1 and 2990 cm−1 can be assigned to the νasym(CH2)(B2u) and νsym,(CH2)(B1u) modes, testifying to the presence of some ethene in gas phase. Our results clearly identify the formation of stable alkene π‐complex intermediates which corroborates the findings of previous IR spectroscopy[ 51 , 52 , 53 ] studies as well as first‐principle calculations.[ 47 , 54 , 55 , 56 ] on different zeolite topologies.
Figure 4.
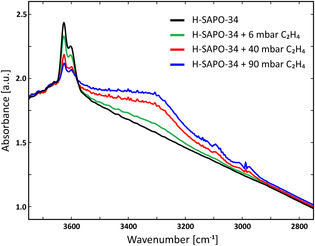
FT‐IR spectra of the H‐SAPO‐34 sample before (black curve) and after adsorption of increasing coverages of 6 mbar ethene (green curve), 40 mbar ethene (red curve), and 90 mbar ethene (blue curve) at 323 K.
The alkene hopping paths between neighboring cages are illustrated in Figure 5. For windows containing acid sites, the beneficial π‐complex interaction remains intact during the entire ring crossing, thus facilitating the transfer of alkenes. In case of one acid site, the alkene π‐complex interaction is broken upon entering the second cage and the acid site is restored to its position in the original cage. Due to the preference of a single acid site to reside in one particular cage, an asymmetric diffusion free energy profile is obtained and the backward diffusion barrier is lowered by about 5–10 kJ mol−1 as shown in earlier work. [34]
Figure 5.
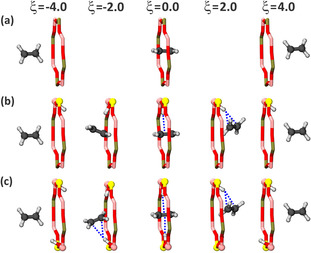
Snapshots of the ethene diffusion path through an 8‐ring a) without acid sites (0 BAS), b) with 1 acid site (1 BAS), and c) with two acid sites (2 BAS). Although the acid proton has a clear preference for one of the cages, the π‐complex interaction remains intact during the ring crossing.
To allow a proper comparison with the PFG‐NMR measurements taking place at lower temperature (vide infra), the free energy profiles for ethene and ethane diffusion through the different 8‐ring types have also been constructed at 300 K (cf. Section S1.4 in the SI). The trend that alkene diffusion is enhanced with increasing acid site densities while alkane diffusion is invariant for the number of acid sites present, remains valid at both low and high temperature. In general, the diffusion barriers are somewhat lower at 300 K than at 600 K, which has also been observed in a previous study. [34] However, as the kinetic energy of the guest molecules will also be lower, the overall diffusivity will, as expected, remain equal or decrease at 300 K.
Diffusion coefficients can be derived from the free energy profiles according to a random walk model and transition state theory as outlined in Section S1.8 of the SI. Alkane diffusion in SAPO‐34 is independent on the presence of acid sites and can take place through each of the six 8‐ring windows with equal probability. However, alkenes will show a clear preference to escape through windows containing acid sites. In common H‐SAPO‐34 catalysts—characterized by an (P+Al)/Si ratio ranging between 5 and 20,[ 3 , 6 , 57 ] corresponding on average to a density of 1–2 acid sites per cage—there is a very high probability that the majority of the cages will contain at least one 8‐ring decorated with an acid site. Consequently, the alkene diffusion probability is non‐uniform in the six directions and diffusion coefficients thus can only be estimated in the limit of a very low or high acid site density. The computationally determined alkene/alkane diffusivities are in reasonable agreement with the experimental values (see Section S1.8).
To validate the observation from first‐principle MD simulations that acid sites have a promotional effect on the diffusion of alkenes, while alkane diffusion remains unaltered, two types of experiments are performed to determine alkene and alkane diffusivities in H‐SAPO‐34. First, intracrystalline diffusion coefficients are measured by 1H PFG‐NMR spectroscopy. Three types of H‐SAPO‐34 samples with a similar crystal size of 20–30 μm but a different amount of Brønsted acid sites of 0.65–1.13 mmol g−1 were synthesized. According to previous PFG‐NMR studies,[ 14 , 17 ] a low self‐diffusivity of propene in SAPO‐34 zeolites in the order of 10−16 m2 s−1 at 295 K could be estimated, but is beyond the detectable limit for the 1H PFG‐NMR spectroscopy utilized herein. Therefore, we focus on measuring the PFG‐NMR self‐diffusivities of ethene and ethane in the present study. As shown in Figure 6, the diffusivity of ethene in the H‐SAPO‐34 materials correlates well with the number of Brønsted acid sites, clearly demonstrating the positive effect of increasing acid site densities on the diffusion of alkenes in H‐SAPO‐34. In sharp contrast, the diffusivity of ethane is insensitive to the acid site concentration in the framework, thus confirming the trends observed in the ab initio simulations (Figure 3). Additionally, note that upon increasing the adsorbate loading from 1 to 3 molecules per cage, a slight enhancement of the ethene self‐diffusivities is revealed, whereas the ethane self‐diffusivities slightly decrease.
Figure 6.
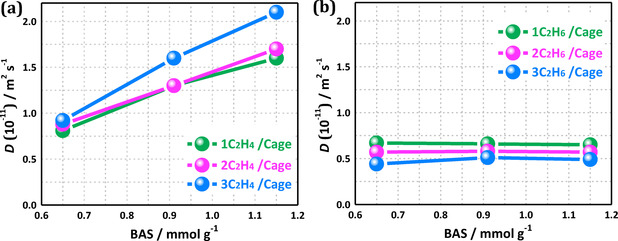
1H PFG NMR self‐diffusion coefficients, D, determined at 295 K, of a) ethene and b) ethane on H‐SAPO‐34 samples with a different amount of acid sites (BAS) for different loadings of 1–3 molecules per cage.
Secondly, the diffusion behavior of C2‐C4 alkanes and alkenes is characterized by conducting TAP pulse‐response experiments [58] in low‐pressure regime (10−8–10−6 mbar), where well‐defined Knudsen diffusion through the catalyst bed can be used as a robust standard transport process to quantify the adsorption/diffusion rates in the pores of micron‐sized SAPO‐34 samples. The characteristic time of reactor‐scale Knudsen diffusion offers a temporal window in which a probe molecule has a chance to adsorb and enter the crystalline framework. [59] Mean residence times of the hydrocarbon probe molecules inside a TAP reactor—normalized to the diffusion time of Neon as inert tracer—are plotted against temperature in Figure 7. The residence time of Ne is nearly constant with temperature, as expected for the relatively weak temperature‐dependency of Knudsen diffusion. Various C2‐C4 alkanes and alkenes were used as probe molecules to distinguish between interactions with the external and internal zeolite surface. An enhanced residence time of a probe molecule co‐pulsed with Ne, is indicative of its interaction with the outer surface or its diffusion into the SAPO‐34 crystals.
Figure 7.
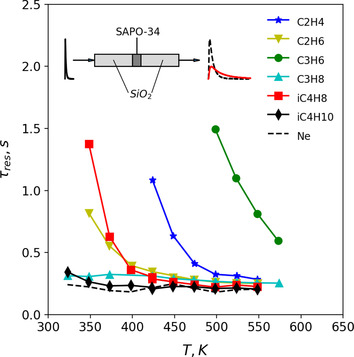
Temporal analysis of products (TAP) characterization of adsorption/diffusion behavior of C2–C4 alkanes and alkenes in micrometer‐sized H‐SAPO‐34 crystallites. Reactor residence time (normalized to Ne molecular mass) of different probe molecules as a function of temperature. The inset schematically depicts a TAP pulse‐response experiment with an inert gas (internal standard, black dashed) and a strongly adsorbing probe gas (red solid).
Isobutane and isobutene are size‐excluded from entering the 8‐ring windows of the framework and are used to probe interactions with the outer crystal surface. Isobutane interacts weakly with the outer surface, leading to enhanced residence times only at the lowest temperature measured (323 K). Isobutene shows an exponential increase in residence time below 450 K, pointing to interaction with external BAS. The less voluminous ethane or propane molecules are not, in principle, size‐excluded from entering the SAPO‐34 crystals during the pulse. Propane, which does not strongly interact with BAS in the outer layer of the zeolite, cannot diffuse into the crystal sufficiently fast to experience a significant delay within the finite temporal window during a TAP pulse. Ethane also does not strongly interact with BAS, but diffuses into the crystal interior fast enough to exhibit considerable delay at low temperatures. In contrast, alkenes can undergo adsorption on external and internal BAS, potentially forming a carbocation upon protonation. Isobutene can more strongly interact with acid sites than propene or ethene, forming a stable tertiary carbocation upon protonation. Therefore, the much higher residence times observed for propene and ethene at all temperatures can only be explained by their additional interactions with internal BAS, thus confirming that they are able to diffuse inside the crystal interior.
The TAP‐response data are in qualitative agreement with the computational models (Figure 3). The increased delay of propene with respect to ethene reflects the slower propene diffusion inside the crystals (20 kJ mol−1 difference in diffusion barrier). Also, the higher residence times of alkenes with respect to alkanes can be explained by the interaction of ethene and propene with internal BAS, leading to a faster diffusion of ethene and propene, so they can more readily enter the crystal micropores. This observation is supported by the 20–30 kJ mol−1 reduction of the alkene diffusion barriers in the presence of acid sites. A direct, quantitative comparison of diffusion coefficients for alkanes and alkenes with theoretical values is precluded by the limited window of temporal sensitivity of TAP measurements (see Section S3.6 in Supporting Information).
Conclusion
In summary, the combined effort of the ab initio simulations, NMR spectroscopy and TAP pulse‐response measurements unambiguously demonstrates the promotional effect of the presence of Brønsted acid sites on the diffusivity of alkenes in SAPO‐34 zeolites. Due to the formation of stabilizing π‐H interactions, the transport of alkenes between neighboring cages is significantly improved if the acid sites are located on the 8‐ring window itself, which is statistically very likely. Alkane diffusion is not influenced since alkanes show only weak interactions with the surrounding acid sites. Apart from the role of the acid site distribution and the presence of acid sites in the 8‐membered ring, also the acid site strength could potentially play a role in the diffusivity. These findings may lead to synthesis of zeolites with dedicated acid site distributions to promote transport of either alkenes or alkanes through the zeolite pore system, which could open new perspectives for catalysis or for alkene‐alkane separation purposes.[ 60 , 61 , 62 ]
Conflict of interest
The authors declare no conflict of interest.
Supporting information
As a service to our authors and readers, this journal provides supporting information supplied by the authors. Such materials are peer reviewed and may be re‐organized for online delivery, but are not copy‐edited or typeset. Technical support issues arising from supporting information (other than missing files) should be addressed to the authors.
Supplementary
Supplementary
Acknowledgements
P.C. and V.V.S. acknowledge funding from the European Research Council under the ERC Grant Agreement 240483 and the European Union's Horizon 2020 research and innovation programme (Consolidator ERC Grant Agreement 647755—DYNPOR). V.V.S. thanks the Research Board of the Ghent University for funding. Louis Vanduyhuys is acknowledged for discussions on the derivation of the diffusion constants. W.D. thanks the National Natural Science Foundation of China (21972069) for financial support. Computational resources and services were provided by the VSC (Flemish Supercomputer Center), funded by the Research Foundation Flanders (FWO) and the Flemish Government—department EWI. E.R. and U.O. acknowledge the Research Council of Norway for financial support through contract no. 288331/O70 (CO2LO). The TAP instrument was made available by the National Surface And Interface Characterization Laboratory (NICE)—part of the Norwegian national research infrastructure.
P. Cnudde, E. A. Redekop, W. Dai, N. G. Porcaro, M. Waroquier, S. Bordiga, M. Hunger, L. Li, U. Olsbye, V. Van Speybroeck, Angew. Chem. Int. Ed. 2021, 60, 10016.
References
- 1. Van Speybroeck V., Hemelsoet K., Joos L., Waroquier M., Bell R. G., Catlow C. R. A., Chem. Soc. Rev. 2015, 44, 7044–7111. [DOI] [PubMed] [Google Scholar]
- 2. Olsbye U., Svelle S., Bjørgen M., Beato P., Janssens T. V. W., Joensen F., Bordiga S., Lillerud K. P., Angew. Chem. Int. Ed. 2012, 51, 5810–5831; [DOI] [PubMed] [Google Scholar]; Angew. Chem. 2012, 124, 5910–5933. [Google Scholar]
- 3. Hereijgers B. P. C., Bleken F., Nilsen M. H., Svelle S., Lillerud K.-P., Bjørgen M., Weckhuysen B. M., Olsbye U., J. Catal. 2009, 264, 77–87. [Google Scholar]
- 4. Redekop E. A., Lazzarini A., Bordiga S., Olsbye U., J. Catal. 2020, 385, 300–312. [Google Scholar]
- 5. Hendriks F. C., Meirer F., Kubarev A. V., Ristanović Z., Roeffaers M. B. J., Vogt E. T. C., Bruijnincx P. C. A., Weckhuysen B. M., J. Am. Chem. Soc. 2017, 139, 13632–13635. [DOI] [PMC free article] [PubMed] [Google Scholar]
- 6. Hwang A., Le T. T., Shi Z., Dai H., Rimer J. D., Bhan A., J. Catal. 2019, 369, 122–132. [Google Scholar]
- 7. Bleken F., Bjørgen M., Palumbo L., Bordiga S., Svelle S., Lillerud K.-P., Olsbye U., Top. Catal. 2009, 52, 218–228. [Google Scholar]
- 8. Han J., Liu Z., Li H., Zhong J., Zhang W., Huang J., Zheng A., Wei Y., Liu Z., ACS Catal. 2020, 10, 8727–8735. [Google Scholar]
- 9. Dai W., Wang X., Wu G., Guan N., Hunger M., Li L., ACS Catal. 2011, 1, 292–299. [Google Scholar]
- 10. Chen D., Moljord K., Holmen A., Microporous Mesoporous Mater. 2012, 164, 239–250. [Google Scholar]
- 11. Nystrom S., Hoffman A., Hibbitts D., ACS Catal. 2018, 8, 7842–7860. [Google Scholar]
- 12. Paolucci C., Di Iorio J. R., Schneider W. F., Gounder R., Acc. Chem. Res. 2020, 53, 1881–1892. [DOI] [PubMed] [Google Scholar]
- 13. Losch P., Pinar A. B., Willinger M. G., Soukup K., Chavan S., Vincent B., Pale P., Louis B., J. Catal. 2017, 345, 11–23. [Google Scholar]
- 14. Hedin N., DeMartin G. J., Roth W. J., Strohmaier K. G., Reyes S. C., Microporous Mesoporous Mater. 2008, 109, 327–334. [Google Scholar]
- 15. Kärger J., Adsorption 2003, 9, 29–35. [Google Scholar]
- 16. Hwang S., Kärger J., Adsorption 2020, 26, 1001–1013. [Google Scholar]
- 17. Dai W., Scheibe M., Li L., Guan N., Hunger M., J. Phys. Chem. C 2012, 116, 2469–2476. [Google Scholar]
- 18. Gao S., Liu Z., Xu S., Zheng A., Wu P., Li B., Yuan X., Wei Y., Liu Z., J. Catal. 2019, 377, 51–62. [Google Scholar]
- 19. Olson D. H., Camblor M. A., Villaescusa L. A., Kuehl G. H., Microporous Mesoporous Mater. 2004, 67, 27–33. [Google Scholar]
- 20. ter Horst J. H., Bromley S. T., van Rosmalen G. M., Jansen J. C., Microporous Mesoporous Mater. 2002, 53, 45–57. [Google Scholar]
- 21. Yoda E., Kondo J. N., Domen K., J. Phys. Chem. B 2005, 109, 1464–1472. [DOI] [PubMed] [Google Scholar]
- 22. Agarwal K., John M., Pai S., Newalkar B. L., Bhargava R., Choudary N. V., Microporous Mesoporous Mater. 2010, 132, 311–318. [Google Scholar]
- 23. Vidoni A., Ruthven D. M., Ind. Eng. Chem. Res. 2012, 51, 1383–1390. [Google Scholar]
- 24. Dvoyashkina N., Freude D., Stepanov A. G., Böhlmann W., Krishna R., Kärger J., Haase J., Microporous Mesoporous Mater. 2018, 257, 128–134. [Google Scholar]
- 25. Krishna R., van Baten J. M., Microporous Mesoporous Mater. 2008, 109, 91–108. [Google Scholar]
- 26. Smit B., Maesen T. L. M., Chem. Rev. 2008, 108, 4125–4184. [DOI] [PubMed] [Google Scholar]
- 27. Granato M. A., Jorge M., Vlugt T. J. H., Rodrigues A. E., Chem. Eng. Sci. 2010, 65, 2656–2663. [Google Scholar]
- 28. Liu Z., Chu Y., Tang X., Huang L., Li G., Yi X., Zheng A., J. Phys. Chem. C 2017, 121, 22872–22882. [Google Scholar]
- 29. O'Malley A. J., Catlow C. R. A., Phys. Chem. Chem. Phys. 2015, 17, 1943–1948. [DOI] [PubMed] [Google Scholar]
- 30. Smith A. T., Plessow P. N., Studt F., Chem. Phys. 2021, 541, 111033. [Google Scholar]
- 31. Combariza A. F., Sastre G., Corma A., J. Phys. Chem. C 2009, 113, 11246–11253. [Google Scholar]
- 32. Ghysels A., Moors S. L. C., Hemelsoet K., De Wispelaere K., Waroquier M., Sastre G., Van Speybroeck V., J. Phys. Chem. C 2015, 119, 23721–23734. [Google Scholar]
- 33. Wang C., Li B., Wang Y., Xie Z., J. Energy Chem. 2013, 22, 914–918. [Google Scholar]
- 34. Cnudde P., Demuynck R., Vandenbrande S., Waroquier M., Sastre G., Van Speybroeck V., J. Am. Chem. Soc. 2020, 142, 6007–6017. [DOI] [PubMed] [Google Scholar]
- 35. Borodina E., Sharbini Harun Kamaluddin H., Meirer F., Mokhtar M., Asiri A. M., Al-Thabaiti S. A., Basahel S. N., Ruiz-Martinez J., Weckhuysen B. M., ACS Catal. 2017, 7, 5268–5281. [DOI] [PMC free article] [PubMed] [Google Scholar]
- 36. Kolvenbach R., Gonzalez Peña L. F., Jentys A., Lercher J. A., J. Phys. Chem. C 2014, 118, 8424–8434. [Google Scholar]
- 37. Shen Y., Le T. T., Fu D., Schmidt J. E., Filez M., Weckhuysen B. M., Rimer J. D., ACS Catal. 2018, 8, 11042–11053. [Google Scholar]
- 38. Knio O., Fang H., Boulfelfel S. E., Nair S., Sholl D. S., J. Phys. Chem. C 2020, 124, 15241–15252. [Google Scholar]
- 39. Chizallet C., ACS Catal. 2020, 10, 5579–5601. [Google Scholar]
- 40. Cousin Saint Remi J., Lauerer A., Chmelik C., Vandendael I., Terryn H., Baron G. V., Denayer J. F. M., Kärger J., Nat. Mater. 2016, 15, 401–406. [DOI] [PubMed] [Google Scholar]
- 41. Beerdsen E., Smit B., Dubbeldam D., Phys. Rev. Lett. 2004, 93, 248301. [DOI] [PubMed] [Google Scholar]
- 42. Gao M., Li H., Ye M., Liu Z., AIChE J. 2020, 66, e16991. [Google Scholar]
- 43. Cnudde P., De Wispelaere K., Vanduyfhuys L., Demuynck R., Van der Mynsbrugge J., Waroquier M., Van Speybroeck V., ACS Catal. 2018, 8, 9579–9595. [DOI] [PMC free article] [PubMed] [Google Scholar]
- 44. Ferri P., Li C., Millán R., Martínez-Triguero J., Moliner M., Boronat M., Corma A., Angew. Chem. Int. Ed. 2020, 59, 19708–19715; [DOI] [PubMed] [Google Scholar]; Angew. Chem. 2020, 132, 19876–19883. [Google Scholar]
- 45. Verploegh R. J., Nair S., Sholl D. S., J. Am. Chem. Soc. 2015, 137, 15760–15771. [DOI] [PubMed] [Google Scholar]
- 46. Bailleul S., Dedecker K., Cnudde P., Vanduyfhuys L., Waroquier M., Van Speybroeck V., J. Catal. 2020, 388, 38–51. [Google Scholar]
- 47. Cnudde P., De Wispelaere K., Van der Mynsbrugge J., Waroquier M., Van Speybroeck V., J. Catal. 2017, 345, 53–69. [DOI] [PMC free article] [PubMed] [Google Scholar]
- 48. Piccini G., Alessio M., Sauer J., Zhi Y., Liu Y., Kolvenbach R., Jentys A., Lercher J. A., J. Phys. Chem. C 2015, 119, 6128–6137. [Google Scholar]
- 49. Bordiga S., Regli L., Cocina D., Lamberti C., Bjørgen M., Lillerud K. P., J. Phys. Chem. B 2005, 109, 2779–2784. [DOI] [PubMed] [Google Scholar]
- 50. Spoto G., Bordiga S., Ricchiardi G., Scarano D., Zecchina A., Borello E., J. Chem. Soc. Faraday Trans. 1994, 90, 2827–2835. [Google Scholar]
- 51. Schallmoser S., Haller G. L., Sanchez-Sanchez M., Lercher J. A., J. Am. Chem. Soc. 2017, 139, 8646–8652. [DOI] [PubMed] [Google Scholar]
- 52. Kondo J. N., Wakabayashi F., Domen K., J. Phys. Chem. B 1998, 102, 2259–2262. [Google Scholar]
- 53. Kondo J. N., Wakabayashi F., Domen K., Catal. Lett. 1998, 53, 215–220. [Google Scholar]
- 54. Nguyen C. M., De Moor B. A., Reyniers M.-F., Marin G. B., J. Phys. Chem. C 2011, 115, 23831–23847. [Google Scholar]
- 55. Dai W., Wang C., Yi X., Zheng A., Li L., Wu G., Guan N., Xie Z., Dyballa M., Hunger M., Angew. Chem. Int. Ed. 2015, 54, 8783–8786; [DOI] [PubMed] [Google Scholar]; Angew. Chem. 2015, 127, 8907–8910. [Google Scholar]
- 56. Ren Q., Rybicki M., Sauer J., J. Phys. Chem. C 2020, 124, 10067–10078. [Google Scholar]
- 57. Katada N., Nouno K., Lee J. K., Shin J., Hong S. B., Niwa M., J. Phys. Chem. C 2011, 115, 22505–22513. [Google Scholar]
- 58. Gleaves J. T., Yablonsky G., Zheng X., Fushimi R., Mills P. L., J. Mol. Catal. A 2010, 315, 108–134. [Google Scholar]
- 59. Keipert O. P., Baerns M., Chem. Eng. Sci. 1998, 53, 3623–3634. [Google Scholar]
- 60. Ruthven D. M., Reyes S. C., Microporous Mesoporous Mater. 2007, 104, 59–66. [Google Scholar]
- 61. Bereciartua P. J., Cantín Á., Corma A., Jordá J. L., Palomino M., Rey F., Valencia S., Corcoran E. W., Kortunov P., Ravikovitch P. I., Burton A., Yoon C., Wang Y., Paur C., Guzman J., Bishop A. R., Casty G. L., Science 2017, 358, 1068–1071. [DOI] [PubMed] [Google Scholar]
- 62. Wang Y., Peh S. B., Zhao D., Small 2019, 15, 1900058. [DOI] [PubMed] [Google Scholar]
Associated Data
This section collects any data citations, data availability statements, or supplementary materials included in this article.
Supplementary Materials
As a service to our authors and readers, this journal provides supporting information supplied by the authors. Such materials are peer reviewed and may be re‐organized for online delivery, but are not copy‐edited or typeset. Technical support issues arising from supporting information (other than missing files) should be addressed to the authors.
Supplementary
Supplementary