

Key Points
Question
What is the association between clinician-graded facial function and patient-reported quality of life in adults (≥18 years) with peripheral facial palsy?
Findings
This systematic review and meta-analysis of 23 studies including 3746 participants found that associations between clinician-graded facial function and patient-reported quality of life were overall low to moderate. Facial palsy severity was associated more with the physical than social function of quality of life.
Meaning
This study noted that quality of life can only moderately be estimated by facial function, suggesting that, in both clinical practice and research, factors other than clinician-graded facial function need to be taken into account.
Abstract
Importance
Understanding how the quality of life of adults (≥18 years) with peripheral facial palsy can be estimated using clinician measures of facial function and patient-reported variables might aid in counseling patients and in conducting research.
Objectives
To analyze associations between clinician-graded facial function and patient-reported quality of life in adults with peripheral facial palsy, compare associations between facial function and the physical and social functions of quality of life, and examine factors that might influence the associations.
Data Sources
A literature search was conducted in PubMed, Embase, CINAHL, Web of Science and PsycInfo on June 4, 2020, with no restrictions on the start date.
Study Selection
Twenty-three studies reporting an association between clinician-graded facial function and patient-reported quality of life in adults with peripheral facial palsy were included. Facial function instruments included the House-Brackmann, Sunnybrook Facial Grading System, and electronic clinician-graded facial function assessment. Quality-of-life instruments included the Facial Disability Index and Facial Clinimetric Evaluation Scale.
Data Extraction and Synthesis
Data extraction and qualitative synthesis were performed according to the Meta-analysis of Observational Studies in Epidemiology guidelines. Record screening, data extraction, and quality assessments were done by 2 researchers independently. Data were pooled using random-effects models.
Main Outcomes and Measures
The main outcome was the association between facial function and quality of life, quantified by Pearson r, Spearman ρ, or regression analysis.
Results
In total, 23 studies (3746 participants) were included. In the 21 studies that reported on the sex of the cohorts, there were 2073 women (57.3%). Mean or median age ranged from 21 to 64 years and mean or median duration of palsy ranged from newly diagnosed to 12 years. Bell palsy (n = 1397), benign tumor (n = 980), and infection (n = 257) were the most common etiologic factors. Pooled correlation coefficients were 0.424 (95% CI, 0.375-0.471) to 0.533 (95% CI, 0.447-0.610) between facial function and Facial Clinimetric Evaluation Scale total, 0.324 (95% CI, 0.128-0.495) to 0.397 (95% CI, 0.242-0.532) between facial function and Facial Clinimetric Evaluation Scale social function, 0.423 (95% CI, 0.322-0.514) to 0.605 (95% CI, −0.124-0.910) between facial function and Facial Disability Index physical function, and 0.166 (95% CI, 0.044-0.283) to 0.208 (95% CI, 0.031-0.373) between facial function and Facial Disability Index social function.
Conclusions and Relevance
Associations noted in this systematic review and meta-analysis were overall low to moderate, suggesting that only a small part of quality of life is explained by facial function. Associations were higher between facial function and physical function than social function of quality of life.
This systematic review and meta-analysis examines the use of clinician-graded and patient-reported factors on quality of life in patients with peripheral facial palsy.
Introduction
Facial palsy results in weakness of the mimic muscles, which may result in problems with eye closure, eating, drinking, and smiling.1,2,3 Facial palsy negatively affects quality of life (QOL).4,5,6 Traditionally, measures of facial function impairment are standardized using clinician-graded scales for facial symmetry and function, such as the House-Brackmann scale,7 Sunnybrook Facial Grading System,8 and an electronic clinician-graded facial function assessment (eFACE).9 Quality of life is usually assessed with patient-reported outcome measures (PROMs). More general PROMs, such as the 36-item Short Form, allow for comparison with other diseases.10,11 Disease-specific PROMs are better suited for assessing the association between a specific condition and QOL. Disease-specific QOL in persons with facial palsy can be assessed using PROMs, such as the Facial Disability Index (FDI) and the Facial Clinimetric Evaluation scale (FaCE).12,13 These questionnaires distinguish physical and social burden. Simultaneous application of a clinician-graded scale and a PROM enables studying associations between the severity of facial function impairment and disease-specific QOL.
Several studies have analyzed this association, but sample sizes are often small and results inconsistent.4,5,6,10,12 The strength of the associations found varies widely. This variety may be associated with differences in sample characteristics, such as cause and duration of palsy, age and sex of the sample, and the measurement instruments used.4,5,6 Previous systematic reviews evaluating QOL in adults with peripheral facial palsy focus on QOL before and after treatment14 and on psychosocial symptoms (eg, anxiety and depression).15,16 However, current literature lacks an overview and summary of associations between the severity of facial function impairment and QOL, which might provide insight into which part of QOL can be estimated by facial function and which part can be estimated by other variables. Such an overview might be helpful in clinical decision-making. Therefore, we conducted a systematic review and meta-analysis of associations between clinician-graded facial function and patient-reported disease-specific QOL in adults with peripheral facial palsy. We analyzed differences in the strength of the associations between facial function and various domains (ie, physical and social functioning) of QOL. We compared the associations of different facial function instruments with the same QOL instrument. In addition, we performed a meta-regression analysis to examine which patient characteristics appear to influence the associations.
Methods
Database Search
This review is reported according to the Meta-analysis of Observational Studies in Epidemiology (MOOSE) reporting guideline17 and the review protocol is registered.18 The search strategy was developed with an information specialist of the University of Groningen. The search was conducted on June 4, 2020, in PubMed/MEDLINE, Embase, CINAHL, Web of Science, and PsycInfo (eTable 1 in the Supplement). Search terms included related terms for facial palsy (eg, facial paral*, facial disabil*) and quality of life (eg, patient outcome, QOL).Duplicate publications were removed using an Endnote de-duplication method.19 Inclusion criteria for abstracts were adults (≥18 years) with facial palsy, reported clinician-graded facial function scores, reported QOL scores, and a reported association or possibility to calculate an association between facial function and QOL. Exclusion criteria were studies with fewer than 10 cases, conference proceedings, and reviews. No language or date restrictions were imposed. A training session regarding the selection of articles using the inclusion and exclusion criteria was held between the 2 reviewers (T.E.B. and M.M.v.V.), using a random sample of 14 publications of the search. Titles and abstracts and thereafter full-text publications were screened for eligibility independently by the 2 reviewers. Disagreement was discussed between the 2 reviewers; if unresolved, a third researcher (P.U.D.) gave a binding verdict. Agreement between the 2 reviewers was calculated for screening titles, abstracts, and full-text publications.
For full-text selection, additional criteria were peripheral facial palsy, specified instruments for grading facial function (House-Brackmann, Sunnybrook Facial Grading System, or eFACE), specified QOL instruments (FDI or FaCE), and a maximum interval of 4 weeks between measurement of facial function and QOL. Full-text articles in the English, Dutch, German, French, Spanish, and Italian languages were included because the research team was sufficiently proficient in these languages.
The choice for specific measurement instruments was based on a preliminary search on eligible studies and recommendations of previous systematic reviews. A systematic review concluded that the Sunnybrook Facial Grading System was the only appropriate tool according to the criteria given in that review.20 The eFACE was developed and validated, and we included this instrument.9 The House-Brackmann scale was the most frequently used tool in the past 5 years in eligible studies and was therefore also included.21 Another systematic review concluded that the FDI and FaCE scale were appropriate QOL instruments.22 The preliminary search supported this choice and no additional QOL instruments were included.
Quality Assessment and Data Extraction
Quality of the included studies was assessed using the quality assessment tool for observational cohort and cross-sectional studies from the National Institute of Health.23 Three items regarding comparability between participants and nonparticipants, blinding participants for facial function scores, and reporting missing data were added to fit the aim of this review. A total of 11 items were assessed (eTable 2 in the Supplement). A composite score was not used, because it is less suitable for rating overall quality.24 Extracted data included sample characteristics (number of participants, sex, age, duration of palsy, and cause of palsy), study design, instruments used to assess facial function and QOL, and the calculated association between facial function and QOL. Regardless of the study design, only cross-sectional data were extracted because we were interested in the association between facial palsy severity and perceived QOL. If a study had several measurement moments, available data of the measurement moment with the largest sample size were extracted. Corresponding authors were contacted for additional information in case of missing data and if a regression coefficient was reported instead of a correlation coefficient. Regarding the cause of the palsy, the following categories were distinguished: Bell palsy or idiopathic, tumor (benign, malignant, or unspecified), infection, iatrogenic, trauma, congenital, and other/unknown (Table 1). Quality assessment and data extraction were conducted by the same 2 reviewers independently with the third researcher giving a binding verdict if necessary.
Table 1. Study Characteristics.
| Source | No. total (% women), No. analyzed | Age, mean (SD), y | Duration of palsy, mean (SD), y | Cause, No. (%) | Facial function instrument | QOL instrument | Correlation measurea | |
|---|---|---|---|---|---|---|---|---|
| Spearman ρ | Pearson r | |||||||
| VanSwearingen and Brach,12 1996 | 46 (65.0); FDI(p), 46; FDI(s), 44 | 46.8 (15.6) | Unknown | Unknown | SB | FDI(p) | NA | 0.507 |
| FDI(s) | NA | 0.066 | ||||||
| VanSwearingen et al,25 1998 | 48 (NR); FDI(p), 48; FDI(s), 47 | 49.0 (16.3) | Unknown | Bell palsy, benign and malignant tumor, other/unclear | SB | FDI(p) | 0.44 | NA |
| FDI(s) | 0.39 | NA | ||||||
| Kahn et al,13 2001 | 86 (64.0); 41 | Median, 50.5 | Median, 3.9 | Bell palsy/idiopathic, 37 (43.0); benign tumor, 26 (30.2); malignant tumor, 4 (4.7); tumor unspecified, 4 (4.7); infection, 8 (9.3); trauma, 4 (4.7); congenital, 1 (1.2); other/unknown, 2 (2.3) | HB | FaCE | −0.55 | NA |
| FDI(p/s) | NA | NA | ||||||
| SB | FaCE | 0.57 | NA | |||||
| FDI(p/s) | NA | NA | ||||||
| Frijters et al,26 2008 | 15 (26.7); 15 | 22.6 (8.9); median (IQR), 22.2 (22.2-26.2) | 8.8 (5.9); median (IQR): 6.6 (4.2-14.9) | Trauma, 15 (100) | SB | FDI(p) | 0.76 | |
| FDI(s) | NA | NA | ||||||
| Gonzalez-Cardero et al,27 2012 | 79 (NR); 79 | Mean, 40.0 | 3 mo after parotid surgery | Benign tumor, 79 (100) | HB | FDI(p) | 0.405 | NA |
| FDI(s) | NA | NA | ||||||
| Marsk et al,282013 | 93 (53.0); 93 | Mean, 56.9; median, 59.0 | Mean, 4.3; median, 1.9 | Bell palsy/idiopathic, 73 (78.5); benign tumor, 4 (4.3); infection, 16 (17.2); congenital, 1 (1.1) | HB | FaCE | −0.69 | NA |
| FDI(p) | −0.61 | NA | ||||||
| FDI(s) | −0.38 | NA | ||||||
| SB | FaCE | 0.74 | NA | |||||
| FDI(p) | 0.63 | NA | ||||||
| FDI(s) | 0.40 | NA | ||||||
| Ng et al,29 2013 | 21 (47.6); 21 | Median, 21.0 | Newly diagnosed | Bell palsy/idiopathic, 21 (100) | SB | FaCE | 0.63 | NA |
| Pavese et al,30 2014 | 100 (72.0); 100 | 45.0 (15.0) | 3.5 (5.8) | Iatrogenic, 46 (46.0); traumatic 5 (5.0); congenital, 2 (2.0); other, 47 (47.0) | SB | FDI(p) | 0.44 | NA |
| FDI(s) | 0.19 | |||||||
| Kleiss et al,312015 | 93 (66.0); HB: 62; SB: 54 | 55.1 (13.8); median, 55 | 3.8 (4.3); median, 2.4 | Bell palsy/idiopathic, 48 (51.6); benign tumor, 6 (6.5); infection, 16 (17.2); iatrogenic, 7 (7.5); other/unknown, 16 (17.2) | HB | FaCE | −0.292 | NA |
| SB | FDI(p/s) | NA | NA | |||||
| FaCE | 0.570 | NA | ||||||
| FDI(p/s) | NA | NA | ||||||
| Kleiss et al,6 2015 | 794 (59.9); HB, 794; SB, 188 | 47.0 (16.0) | Median (IQR), 1.0 (0.3-4.0) | Bell palsy/idiopathic, 353 (44.5); benign tumor, 99 (12.5); other/unknown, 342 (43.1) | HB | FaCE | −0.373 | NA |
| SB | FaCE | NA | 0.488 | |||||
| Tveiten et al,32 2017 | 539 (44.0); 539 | 63.9 (12.4) | 7.7 (2.4) | Benign tumor, 539 (100) | HB | FDI(p) | −0.468b | NA |
| FDI(s) | −0.039 | NA | ||||||
| Chong et al,33 2017 | 83 (60.2); 83 | 45.4 (16.2) | 6.8 (9.7) | Bell palsy/idiopathic, 46 (55.4); tumor unspecified, 27 (32.5); trauma, 4 (4.8); congenital, 4 (4.8); other/unknown, 2 (2.4) | HB | NA | NA | NA |
| SB | FDI(p) | 0.38 | NA | |||||
| FDI(s) | 0.09 | NA | ||||||
| eFACE | FDI(p) | 0.28 | NA | |||||
| FDI(s) | 0.22 | NA | ||||||
| Volk et al,10 2017 | 256 (60.0); 256 | 52.0 (18.0); median, 54.0 | 4.0 (8.7); median, 0.8 | Bell palsy/idiopathic, 116 (45.3); tumor unspecified, 36 (14.1); infection, 33 (12.9); iatrogenic, 47 (18.4); traumatic, 46 (18.0); congenital, 6 (2.3); other, 2 (0.8) | HB | FaCE | −0.461 | NA |
| FDI(p) | −0.221 | NA | ||||||
| FDI(s) | −0.054 | NA | ||||||
| Györi et al,34 2018 | 30 (60.0); 30 | 48.8 (15.6) | .7 (13.5) | Bell palsy/idiopathic, 6 (20.0); infection, 5 (16.7); iatrogen, 12 (40.0); trauma, 6 (20.0); other/unknown, 1 (3.3) | SB | FaCE | 0.495 | NA |
| FDI(p) | 0.536 | NA | ||||||
| FDI(s) | 0.001 | NA | ||||||
| Barry et al,35 2019 | 67 (61.2); 67 | 56.4 (14.2); median, 55 | 2.4 (5.5); median, 0.4 | Bell palsy/idiopathic, 36 (53.7); tumor unspecified, 3 (4.5); infection; iatrogenic, 20 (29.9); trauma, 4 (6.0) | HB | FaCE | −0.51 | NA |
| FDI(p) | −0.35 | NA | ||||||
| FDI(s) | −0.25 | NA | ||||||
| SB | FaCE | 0.49 | NA | |||||
| FDI(p) | 0.30 | NA | ||||||
| FDI(s) | 0.21 | NA | ||||||
| Díaz-Aristizabal et al,36 2019 | 30 (76.7); 30 | 51.1 (16.0) | 8.5 (16.4) | Bell palsy/idiopathic; 17 (56.7); benign tumor, 5 (16.7); infection, 5 (16.7); iatrogenic, 2 (6.7); trauma, 1 (3.3) | SB | FaCE | 0.662 | NA |
| FDI(p) | NA | 0.542 | ||||||
| FDI(s) | NA | NA | ||||||
| Tavares-Brito et al,44 2019 | 90 (60.0); 90 | Median (IQR), 44.5 (28.8-62.0) | Median (IQR), 0.1 (0.0-1.1) | Bell palsy/idiopathic, 53 (58.9); infection, 10 (11.1); trauma, 16 (17.8); other/unknown, 11 (12.2) | HB | FaCE | −0.538 | NA |
| eFACE | FaCE | 0.537 | NA | |||||
| Tavares-Brito et al,5 2019c,d | 920 (59.5); 920 | 48.6 (16.7) | Median (IQR), 0.8 (0.2-3.5) | Bell palsy/idiopathic, 375 (40.8); benign tumor, 143 (15.5); malignant tumor, 74 (8.0); infection, 124 (13.5); trauma, 52 (5.7); iatrogenic, 40 (4.3); congenital, 17 (1.8); other/unknown, 95 (10.3) | eFACE | FaCE | 0.409c | NA |
| van Veen et al,37 2019e | 92 (77.0); 92 | Median (IQR), 53.5 (34.0-64.1) | Median (IQR), 1.2 (0.5-3.6) | Bell palsy/idiopathic, 48 (52.2); benign tumor, 9 (9.8); malignant tumor, 4 (4.3); infection, 25 (27.2); iatrogenic, 4 (4.3); trauma, 1 (1.1); other/unknown, 1 (1.1) | eFACE | FaCE | 0.482c | NA |
| Bruins et al,4 2020f | 121 (52.0); FaCE: 71; FDI(p): 69; FDI(s): 70 | Median (IQR), 62.0 (48.0-81.0) | Median (IQR), 12.0 (7.0-27.0) | Bell palsy/idiopathic, 11 (9.1); benign tumor, 44 (36.4); malignant tumor, 13 (10.7); infection, 11 (9.1); trauma, 18 (14.9); congenital, 10 (8.3); other/unknown, 14 (11.6) | SB | FaCE | 0.332c | NA |
| Bylund et al,38 2021 | First visit, 96 (37.5); 88-96 | First visit, 49.0 (17.0) | First visit, 7.0 (8.0) d | Bell palsy/idiopathic, 96 (100) | HB | FaCE | −0.43 | NA |
| FDI(p) | −0.25 | NA | ||||||
| FDI(s) | −0.07 | NA | ||||||
| SB | FaCE | 0.42 | NA | |||||
| FDI(p) | 0.32 | NA | ||||||
| FDI(s) | 0.08 | NA | ||||||
| Özden et al,39 2020 | 51 (51.0); 51 | 46.7 (17.1) | 0.3 (0.3) | Bell palsy/idiopathic, 51 (100) | HB | FDI(p) | NA | −0.837 |
| FDI(s) | NA | −0.355 | ||||||
| Volk et al,40 2020 | 41 (46.0); 41 | 48.4 (19.9); median: 55.0 | Time between lesion and surgery, 2.4 (4.2); median, 1.2; time between surgery and measurements, 4.1 (3.2); median, 3.5 | Benign tumor, 26 (63.4); malignant tumor, 7 (17.1); trauma, 3 (7.3); other, 5 (12.2) | SB | FaCE | 0.450g | NA |
| FDI(p) | 0.176g | NA | ||||||
| FDI(s) | 0.199g | NA | ||||||
| eFACE | FaCE | 0.373g | NA | |||||
| FDI(p) | 0.811g | NA | ||||||
| FDI(s) | 0.184g | NA | ||||||
Abbreviations: eFACE, Clinician-Graded Electronic Facial Paralysis Assessment; FaCE, Facial Clinimetric Evaluation scale; FDI, Facial Disability Index physical (p) and social (s) function; NR, not reported; HB, House-Brackmann; IQR, interquartile range; QOL, quality of life; SB, Sunnybrook Facial Grading Instrument.
Two or 3 decimals reported, depending on the reported decimals in the original article.
The article described a positive correlation, but based on the third figure in that article, the correlation should be negative.
Spearman ρ requested from authors.
Univariate regression coefficient, 0.434.
Univariate regression coefficient, 0.772 (95% CI, 0.497 to 1.047).
Univariate regression coefficient, FaCE, 0.37 (95% CI, 0.22 to 0.53); FDI(p), 0.20 (95% CI, 0.04 to 0.36); FDI(s), 0.06 (95% CI, −0.09 to 0.22).
Before surgery.
Statistical Analysis
Agreement between the 2 reviewers was expressed as absolute agreement and Cohen κ value. Meta-analysis was performed using Comprehensive Meta-analysis, version 3 software (Biostat Inc),41 using a random-effects model. Effect sizes are presented as correlation coefficients, 95% CIs, and P values, with significance set at P < .05. The House-Brackmann correlations were converted to positive correlations for easier comparing. Statistical heterogeneity between studies was assessed by calculating I2 values, whereby 0% to 40% was classified as low, 30% to 60% as moderate, 50% to 90% as substantial, and 75% to 100% as considerable heterogeneity.42,43 To explore any apparent influence of age, sex, duration of palsy, and cause of palsy on the association between facial function and QOL, univariate meta-regression analyses were performed using the same software.
Results
The database search resulted in 2109 records. After full-text screening, 23 studies were included for narrative review and meta-analysis (Figure 1). The studies by Tavares-Brito et al5 and van Veen et al1 both met the inclusion criteria but were based on the same sample; the van Veen et al1 study was excluded because it provided analysis for the separate groups (flaccid or nonflaccid palsy) and not for the total sample. The Cohen κ values were 0.65 (88% agreement) for screening abstracts and 0.87 (98% agreement) for full text.
Figure 1. Preferred Reporting Items for Systematic Reviews and Meta-analyses Flow Diagram.

Study Characteristics
In total, 3746 participants were included in 23 studies (Table 1).1,4,5,6,10,12,13,25,26,27,28,29,30,31,32,33,34,35,36,37,38,39,40 Sample sizes ranged from 15 to 920 patients.5,26 In the meta-analysis, the number of participants used to calculate associations between facial function and QOL ranged from 3039 (81%) to 3665 (98%). In the 21 studies that reported on the sex of the cohorts, there were 2073 women (57.3%) and 1546 men (42.7%). Mean or median age ranged from 21 to 64 years.29,32 Mean or median duration of palsy ranged from newly diagnosed to 12 years.4,29 Bell palsy (1397 [37%]); benign tumors (980 [26%]), most of which were acoustic neuroma (≥774 [≥80%]); and infection (257 [7%]) were the most common causes of palsy; 2 studies did not report cause.12,25 The Sunnybrook Facial Grading System was the most commonly used facial function instrument in 16 studies,4,6,12,13,25,26,28,29,30,31,33,34,35,36,38,40 and the FDI was the most commonly used QOL instrument in 18 studies.4,10,12,13,25,26,27,28,30,31,32,33,34,35,36,38,39,40
Risk of Bias
In 22 studies (96%), the populations were clearly defined (item 1), in 21 studies (91%), participants were selected from similar populations (item 4a), and in all studies, inclusion and exclusion criteria were specified and uniformly applied (item 4b) (eTable 3 in the Supplement). Three (12%) studies analyzed comparability between participant and nonparticipant characteristics (items 3a, 3b). Three (13%) studies provided a sample size justification (item 5), clinicians were blinded in 2 (9%) studies, and participants were blinded in 4 (17%) studies (items 9a, 9b). In 20 studies (87%), potential confounding variables were measured, but only 5 studies (22%) adjusted for confounders.4,5,10,37,40
Associations Between Facial Function and QOL
Figure 2A shows correlation of FaCE total with heterogeneity (I2) of pooled associations.4,5,6,10,13,28,29,31,34,35,36,37,38,40,44 In the meta-analyses, pooled correlation coefficients between the QOL instrument FaCE total score and the other facial function instruments showed 0.424 (95% CI, 0.375-0.471; I2 = 0%) for eFACE, 0.533 (95% CI, 0.447-0.610; I2 = 69%) for House-Brackmann, and 0.533 (95% CI, 0.447-0.610; I2 = 52%) for the Sunnybrook Facial Grading System (Figure 2A). Pooled correlation coefficients between FaCE social function and the other instruments were 0.324 (95% CI, 0.324 (95% CI, 0.128-0.462; I2 = 23%) for eFACE, 0.397 (95% CI, 0.242-0.532; I2 = 79%) for House-Brackmann, and 0.356 (95% CI, 0.238-0.463; I2 = 44%) for Sunnybrook Facial Grading System (Figure 2B).10,13,28,29,31,34,35,36,38,40,44
Figure 2. Correlations Between the Facial Clinimetric Evaluation Scale (FaCE) and Other Instruments.

A, Correlation of FaCE total with heterogeneity (I2) of pooled associations between electronic, clinician-graded facial function assessment (eFACE) (0%), House-Brackmann (HB) (69%), and Sunnybrook Facial Grading System (SB) (52%). B, FaCE social function with heterogeneity of pooled associations between eFACE (23%), HB (79%), and SB (44%). Correlations including the HB were converted to positive values for easier comparison. Squares represent mean values, with the size of the squares indicating weight and horizontal lines representing 95% CIs. Diamonds represent the pooled mean with the points of the diamonds representing 95% CIs.
Pooled correlation coefficients between FDI physical function and the other instruments were 0.605 (95% CI, −0.124 to 0.910; I2 = 95%), for eFACE, 0.473 (95% CI, 0.311-0.607; I2 = 88%) for House-Brackmann, and 0.423 (95% CI, 0.322-0.514; I2 = 55%) for Sunnybrook Facial Grading System and (Figure 3A).4,10,12,25,26,27,28,30,32,33,34,35,36,38,39,40 Pooled correlation coefficients between FDI social function and the other instruments were 0.208 (95% CI, 0.301-0.373; I2 = 0%) for eFACE, 0.166 (95% CI, 0.044-0.283; I2 = 68%) for House-Brackmann, and 0.182 (95% CI, 0.095-0.266; I2 = 21%) for Sunnybrook Facial Grading System (Figure 3B).4,10,12,25,28,30,32,33,34,35,38,39,40 The strongest pooled correlation, based on 2 studies, was found between the eFACE and the FDI physical function. The weakest pooled correlation, also based on 2 studies, was found between the House-Brackmann and FDI social function. We examined whether the choice of facial function instrument was associated with the association between facial function and QOL by comparing 95% CIs. Forest plots show overlapping 95% CIs of the pooled correlations between eFACE, House-Brackmann, and Sunnybrook Facial Grading System and the same QOL outcome (Figure 2).
Figure 3. Correlations Between the Facial Disability Index (FDI) Physical (p) and Social (s) Scales and Other Instruments.
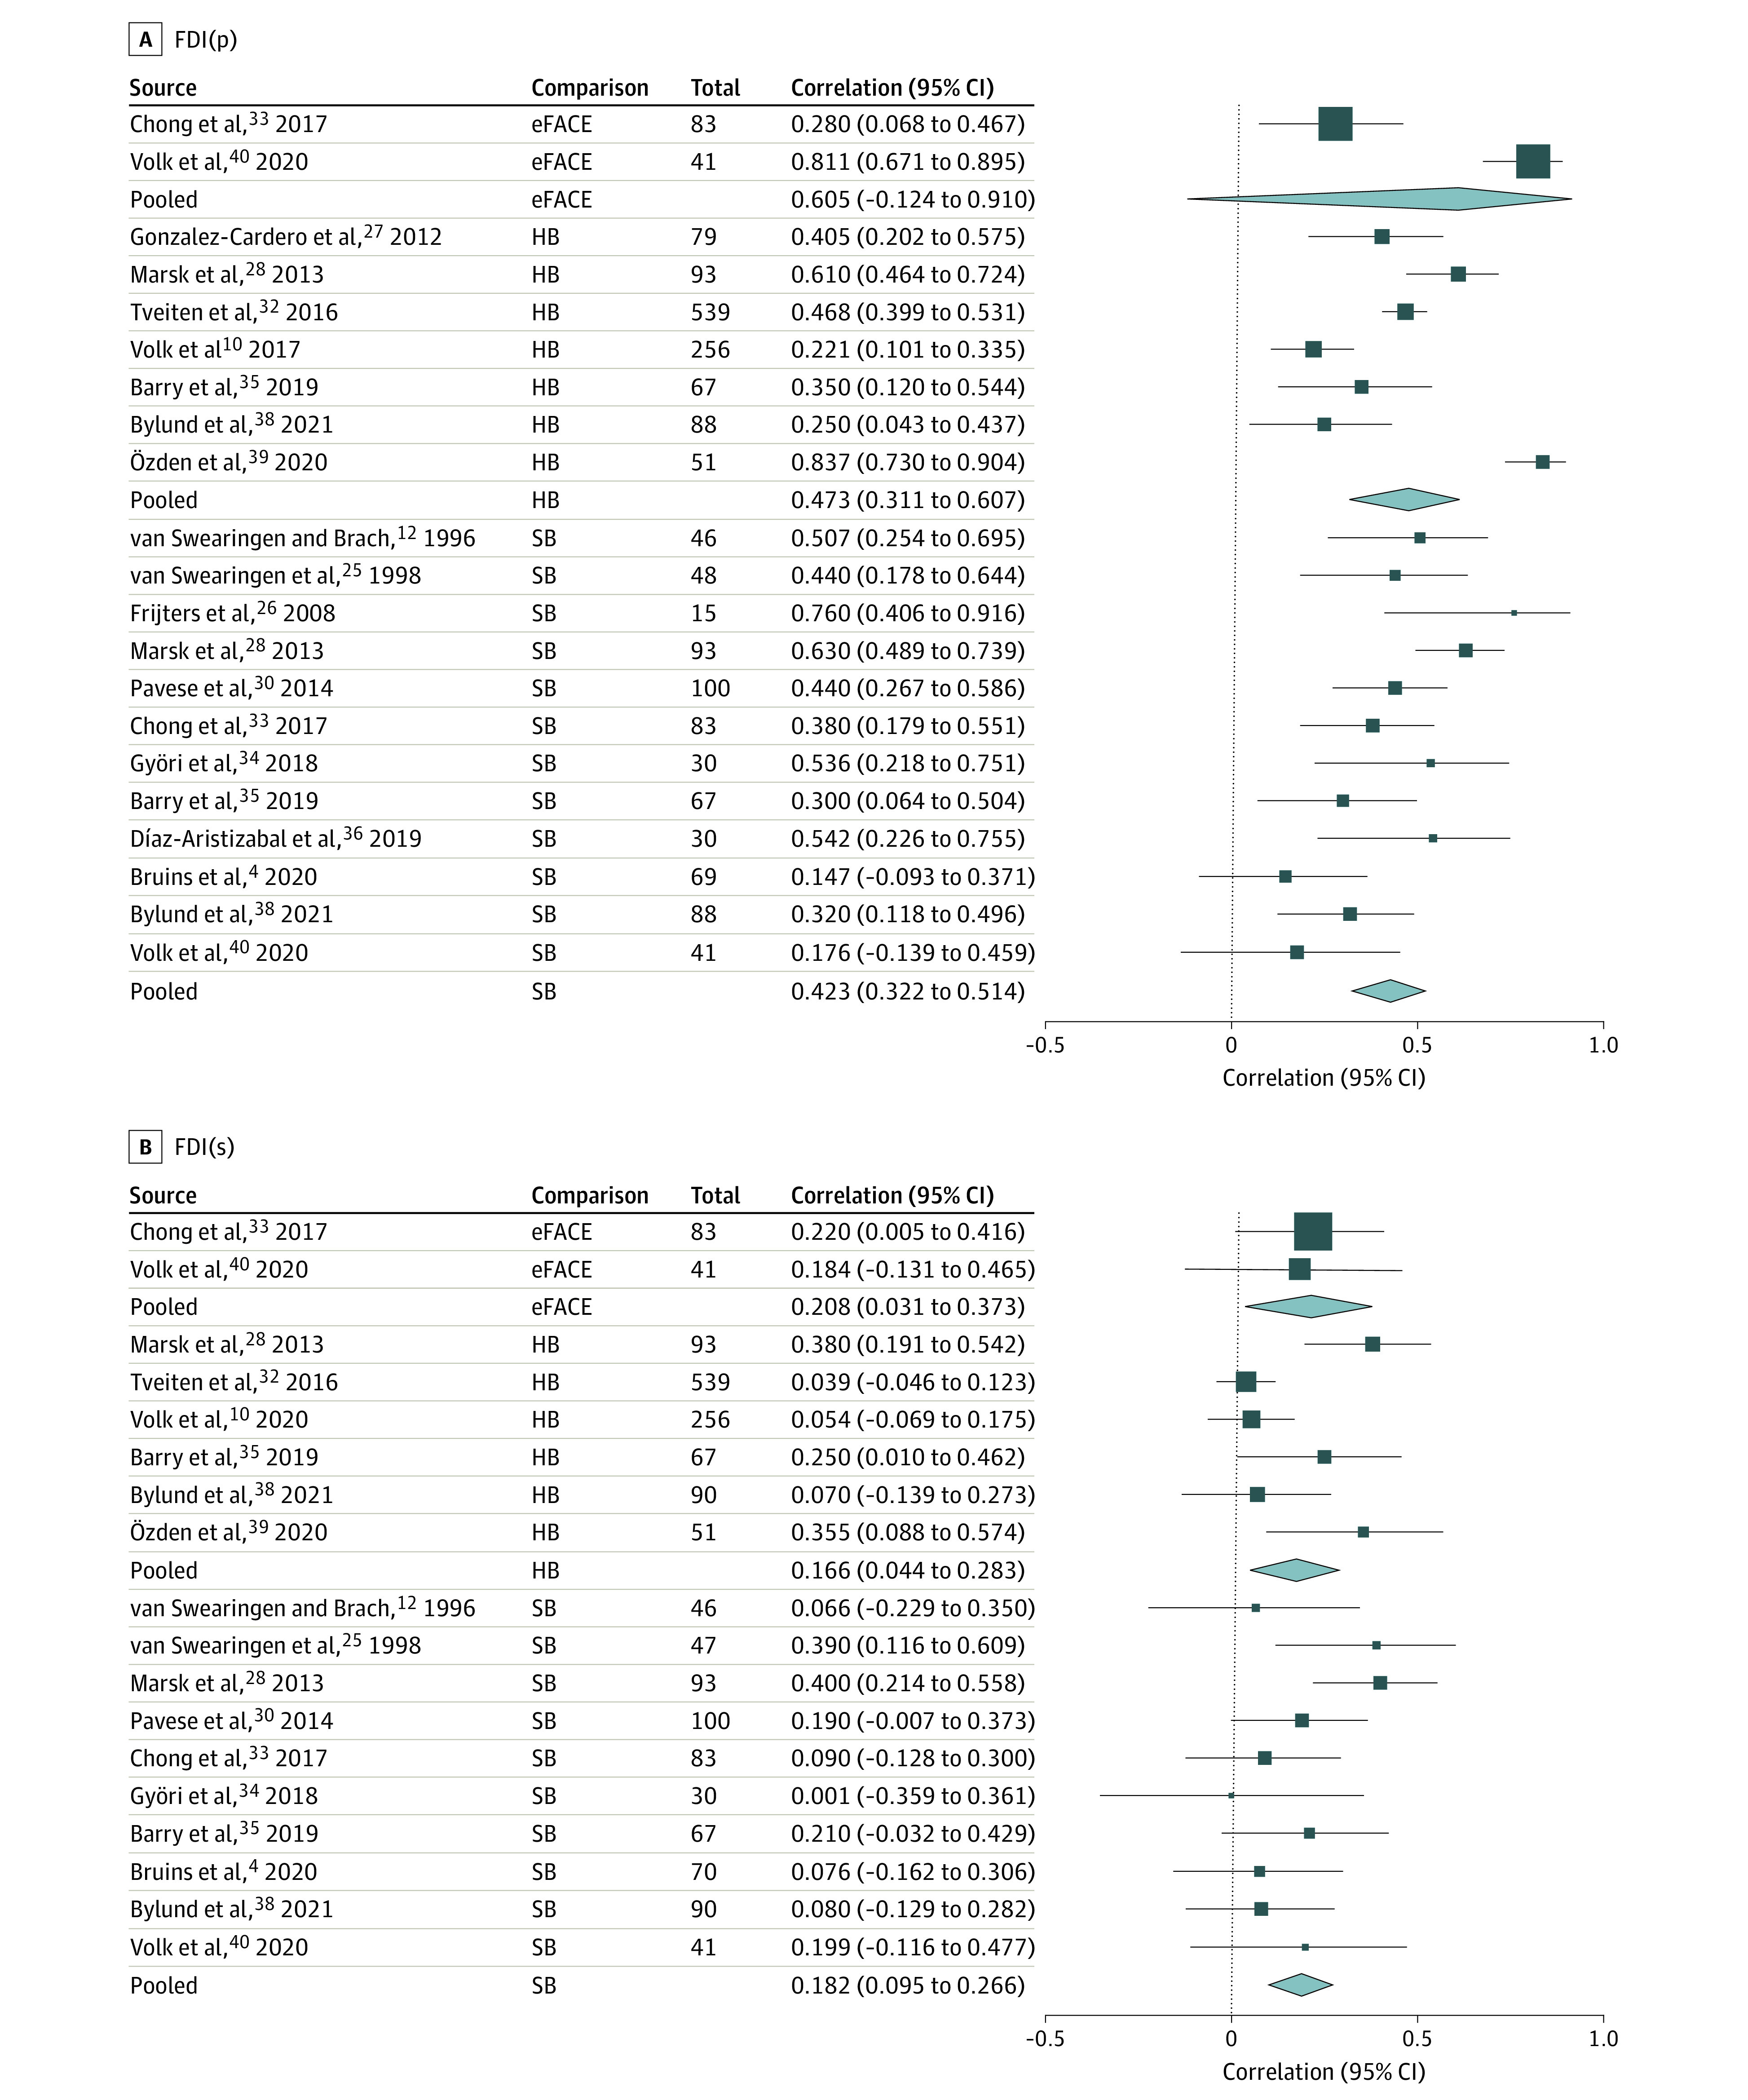
A, Correlation of FDI(p) with heterogeneity (I2) of pooled associations between electronic, clinician-graded facial function assessment (eFACE) (95%), House-Brackmann (HB) (88%), and Sunnybrook Facial Grading System (SB) (55%). B, Correlation of FDI(s) with heterogeneity of pooled associations between eFACE (0%), HB (68%), and SB (21%). Correlations including the HB were converted to positive values for easier comparison. Squares represent mean values, with the size of the squares indicating weight and horizontal lines representing 95% CIs. Diamonds represent the pooled mean with the points of the diamonds representing 95% CIs.
Associations Between Facial Function and the Physical and Social Domains
Pooled correlation coefficients between facial function and QOL were higher for the physical domain of QOL, represented by FaCE total and FDI physical function (Figure 2A, Figure 3A), than for the social domain, represented by FaCE and FDI social function (Figure 2B, Figure 3B).
The results of the meta-analysis examining the correlations between facial function and all FaCE subdomains are presented in eTable 4 in the Supplement. The strongest correlations with the subdomain facial movement of the FaCE were noted with House-Brackmann (0.593; 95% CI, 0.443-0.711), Sunnybrook Facial Grading System (0.634; 95% CI, 0.496-0.741), and eFACE (0.531; 95% CI, 0.197-0.754).
Factors Influencing Association Between Facial Function and QOL
Only factors apparently influencing the associations between the Sunnybrook Facial Grading System score and QOL could be evaluated in the meta-regression analysis, because the number of studies was too limited for any other associations to be analyzed. The number of studies included in the meta-regression analysis ranged from 6 to 11. This meta-regression does not show the association between a factor and QOL; rather, how a factor relates to the association between facial function (Sunnybrook Facial Grading System) and QOL is estimated. The mean age of the participants was associated with the correlation between Sunnybrook Facial Grading System and FDI social function (0.018; 95% CI, 0.000-0.037) (Table 2), indicating that, in studies with a higher mean age of the populations, the associations found apparently are higher (0.018 per means in years of age).
Table 2. Meta-Regression Univariate.
| Association | Covariate (No. of studies) | Coefficient (95% CI) | P value |
|---|---|---|---|
| SB with FaCE total | Intercept age | −1.150 (−3.332 to 1.032) | .30 |
| Age, mean (6) | 0.034 (−0.008 to 0.076) | .11 | |
| Intercept % female | 0.300 (−0.524 to 1.121) | .48 | |
| % Female (7) | 0.006 (−0.009 to 0.021) | .41 | |
| Intercept % Bell palsy | 0.467 (0.251 to 0.683) | <.001 | |
| % Bell palsy (11) | 0.003 (−0.001 to 0.006) | .18 | |
| SB with FaCE social function | Intercept age | −1.742 (−3.397 to 1.914) | .58 |
| Age, mean (6) | 0.021 (−0.030 to 0.071) | .42 | |
| Intercept % Bell palsy | 0.240 (−0.041 to 0.521) | .10 | |
| % Bell palsy (9) | 0.002 (−0.002 to 0.007) | .30 | |
| SB with FDI(p) | Intercept age | 0.843 (−0.050 to 1.736) | .06 |
| Age, mean (11) | −0.007 (−0.026 to 0.011) | .42 | |
| Intercept % female | 0.479 (−0.113 to 1.070) | .11 | |
| % Female (10) | 0.000 (−0.010 to 0.010) | .98 | |
| Intercept duration palsy | 0.382 (−0.259, 1.022) | .24 | |
| Duration of palsy (4) | 0.047 (−0.120 to 0.213) | .58 | |
| Intercept % Bell palsy | 0.407 (0.184 to 0.630) | <.001 | |
| % Bell palsy (10) | <0.001 (−0.003 to 0.005) | .68 | |
| SB with FDI(s) | Intercept age | −0.712 (−1.617 to 0.193) | .12 |
| Age, mean (9) | 0.018 (0.000 to 0.037) | .048 | |
| Intercept % female | 0.170 (−0.378 to 0.718) | .54 | |
| % Female (8) | <0.001 (−0.009 to 0.010) | .98 | |
| Intercept % Bell palsy | 0.144 (−0.012 to 0.300) | .07 | |
| % Bell palsy (8) | <0.001 (−0.002 to 0.003) | .63 |
Abbreviations: FaCE, Facial Clinimetric Evaluation scale; FDI, Facial Disability Index physical (p) and social (s) function; SB, Sunnybrook Facial Grading Instrument.
Discussion
This systematic review and meta-analysis examined the association between clinician-graded facial function and patient-reported, disease-specific QOL in adults with peripheral facial palsy. Associations were low to moderate, meaning that only a small part of QOL is explained by facial function and a considerable part of QOL is explained by other factors. Our findings are in concordance with previous literature. In a systematic review examining the association between disease-related impairments and health-related QOL in patients with various disorders, pooled effect sizes less than or equal to 0.46 were found.45 The authors stated that QOL scores do not adequately reflect impairment because these scores appear to be influenced by factors in addition to the impairment. Studies analyzing variables associated with QOL in patients with facial palsy described that, in general, a shorter duration of palsy, an older age, female sex, higher depression scores, higher anxiety scores, and worse facial function were associated with lower QOL.4,5,6,46 A study examining the explained variance (R2) of QOL suggested that the FaCE total score is largely determined by the eFACE and a smaller portion might be explained by other factors, such as sex and type of visit (initial evaluation or follow-up).37
In this review, the correlation between the facial function and social function domain of QOL was weaker than the correlation between facial function and physical function. Different patients with the same facial palsy severity may experience social burden differently, and patients experiencing the same social burden may have variations in facial palsy severity. Previous studies found increased anxiety and depression rates in persons with facial palsy,15,47,48,49 but anxiety or depression was not associated with facial palsy severity.16 A systematic review examining the psychosocial aspects of facial palsy advises psychological screening of every patient given the inconsistencies between studies in the strength of the correlation between facial palsy severity and psychosocial outcomes.16 Although psychosocial counseling has been previously recommended, to our knowledge, there is no research published on what type of counseling is needed most in the facial palsy population.16,50,51
We examined whether the choice of facial function instrument affects the association between facial function and QOL. We consistently found overlapping 95% CIs of summary statistics when correlating the 3 facial function instruments with the same QOL instrument (Figures 2 and 3), so no significant differences in strength of the correlations were found. The House-Brackmann instrument has received increasing criticism owing to its crude scale, which does not allow for distinguishing changes in different regions of the face and is therefore deemed less suitable for clinical and scientific evaluation of facial palsy.7,20,52
The meta-regression analyses showed that only mean age of the study population influenced the association between the Sunnybrook Facial Grading System and FDI social function, indicating that in studies with a higher mean age, the associations were somewhat higher (0.018 per means in years of age). Clinically, this finding suggests that, in older participants, the association between facial function and social function is somewhat higher, and vice versa, with younger patients more variable in experiencing social burden independent of facial palsy severity. Other factors analyzed in the meta-regression were percentage of women, duration of palsy, and diagnosis of idiopathic facial palsy, which were not significantly different or could not be analyzed owing to the small number of studies. The lack of significant findings in our meta-regression could be due to heterogeneity between studies, probably related to large variability in patient characteristics, such as sex ratio, age, and duration of palsy (clinical heterogeneity). Obtaining a homogeneous sample with a sufficient number of patients with facial palsy is difficult owing to the great variability in age at occurrence, disease course, cause of palsy, laterality, previous treatment, and a low incidence.53,54 Methodologic variations between studies, such as differences in facial function assessment, outcome assessment, and handling of confounders and missing data, may also have contributed to the large heterogeneity.55
Risk of Bias Assessment
There is no single method best for assessing risk of bias in observational studies because there is disagreement on how to approach risk of bias assessment.56,57 Because this review analyzed cross-sectional data, we chose a tool suited for this purpose and modified it slightly so that it better met the aim of the study. Overall, it appeared that studies failed to report the method. For example, 57% of the studies analyzed did not report whether facial function and 43% whether QOL assessments were implemented consistently. Whether assessors were blinded to QOL scores of patients was not reported in 61% of the studies and whether participants were blinded to facial function scores was not reported in 70% of the studies. For better comparison of studies and to estimate the risk of bias adequately, future research should better report exposure and outcome assessment.
Limitations
The study had limitations. In this review, physical function is defined as FaCE total score and FDI physical function. A limitation of this approach is that the FaCE total score also comprises a social subdomain. There is not one subdomain of the FaCE that directly matches the FDI physical function and it was not possible to exclude the social subdomain and merge all physical subdomains of the FaCE. However, when comparing the pooled correlations of the FaCE total (Figure 2A) with the FaCE subdomains (eTable 4 in the Supplement), there was no indication that including social function data as part of the FaCE total score was associated with the conclusion of this review. Clinical and methodologic heterogeneity, indicated by high I2 values, was substantial between studies, suggesting bias. Another limitation of this review is that every study analyzed the association between facial function severity and QOL in a linear model. To our knowledge no study has ever explored whether another model fit might better explain the association between facial function and QOL. Another model might better explain the association between clinician-graded facial function and QOL. Furthermore, some of the included studies used Spearman ρ and some used Pearson r to analyze their data, but there were too few studies that used Pearson r to test whether the choice of test statistic appeared to influence the association found. In addition, the pooled correlations were not adjusted for covariates.
This review provides insight into which part of QOL can be explained by facial function and which part is explained by other variables. Given the considerably large unexplained part, we recommend assessing facial palsy using both clinician-graded as well as patient-reported instruments. Existing relevant literature is limited by small sample sizes and a large amount of heterogeneity between studies. Although large sample sizes are often difficult to obtain in the field of facial palsy, it would be beneficial to aim for such sample sizes in future research.
Conclusions
This systematic review and meta-analysis noted that clinician-graded facial function and patient-reported, disease-specific QOL appear to be only moderately correlated. Particularly, the social function domain of QOL is weakly correlated with the severity of facial function impairment, emphasizing that the psychosocial burden that comes with peripheral facial palsy is not necessarily defined by the severity of the palsy. Therefore, we recommend assessing facial palsy using both clinician-graded and patient-reported instruments. Future research should focus on identifying factors other than severity of facial function impairment that might influence QOL in adults with peripheral facial palsy.
eTable 1. Search Strategy
eTable 2. Risk of Bias Tool
eTable 3. Risk of Bias Assessment
eTable 4. Meta-analysis of the House-Brackmann, Sunnybrook Facial Grading System and the eFACE Correlated With the Facial Clinimetric Evaluation subdomain Scores
eReferences
References
- 1.van Veen MM, Tavares-Brito J, van Veen BM, et al. Association of regional facial dysfunction with facial palsy–related quality of life. JAMA Facial Plast Surg. 2019;21(1):32-37. doi: 10.1001/jamafacial.2018.0804 [DOI] [PMC free article] [PubMed] [Google Scholar]
- 2.Movérare T, Lohmander A, Hultcrantz M, Sjögreen L. Peripheral facial palsy: speech, communication and oral motor function. Eur Ann Otorhinolaryngol Head Neck Dis. 2017;134(1):27-31. doi: 10.1016/j.anorl.2015.12.002 [DOI] [PubMed] [Google Scholar]
- 3.Terzis JK, Karypidis D. Blink restoration in adult facial paralysis. Plast Reconstr Surg. 2010;126(1):126-139. doi: 10.1097/PRS.0b013e3181dbbf34 [DOI] [PubMed] [Google Scholar]
- 4.Bruins TE, van Veen MM, Mooibroek-Leeuwerke T, Werker PMN, Broekstra DC, Dijkstra PU. Association of socioeconomic, personality, and mental health factors with health-related quality of life in patients with facial palsy. JAMA Otolaryngol Head Neck Surg. 2020;146(4):331-337. doi: 10.1001/jamaoto.2019.4559 [DOI] [PMC free article] [PubMed] [Google Scholar]
- 5.Tavares-Brito J, van Veen MM, Dusseldorp JR, Bahmad F Jr, Hadlock TA. Facial palsy–specific quality of life in 920 patients: correlation with clinician-graded severity and predicting factors. Laryngoscope. 2019;129(1):100-104. doi: 10.1002/lary.27481 [DOI] [PubMed] [Google Scholar]
- 6.Kleiss IJ, Hohman MH, Susarla SM, Marres HA, Hadlock TA. Health-related quality of life in 794 patients with a peripheral facial palsy using the FaCE Scale: a retrospective cohort study. Clin Otolaryngol. 2015;40(6):651-656. doi: 10.1111/coa.12434 [DOI] [PubMed] [Google Scholar]
- 7.House JW, Brackmann DE. Facial nerve grading system. Otolaryngol Head Neck Surg. 1985;93(2):146-147. doi: 10.1177/019459988509300202 [DOI] [PubMed] [Google Scholar]
- 8.Ross BG, Fradet G, Nedzelski JM. Development of a sensitive clinical facial grading system. Otolaryngol Head Neck Surg. 1996;114(3):380-386. doi: 10.1016/S0194-5998(96)70206-1 [DOI] [PubMed] [Google Scholar]
- 9.Banks CA, Bhama PK, Park J, Hadlock CR, Hadlock TA. Clinician-graded electronic facial paralysis assessment: the eFACE. Plast Reconstr Surg. 2015;136(2):223e-230e. doi: 10.1097/PRS.0000000000001447 [DOI] [PubMed] [Google Scholar]
- 10.Volk GF, Granitzka T, Kreysa H, Klingner CM, Guntinas-Lichius O. Initial severity of motor and non-motor disabilities in patients with facial palsy: an assessment using patient-reported outcome measures. Eur Arch Otorhinolaryngol. 2017;274(1):45-52. doi: 10.1007/s00405-016-4018-1 [DOI] [PubMed] [Google Scholar]
- 11.Ware JE Jr, Gandek B. Overview of the SF-36 Health Survey and the International Quality of Life Assessment (IQOLA) Project. J Clin Epidemiol. 1998;51(11):903-912. doi: 10.1016/S0895-4356(98)00081-X [DOI] [PubMed] [Google Scholar]
- 12.VanSwearingen JM, Brach JS. The Facial Disability Index: reliability and validity of a disability assessment instrument for disorders of the facial neuromuscular system. Phys Ther. 1996;76(12):1288-1298. doi: 10.1093/ptj/76.12.1288 [DOI] [PubMed] [Google Scholar]
- 13.Kahn JB, Gliklich RE, Boyev KP, Stewart MG, Metson RB, McKenna MJ. Validation of a patient-graded instrument for facial nerve paralysis: the FaCE scale. Laryngoscope. 2001;111(3):387-398. doi: 10.1097/00005537-200103000-00005 [DOI] [PubMed] [Google Scholar]
- 14.Luijmes RE, Pouwels S, Beurskens CH, Kleiss IJ, Siemann I, Ingels KJ. Quality of life before and after different treatment modalities in peripheral facial palsy: a systematic review. Laryngoscope. 2017;127(5):1044-1051. doi: 10.1002/lary.26356 [DOI] [PubMed] [Google Scholar]
- 15.Cuenca-Martínez F, Zapardiel-Sánchez E, Carrasco-González E, La Touche R, Suso-Martí L. Assessing anxiety, depression and quality of life in patients with peripheral facial palsy: a systematic review. PeerJ. 2020;8:e10449. doi: 10.7717/peerj.10449 [DOI] [PMC free article] [PubMed] [Google Scholar]
- 16.Hotton M, Huggons E, Hamlet C, et al. The psychosocial impact of facial palsy: a systematic review. Br J Health Psychol. 2020;25(3):695-727. doi: 10.1111/bjhp.12440 [DOI] [PubMed] [Google Scholar]
- 17.Stroup DF, Berlin JA, Morton SC, et al. Meta-analysis of observational studies in epidemiology: a proposal for reporting: Meta-analysis of Observational Studies in Epidemiology (MOOSE) group. JAMA. 2000;283(15):2008-2012. doi: 10.1001/jama.283.15.2008 [DOI] [PubMed] [Google Scholar]
- 18.Bruins TE, van Veen MM, Werker PMN, Broekstra DC, Dijkstra PU. Systematic review and meta-analysis of the strength of the association between facial function and quality of life in patients with facial palsy. PROSPERO 2020. CRD42020197253. Accessed July 6, 2020. https://www.crd.york.ac.uk/prospero/display_record.php?ID=CRD42020197253.
- 19.Bramer WM, Giustini D, de Jonge GB, Holland L, Bekhuis T. De-duplication of database search results for systematic reviews in EndNote. J Med Libr Assoc. 2016;104(3):240-243. doi: 10.3163/1536-5050.104.3.014 [DOI] [PMC free article] [PubMed] [Google Scholar]
- 20.Fattah AY, Gurusinghe ADR, Gavilan J, et al. ; Sir Charles Bell Society . Facial nerve grading instruments: systematic review of the literature and suggestion for uniformity. Plast Reconstr Surg. 2015;135(2):569-579. doi: 10.1097/PRS.0000000000000905 [DOI] [PubMed] [Google Scholar]
- 21.Fattah AY, Gavilan J, Hadlock TA, et al. Survey of methods of facial palsy documentation in use by members of the Sir Charles Bell Society. Laryngoscope. 2014;124(10):2247-2251. doi: 10.1002/lary.24636 [DOI] [PubMed] [Google Scholar]
- 22.Ho AL, Scott AM, Klassen AF, Cano SJ, Pusic AL, Van Laeken N. Measuring quality of life and patient satisfaction in facial paralysis patients: a systematic review of patient-reported outcome measures. Plast Reconstr Surg. 2012;130(1):91-99. doi: 10.1097/PRS.0b013e318254b08d [DOI] [PubMed] [Google Scholar]
- 23.National Heart, Lung, and Blood Institute. study quality assessment tools. Accessed June 10, 2020. https://www.nhlbi.nih.gov/health-topics/study-quality-assessment-tools
- 24.O’Connor SR, Tully MA, Ryan B, Bradley JM, Baxter GD, McDonough SM. Failure of a numerical quality assessment scale to identify potential risk of bias in a systematic review: a comparison study. BMC Res Notes. 2015;8:224. doi: 10.1186/s13104-015-1181-1 [DOI] [PMC free article] [PubMed] [Google Scholar]
- 25.VanSwearingen JM, Cohn JF, Turnbull J, Mrzai T, Johnson P. Psychological distress: linking impairment with disability in facial neuromotor disorders. Otolaryngol Head Neck Surg. 1998;118(6):790-796. doi: 10.1016/S0194-5998(98)70270-0 [DOI] [PubMed] [Google Scholar]
- 26.Frijters E, Hofer SO, Mureau MA. Long-term subjective and objective outcome after primary repair of traumatic facial nerve injuries. Ann Plast Surg. 2008;61(2):181-187. doi: 10.1097/SAP.0b013e3181591e27 [DOI] [PubMed] [Google Scholar]
- 27.Gonzalez-Cardero E, Infante-Cossio P, Cayuela A, Acosta-Feria M, Gutierrez-Perez JL. Facial Disability Index (FDI): adaptation to Spanish, reliability and validity. Med Oral Patol Oral Cir Bucal. 2012;17(6):e1006-e1012. doi: 10.4317/medoral.18054 [DOI] [PMC free article] [PubMed] [Google Scholar]
- 28.Marsk E, Hammarstedt-Nordenvall L, Engström M, Jonsson L, Hultcrantz M. Validation of a Swedish version of the Facial Disability Index (FDI) and the Facial Clinimetric Evaluation (FaCE) scale. Acta Otolaryngol. 2013;133(6):662-669. doi: 10.3109/00016489.2013.766924 [DOI] [PubMed] [Google Scholar]
- 29.Ng JH, Ngo RY. The use of the Facial Clinimetric Evaluation Scale as a patient-based grading system in Bell’s palsy. Laryngoscope. 2013;123(5):1256-1260. doi: 10.1002/lary.23790 [DOI] [PubMed] [Google Scholar]
- 30.Pavese C, Cecini M, Camerino N, et al. Functional and social limitations after facial palsy: expanded and independent validation of the Italian version of the Facial Disability Index. Phys Ther. 2014;94(9):1327-1336. doi: 10.2522/ptj.20130254 [DOI] [PubMed] [Google Scholar]
- 31.Kleiss IJ, Beurskens CH, Stalmeier PF, Ingels KJ, Marres HA. Quality of life assessment in facial palsy: validation of the Dutch Facial Clinimetric Evaluation Scale. Eur Arch Otorhinolaryngol. 2015;272(8):2055-2061. doi: 10.1007/s00405-015-3508-x [DOI] [PMC free article] [PubMed] [Google Scholar]
- 32.Tveiten ØV, Carlson ML, Goplen F, et al. Patient- versus physician-reported facial disability in vestibular schwannoma: an international cross-sectional study. J Neurosurg. 2017;127(5):1015-1024. doi: 10.3171/2016.8.JNS16707 [DOI] [PubMed] [Google Scholar]
- 33.Chong LSH, Eviston TJ, Low TH, Hasmat S, Coulson SE, Clark JR. Validation of the clinician-graded electronic facial paralysis assessment. Plast Reconstr Surg. 2017;140(1):159-167. doi: 10.1097/PRS.0000000000003447 [DOI] [PubMed] [Google Scholar]
- 34.Györi E, Przestrzelski C, Pona I, et al. Quality of life and functional assessment of facial palsy patients: a questionnaire study. Int J Surg. 2018;55:92-97. doi: 10.1016/j.ijsu.2018.04.061 [DOI] [PubMed] [Google Scholar]
- 35.Barry P, Mancini J, Alshukry A, Salburgo F, Lavieille JP, Montava M. Validation of French versions of the Facial Disability Index and the Facial Clinimetric Evaluation Scale, specific quality of life scales for peripheral facial palsy patients. Clin Otolaryngol. 2019;44(3):313-322. doi: 10.1111/coa.13294 [DOI] [PubMed] [Google Scholar]
- 36.Díaz-Aristizabal U, Valdés-Vilches M, Fernández-Ferreras TR, Calero-Muñoz E, Bienzobas-Allué E, Moracén-Naranjo T. Correlations between impairment, psychological distress, disability, and quality of life in peripheral facial palsy [Spanish]. Neurologia. 2019;34(7):423-428. [DOI] [PubMed] [Google Scholar]
- 37.van Veen MM, Quatela O, Tavares-Brito J, et al. Patient-perceived severity of synkinesis reduces quality of life in facial palsy: a cross-sectional analysis in 92 patients. Clin Otolaryngol. 2019;44(3):483-486. doi: 10.1111/coa.13322 [DOI] [PubMed] [Google Scholar]
- 38.Bylund N, Hultcrantz M, Jonsson L, Marsk E. Quality of life in Bell’s palsy: correlation with Sunnybrook and House-Brackmann over time. Laryngoscope. 2021;131(2):E612-E618. doi: 10.1002/lary.28751 [DOI] [PubMed] [Google Scholar]
- 39.Özden F, Karaman ÖN, Tuğay N, Savaş Ö, Sözen T, Üçüncü H. The reliability and validity of the Turkish version of the Facial Disability Index. Disabil Rehabil. 2020;1-10. doi: 10.1080/09638288.2020.1762768 [DOI] [PubMed] [Google Scholar]
- 40.Volk GF, Geitner M, Geißler K, et al. Functional Outcome And Quality Of Life After Hypoglossal-Facial Jump Nerve Suture. Front Surg. 2020;7:11. doi: 10.3389/fsurg.2020.00011 [DOI] [PMC free article] [PubMed] [Google Scholar]
- 41.Borenstein M, Hedges L, Higgins J, Rothstein H.. Comprehensive Meta-Analysis, Version 3. Biostat; 2013. [Google Scholar]
- 42.Higgins JP, Thompson SG, Deeks JJ, Altman DG. Measuring inconsistency in meta-analyses. BMJ. 2003;327(7414):557-560. doi: 10.1136/bmj.327.7414.557 [DOI] [PMC free article] [PubMed] [Google Scholar]
- 43.Deeks JJ HJ, Altman DG; on behalf of the Cochrane Statistical Methods Group . Cochrane Handbook for Systematic Reviews of Interventions version 6.1. September 2020. https://training.cochrane.org/handbook/archive/v6.1
- 44.Tavares-Brito J, Fonseca ACO, Torres RP, et al. Facial Clinimetric Evaluation Scale and Synkinesis Assessment Questionnaire Translation into Brazilian Portuguese: A Validation Study. Int Arch Otorhinolaryngol. 2020;24(1):e24-e30. doi: 10.1055/s-0039-1697992 [DOI] [PMC free article] [PubMed] [Google Scholar]
- 45.Weisscher N, de Haan RJ, Vermeulen M. The impact of disease-related impairments on disability and health-related quality of life: a systematic review. BMC Med Res Methodol. 2007;7:24. doi: 10.1186/1471-2288-7-24 [DOI] [PMC free article] [PubMed] [Google Scholar]
- 46.Nellis JC, Ishii M, Byrne PJ, Boahene KDO, Dey JK, Ishii LE. Association among facial paralysis, depression, and quality of life in facial plastic surgery patients. JAMA Facial Plast Surg. 2017;19(3):190-196. doi: 10.1001/jamafacial.2016.1462 [DOI] [PMC free article] [PubMed] [Google Scholar]
- 47.Pouwels S, Beurskens CH, Kleiss IJ, Ingels KJ. Assessing psychological distress in patients with facial paralysis using the Hospital Anxiety and Depression Scale. J Plast Reconstr Aesthet Surg. 2016;69(8):1066-1071. doi: 10.1016/j.bjps.2016.01.021 [DOI] [PubMed] [Google Scholar]
- 48.Saadi R, Shokri T, Schaefer E, Hollenbeak C, Lighthall JG. Depression rates after facial paralysis. Ann Plast Surg. 2019;83(2):190-194. doi: 10.1097/SAP.0000000000001908 [DOI] [PubMed] [Google Scholar]
- 49.Chang YS, Choi JE, Kim SW, Baek SY, Cho YS. Prevalence and associated factors of facial palsy and lifestyle characteristics: data from the Korean National Health and Nutrition Examination Survey 2010-2012. BMJ Open. 2016;6(11):e012628. doi: 10.1136/bmjopen-2016-012628 [DOI] [PMC free article] [PubMed] [Google Scholar]
- 50.Eviston TJ, Croxson GR, Kennedy PG, Hadlock T, Krishnan AV. Bell’s palsy: aetiology, clinical features and multidisciplinary care. J Neurol Neurosurg Psychiatry. 2015;86(12):1356-1361. doi: 10.1136/jnnp-2014-309563 [DOI] [PubMed] [Google Scholar]
- 51.Butler DP, Grobbelaar AO. Facial palsy: what can the multidisciplinary team do? J Multidiscip Healthc. 2017;10:377-381. doi: 10.2147/JMDH.S125574 [DOI] [PMC free article] [PubMed] [Google Scholar]
- 52.Vrabec JT, Backous DD, Djalilian HR, et al. ; Facial Nerve Disorders Committee . Facial Nerve Grading System 2.0. Otolaryngol Head Neck Surg. 2009;140(4):445-450. doi: 10.1016/j.otohns.2008.12.031 [DOI] [PubMed] [Google Scholar]
- 53.Hohman MH, Hadlock TA. Etiology, diagnosis, and management of facial palsy: 2000 patients at a facial nerve center. Laryngoscope. 2014;124(7):E283-E293. doi: 10.1002/lary.24542 [DOI] [PubMed] [Google Scholar]
- 54.Peitersen E. Bell’s palsy: the spontaneous course of 2,500 peripheral facial nerve palsies of different etiologies. Acta Otolaryngol Suppl. 2002;(549):4-30. doi: 10.1080/000164802760370736 [DOI] [PubMed] [Google Scholar]
- 55.Haraldstad K, Wahl A, Andenæs R, et al. ; LIVSFORSK network . A systematic review of quality of life research in medicine and health sciences. Qual Life Res. 2019;28(10):2641-2650. doi: 10.1007/s11136-019-02214-9 [DOI] [PMC free article] [PubMed] [Google Scholar]
- 56.Mueller M, D’Addario M, Egger M, et al. Methods to systematically review and meta-analyse observational studies: a systematic scoping review of recommendations. BMC Med Res Methodol. 2018;18(1):44. doi: 10.1186/s12874-018-0495-9 [DOI] [PMC free article] [PubMed] [Google Scholar]
- 57.Losilla JM, Oliveras I, Marin-Garcia JA, Vives J. Three risk of bias tools lead to opposite conclusions in observational research synthesis. J Clin Epidemiol. 2018;101:61-72. doi: 10.1016/j.jclinepi.2018.05.021 [DOI] [PubMed] [Google Scholar]
Associated Data
This section collects any data citations, data availability statements, or supplementary materials included in this article.
Supplementary Materials
eTable 1. Search Strategy
eTable 2. Risk of Bias Tool
eTable 3. Risk of Bias Assessment
eTable 4. Meta-analysis of the House-Brackmann, Sunnybrook Facial Grading System and the eFACE Correlated With the Facial Clinimetric Evaluation subdomain Scores
eReferences