

Abstract
Peptide YY (PYY), produced by endocrine L cells in the gut, is known for its critical role in regulating gastrointestinal functions as well as satiety. However, how these processes are integrated with maintaining a healthy gut microbiome composition is unknown. Here, we show that lack of PYY in mice leads to distinct changes in gut microbiome composition that are diet‐dependent. While under chow diet only slight differences in gut microbiome composition could be observed, high‐fat diet (HFD) aggravated these differences. Specifically an increased abundance of the Bacteroidetes phylum with a corresponding decrease of the Firmicutes/Bacteroidetes ratio could be detected in Pyy‐knockout (KO) mice in response to HFD. Detailed analysis of the Bacteroidetes phylum further revealed that the Alistipes genus belonging to the Rikenellaceae family, the Parabacteroides belonging to the Tannerellaceae family, as well as Muribaculum were increased in Pyy‐KO mice. In order to investigate whether these changes are associated with changed markers of gut barrier and immunity, we analyzed the colonic expression of various pro‐inflammatory cytokines, as well as tight junction proteins and mucin 2, and identified increased mRNA expression of the tight junction proteins Cldn2 and Ocel1 in Pyy‐KO mice, while pro‐inflammatory cytokine expression was not significantly altered. Together these results highlight a critical gene‐environment interaction between diet and the gut microbiome and its impact on homeostasis of the intestinal epithelium under conditions of reduced PYY signaling which is commonly seen under obese conditions.
Keywords: food intake, gut hormones, intestinal barrier, intestinal microbiota, obesity
Abbreviations
- Actb
actin‐β
- Cldn2
claudin 2
- DXA
dual‐energy X‐ray absorptiometry
- FM
fat mass
- HFD
high‐fat diet
- LEfSe
linear discriminant analysis Effect Size
- Muc2
mucin 2
- NPY
neuropeptide Y
- Ocel1
occludin/ELL domain containing protein 1
- OTU
operational taxonomic unit
- PP
pancreatic polypeptide
- PCoA
principle coordinate analysis
- PYY
peptide YY
- SCFAs
short chain fatty acids
1. INTRODUCTION
The gut hormone peptide YY (PYY), a member of the neuropeptide Y (NPY) family also including pancreatic polypeptide (PP), is produced in enteroendocrine L cells of the gastrointestinal tract as well as in pancreatic islets. 1 PYY levels increase upon ingestion of a meal proportionally to energy intake and have local paracrine, as well as endocrine effects coordinating postprandial digestion and energy homeostasis. Especially, PYY’s function as a satiety factor by signaling on Y2 receptors in the brain has attracted much attention and has been studied extensively. 2 On the contrary, its local auto‐ and paracrine actions are less explored. Recently, the gut microbiota has emerged as a crucial regulator of PYY secretion. Specifically, gut microbiota ferment ingested dietary fiber to produce short‐chain fatty acids (SCFAs), which through activation of free fatty acid receptors expressed on enteroendocrine L cells induce PYY release. 3 , 4 In addition, intestinal E coli stationary phase proteins increase plasma PYY, 5 further suggesting signaling pathways between the intestinal microbiota and PYY.
The paracrine actions of PYY in the intestine involve a variety of inhibitory functions that lead to the decrease of intestinal motility, anion and electrolyte secretion, thereby facilitating nutrient absorption. 1 PYY fulfills this epithelial antisecretory effects via activation of basolateral Y1 and Y2 receptors via mechanisms including cAMP‐dependent Cl‐ secretion into the lumen, 6 , 7 suggesting that lack of PYY signaling may strongly impact on nutrient resorption as well as gut microbiome composition.
While the pathogenesis of obesity involves complex interactions of genetic and environmental factors, the increased consumption of calorie‐dense diets contributes strongly to the current obesity epidemic. With an increase in food intake and the development of obesity, not only the levels of PYY in the serum are reduced, but also the magnitude in increase upon ingestion of food is significantly lower. 8 , 9 The accompanied change in food preference in obesity away from diets high in fiber could be one of the contributors to this decrease in PYY levels. 10 Going hand in hand with a change in diet, the gut microbiota is also significantly altered, probably further influencing the expression and release of PYY. 11 However, while these findings suggest a signaling pathway between the intestinal microbiota and PYY, the effects of gut‐derived PYY on gut microbiome composition have not been investigated in detail. This work therefore aimed at exploring the impact of lack of PYY signaling on microbiome composition as well as homeostasis of the intestinal epithelium and how these processes are influenced by a dietary challenge with high‐fat diet (HFD).
2. MATERIALS AND METHODS
2.1. Animal models and maintenance
All experimental and animal care procedures were approved by the Garvan Institute/St. Vincent's Hospital Animal Ethics Committee and were conducted in agreement with the Australian Code of Practice for the Care and Use of Animals for Scientific Purposes. Male mice were used for all experiments and were housed under conditions of controlled temperature (22°C) and illumination (12:12 hr light‐dark cycle, lights on at 07:00 am). Pyy‐knockout (KO) mice were generated by removing the entire coding sequence including the initiation start as reported previously. 12 Being originally generated on a C57Bl/6‐129/SvJ background, the mice were backcrossed onto the C57BL/6 strain for at least four generations. Importantly, Pyy‐KO mice and Pyy‐expressing controls were littermates co‐housed in the same cages, in order to minimize effects of maternal transmission and housing conditions on microbiome composition. 13 Mice were provided with ad libitum access to water and a standard chow diet (8% calories from fat, 21% calories from protein, 71% calories from carbohydrate, 2.6 kcal/g; Gordon's Specialty Stock Feeds, Yanderra, NSW, Australia). At 12 weeks of age, mice were subjected to a HFD (43% calories from fat, 17% calories from protein, and 20 MJ/kg; Gordon's Specialty Feeds, Glen Forrest, WA, Australia).
Bodyweight was monitored weekly from 6 to 16 weeks of age. Basal food and water intake were determined at 11 and 16 weeks of age in Pyy‐KO and Pyy‐expressing control mice.
2.2. Body composition and bone densitometry analysis
All mice from both chow‐ and HFD‐fed groups were subjected to an initial body composition analysis using the dual‐energy X‐ray absorptiometry (DXA, Lunar PIXImus2 mouse densitometer; GE Healthcare, Waukesha, WI, USA) system at 8 weeks of age. A second DXA scan was performed at 15 weeks of age. Animals were anesthetized with isoflurane for the scanning procedure to determine fat mass. The head of the animal was excluded while the tail was included for the analysis.
2.3. Tissue collection and analysis
To collect fecal samples, mice were placed in an empty clean cage without bedding and freshly dropped fecal pellets were collected into sterile tubes using a clean tweezer. 14 Fecal samples were stored at −80°C until analysis. Following completion of studies, all mice were sacrificed at 16 weeks of age. A 1‐cm segment of the distal colon was opened longitudinally, washed in autoclaved phosphate‐buffered saline (PBS), and shock‐frozen in dry ice for quantitative polymerase chain reaction (qPCR).
2.4. RNA isolation and quantitative real‐time PCR
Colonic RNA was extracted using an RNeasy Micro Kit (Qiagen) following the manufacturer's instructions. RNA quantification and purity were confirmed by NanoDrop Spectrophotometers. cDNA was synthesized from 100 ng RNA by using the SuperScript III First‐Strand Synthesis System (Thermo Fisher Scientific). RT‐qPCR using primers 15 for various tight junction proteins and pro‐inflammatory cytokines (Table 1) was carried out from 1:5 dilution of cDNA from each sample using the LightCycler (Light‐Cycler 480 Real‐Time PCR system, Roche Applied Science, Germany), SYBR Green I (Molecular Probes), and Platinum Taq DNA Polymerase (Invitrogen). The previously described PCR condition was used in all the RT‐qPCR experiments, 94°C for 30 seconds, 62°C for 30 seconds, and 72°C for 20 seconds for 40 cycles. 16 Expression of the gene was normalized to the expression of the housekeeping gene actin‐β (Actb) (Table 1).
TABLE 1.
Primers used for assaying tight junction protein and pro‐inflammatory cytokine expression
| Target genes | Forward primer | Reverse primer |
|---|---|---|
| Actb | AGCACCCTGTGCTGCTCA | GTACGACCAGAGGCATACA |
| Muc2 | AAGTGTCCTTGCATCCACAA | AGATAGAGCAGGTGCTGTG |
| Cldn1 | CACAGCATGGTATGGAAACA | TGGGTAAGAGGTTGTTTTCC |
| Cldn2 | ATACTACCCTTTAGCCCTGACCGAGA | CAGTAGGAGCACACATAACAGCTACCAC |
| Ocel1 | GAGAGTTTGAGAAGAAGCGA | AGAGTCTTCACTGTTGCTGT |
| Ocln | AGACTACACGACAGGTGGGG | CTGCAGACCTGCATCAAAAT |
| Tjp1 | GCAGACTTCTGGAGGTTTCG | CTTGCCAACTTTTCTCTGGC |
| Ifng | ATCTTGGCTTTGCAGCTCTT | AGTTCCTCCAGATATCCAAG |
| Il6 | CACTTCACAAGTCGGAGGCT | CTGCAAGTGCATCATCGTTGT |
| Il1b | CCCAAAAGATGAAGGGCTGC | AAGGTCCACGGGAAAGACAC |
| Il18 | CCTCTCTGTGAAGGATAGTA | ACTCCATCTTGTTGTGTCCT |
| Tnf | TGCCTATGTCTCAGCCTCTT | ATAGAACTGATGAGAGGGAG |
| Nos2 | GCTACCACATTGAAGAAGCT | TAGGAAAAGACTGCACCGAA |
| Npy1R | GACTCTCACAGGCTGTCTT | TTGGTCTCACTGGACCTGT |
| Npy2R | TTTTCGGAGGCTACCAATGT | AATACAATGGGAGGTCTGCA |
2.5. Microbiome analysis—DNA isolation and PCR amplification
DNA isolation, PCR amplification and sequencing was performed by the Australian Genome Research Facility. Intestinal contents were homogenized on a PowerLyzer Homogenizer and DNA was extracted using the DNeasy PowerSoil Kit (Mo Bio Laboratories, Inc, Carlsbad, CA, USA) according to the manufacturer's instructions. PCR amplicons were generated using the primers and conditions outlined in Table 2, using AmpliTaq Gold 360 Master Mix (Life Technologies, Australia) for the primary PCR. A secondary PCR to index the amplicons was performed with TaKaRa Taq DNA Polymerase (Clontech). The resulting amplicons were measured by fluorometry (Invitrogen PicoGreen) and normalized. The equimolar pool was then measured by qPCR (KAPA) followed by sequencing on the Illumina MiSeq (San Diego, CA, USA) with 2 x 300 base pairs paired‐end chemistry. The data set was processed using the QIIME2 tool on the local Galaxy instance (https://galaxy.medunigraz.at/). Dada2 denoise‐paired algorithm was used for quality filtering, sequencing error corrections, joining reads, chimeras removing, and dereplication. Taxonomic assignment was done based on the Silva 132 database with Naïve Bayes classifier. Diversity analyses were performed on a nonsummarized Amplicon Sequence Variance (ASV) level. Samples were rarefied to 11.989 sequences per sample for Alpha and Beta Diversity calculations. 17 The web‐based software Calypso (http://cgenome.net/wiki/index.php/Calypso) was used for normalization (total sum normalization), transformation (square root transformation), and analysis of the taxonomic data. 18
TABLE 2.
Primers and conditions used for PCR amplification of hypervariable region V1‐V3
| Target | Cycle | Initial | Disassociate | Anneal | Extension | Finish |
|---|---|---|---|---|---|---|
| 16S: V1‐ V3 | 29 | 95°C for 7 min | 94°C for 45 s | 50°C for 60 s | 72°C for 60 s | 72°C for 7 min |
| Target | 27F – 519R | |||||
| Forward Primer (27F) | AGAGTTTGATCMTGGCTCAG | |||||
| Reverse Primer (519R) | GWATTACCGCGGCKGCTG | |||||
2.6. Statistical analysis
Data are presented as means ± SEM. Differences among mouse groups of various genotypes and treatments were assessed by Student's t test, ANOVA or repeated‐measures ANOVA combined with Sidak post hoc analysis where appropriate. Pearson's correlation was calculated for bacterial taxa at genus level that differed between Pyy‐KO and control mice versus gut barrier markers followed by Bonferroni correction. Statistical analyses were performed with GraphPad Prism 6 (GraphPad Software, Inc CA, USA). Linear discriminant analysis (LDA) Effect Size (LEfSe) calculations implemented in Galaxy were used to identify the bacterial communities that differentiate diet and genotype effects. 19 Statistical significance was defined as P ≤.05.
3. RESULTS
3.1. Effects of high‐fat diet on gut microbiome composition in WT and Pyy‐KO mice
In order to assess the impact of lack of PYY signaling on microbiome composition, we used our germline Pyy‐KO model 12 and fed male mice and their littermate controls expressing Pyy a standard chow diet from weaning until the age of 12 weeks when they were changed over to a HFD. To assess the effects of Pyy‐deletion on gut microbiome composition, we analyzed the sequences of bacterial 16S rRNA gene amplicons before and after HFD feeding.
Neither Pyy‐KO nor diet induced changes in alpha diversity, as assessed by Simpson, Shannon and operational taxonomic units (OTUs) (Figure 1A). Using principle coordinate analysis (PCoA) based on Bray Curtis, we compared fecal microbiome composition of controls and Pyy‐KO mice in response to control diet and HFD and could observe significant shifts in the composition in response to HFD, while no significant microbial community changes were induced as a result of PYY‐deficiency (Figure 1B). The average relative abundances of bacterial phyla illustrate increases of the phylum Firmicutes and decreases of the phylum Bacteroidetes in both WT and Pyy‐KO mice in response to HFD (Figure 1C). We further used LEfSe analysis to determine the key variables that separated the gut microbiome in response to HFD irrespective of genotype and identified key differentially abundant taxa between standard chow diet (negative LDA score) and HFD‐fed (positive LDA score) groups (Figure 1D).
FIGURE 1.
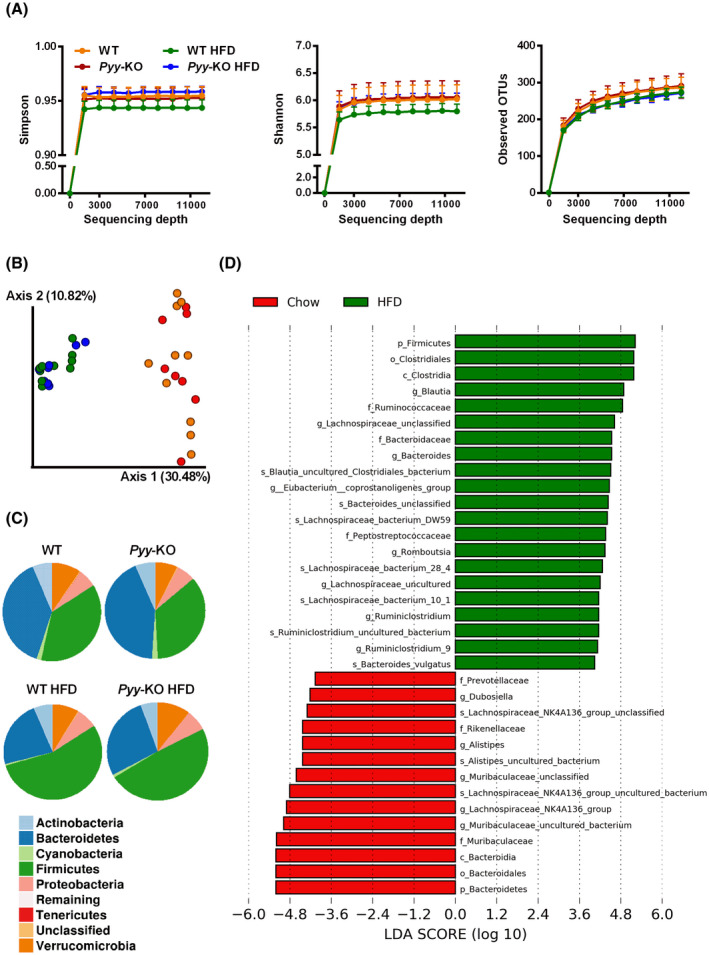
High‐fat diet has a bigger influence on microbiome composition as compared to PYY‐deficiency. Bacterial alpha diversity as assessed by Simpson, Shannon and operational taxonomic units (OTUs) (A). Bacterial communities of controls and Pyy‐KO mice under chow‐fed conditions as well as after 4‐week HFD feeding were clustered using Bray Curtis distance‐based principal coordinates analysis (PCoA). The percentage variation in the plotted principal coordinate (PC) is indicated on the axes (B). Pie charts of the average relative abundances of the bacterial phyla in controls and Pyy‐KO mice on standard chow as well as HFD (C). Most differentially abundant taxa selected by Linear discriminant analysis Effect Size (LEfSe) for diet (D). Green taxa with positive LDA scores enriched in response to HFD. Red taxa with negative LDA scores enriched in response to standard chow diet (D). n = 8‐10
3.2. Effects of PYY‐deficiency on gut microbiome composition in response to high‐fat diet
In order to assess the impact of PYY signaling on microbiome composition, we screened for differentially abundant taxa in Pyy‐KO mice and their littermate controls expressing PYY. While there was no difference between control and Pyy‐KO mice for Firmicutes abundance (Figure 2A), Bacteroidetes abundance was increased in Pyy‐KO mice, irrespective of the diet (Figure 2B). These dynamics led to a decreased Firmicutes/Bacteroidetes ratio in Pyy‐KO mice in response to HFD as compared to control mice (Figure 2C). Analysis of the abundance of bacterial taxa at lower taxonomic ranks revealed that several taxa belonging to Firmicutes were lower in Pyy‐KO mice as compared to their littermate controls in response to HFD (Figure 2D‐F), while taxa belonging to Bacteroidetes were increased in Pyy‐KO mice (Figure 2G,H). The LEfSe method was applied to identify the key phylotypes affected by PYY‐deficiency. While the fecal microbiome of Pyy‐KO mice on standard chow diet was solely characterized by Enterococcaceae (data not shown), HFD feeding led to distinct changes in microbiome composition in Pyy‐KO mice (negative LDA scores) as compared to their Pyy‐expressing littermates (positive LDA scores). Thus, fecal microbiome of Pyy‐KO mice on HFD was characterized by various taxa of the Bacteroidetes phylum including Alistipes belonging to the Rikenellaceae family, Parabacteroides belonging to the Tannerellaceae family, as well as Muribaculum, while Clostridiales bacterium CIEAF 026 and Lachnoclostridium, both belonging to Firmicutes phylum, were enriched in control mice (Figure 2I).
FIGURE 2.
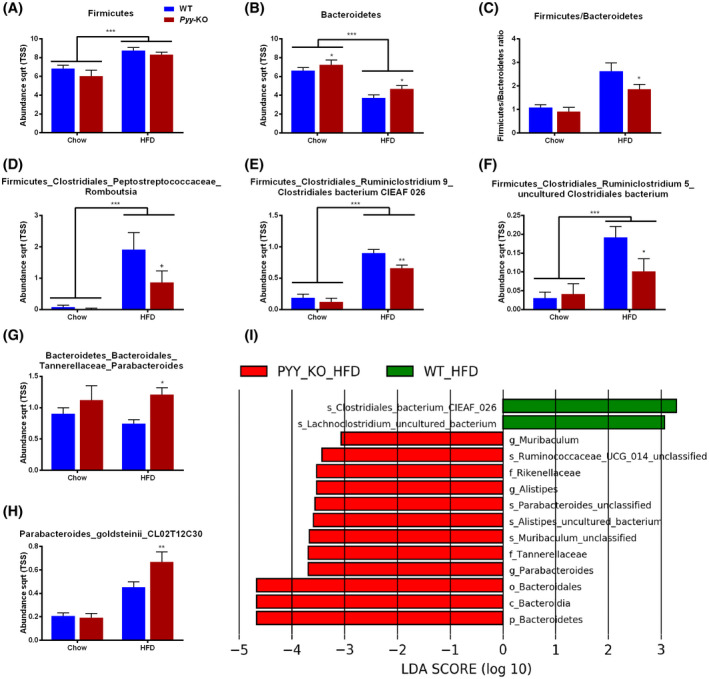
PYY‐deficiency has an impact on fecal microbiome composition in response to high‐fat diet. Abundance (total sum normalization combined with square root transformation) of the bacterial phyla Firmicutes (A) and Bacteroidetes (B), and Firmicutes/Bacteroidetes ratio (C). Bacterial taxa belonging to Firmicutes that are differentially affected by Pyy‐KO in response to HFD (D, E, F). Bacterial taxa belonging to Bacteroidetes that are differentially affected by Pyy‐KO in response to HFD (G, H). Most differentially abundant taxa selected by Linear discriminant analysis Effect Size (LEfSe) for genotype in response to HFD (I). Green taxa with positive LDA scores enriched in control mice in response to HFD. Red taxa with negative LDA scores enriched in Pyy‐KO mice in response to HFD (I). Data are means ± SEM. + P ≤.1; *P ≤.05; **P ≤.01; ***P ≤.001 for Pyy‐KO versus controls on the same diet or as indicated. n = 8‐10
3.3. Effects of high‐fat diet on food intake, bodyweight, and fat mass in Pyy‐KO mice
Bodyweight and body composition as well as food intake were monitored over the entire period in order to screen for metabolic effects of PYY‐deficiency. In line with PYY’s satiogenic effect Pyy‐KO mice displayed increased food intake in response to HFD (Figure 3A), while the increase in overall body weight and fat mass in response to HFD were comparable between controls and Pyy‐KO mice (Figure 3B,C).
FIGURE 3.
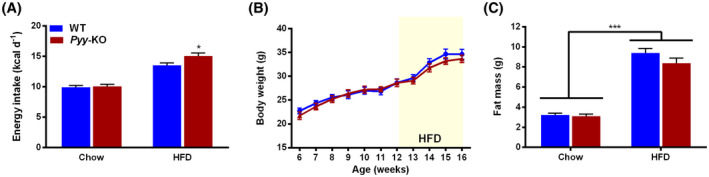
Pyy‐knockout increases food intake without affecting fat mass in response to high‐fat diet. Daily spontaneous/basal food intake during fed state expressed as kcal d‐1 in control and Pyy‐KO mice under standard chow and HFD (A). Absolute bodyweight measured weekly in controls and Pyy‐KO mice (B). Whole body fat mass determined by DXA under standard chow and HFD (C). Data are means ± SEM. *P ≤.05; ***P ≤.001 for Pyy‐KO versus controls on the same diet or as indicated. n = 8‐10
3.4. Pyy‐KO is associated with higher expression of tight junction proteins
Given the changes in gut microbiome composition in Pyy‐KO mice in response to HFD, we next assessed whether these changes are associated with changes in the expression of mucin 2 (Muc2), tight junction proteins, and pro‐inflammatory cytokines. Interestingly, we could observe an increase in mRNA expression of the tight junction proteins Occludin/ELL Domain Containing Protein 1 (Ocel1) and Claudin 2 (Cldn2) in Pyy‐KO mice, while the expression of other tight junction proteins was left unchanged (Figure 4A). We further observed a trend toward increased expression of the pro‐inflammatory cytokines interferon‐ɣ (Ifn‐ɣ; P =.1) and interleukin‐6 (Il‐6; P =.057) (Figure 4B).
FIGURE 4.
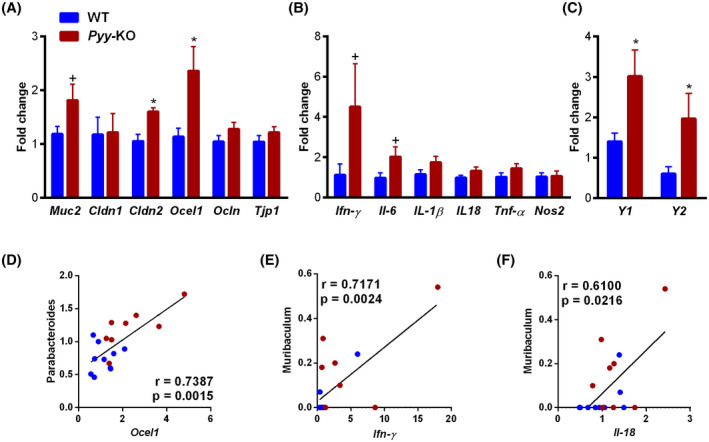
PYY‐deficiency increases Cldn2, Ocel1, and Y‐receptor mRNA expression. mRNA expression of Muc2 and tight junction proteins (A), pro‐inflammatory cytokines (B), and Y‐receptors (C). Correlations of abundance of bacterial taxa with Ocel1 (D), Ifn‐ɣ (E), and Il‐18 (F). Data are means ± SEM. + P ≤.1; *P ≤.05 for Pyy‐KO versus controls. n = 8‐10
In order to assess how lack of PYY affects the expression of its main intestinal receptors, we analyzed the expression of Y1 and Y2 receptors (Figure 4C). As expected, the expression of these receptors increased in the absence of their ligand PYY.
Correlation analyses were further performed based on the bacterial taxa that differed at genus level. A positive correlation between Parabacteroides and Ocel1 was evident (Figure 4D), while Muribaculum displayed positive correlations with Ifn‐ɣ and Il‐18 (Figure 4E,F).
4. DISCUSSION
This study demonstrates that in addition to the well‐known intestinal effects of PYY as an antisecretory agent and being a mediator of the ileal brake, PYY also controls microbiome composition since lack of PYY leads to strong dysregulation. This is especially obvious in response to a dietary challenge with HFD, which is also associated with alterations in the expression of markers of intestinal barrier function. While diet had a bigger impact on microbiome composition as compared to genotype, confirming previous findings, 20 we could demonstrate that a 4‐week HFD feeding also leads to distinct changes in gut microbiome composition in Pyy‐KO mice, as compared to their littermate controls expressing PYY. Fecal microbiome composition of HFD‐fed Pyy‐KO mice was characterized by increased abundance of bacterial taxa belonging to the Bacteroidetes phylum (Tannerellaceae_Parabacteroides, Rikenellaceae_Alistipes, Muribaculum), while taxa of the Firmicutes phylum (Ruminiclostridium_Clostridiales bacterium, Lachnoclostridium_uncultured bacterium) were enriched in WT mice in response to HFD. Accordingly, the characteristic increase of the Firmicutes/Bacteroidetes ratio in response to HFD was blunted in Pyy‐KO mice. The observed changes in microbiome composition were associated with increased expression levels of the pore‐forming tight junction protein Cldn2, as well as Ocel1 in Pyy‐KO mice. 21
In line with PYY’s ability to induce the ileal brake and inhibit epithelial electrolyte secretion, upper intestinal transit has been demonstrated to be faster in Pyy‐KO mice, being one plausible reason for the observed changes in gut microbiome composition in Pyy‐KO mice. 22 Furthermore, a polyethylene glycol‐induced increase in gut motility has been shown to lead to increased abundance of Bacteroidaceae, 23 , 24 while a morphine‐induced decrease of gut motility and secretion leads to a decreased abundance of Bacteroidales. 25
More detailed analysis of the Bacteroidetes phylum revealed that the Alistipes genus belonging to the Rikenellaceae family, Parabacteroides belonging to the Tannerellaceae family, as well as Muribaculum were increased in Pyy‐KO mice, especially in response to HFD. Alistipes represents a relatively new bacterial genus being implicated in the modulation of colitis and colorectal cancer, among others. 26 Interestingly, Alistipes and Muribaculum have a similar pattern of functional distribution as demonstrated by metagenomic and metatranscriptomic analyses. 27 Taxa belonging to the Muribaculum genus, previously classified as S24‐7, are specialized in bile acid deconjugation, among others 28 , 29 and have been reported to be decreased in constipation. 30 In the present study, we observed a positive correlation between the genus Muribaculum and colonic pro‐inflammatory cytokine expression. In line with this finding, Muribaculum has been reported to be overrepresented in mice developing inflammation in the T‐cell transfer model of chronic colitis, 31 suggesting a potential pro‐inflammatory capacity of this genus. In general, despite its high genomic diversity, the Bacteroidetes phylum is characterized by a high polysaccharide utilization capacity, which enables them to degrade both dietary and host mucosal glycans. 32 , 33 Interestingly, a fiber‐free diet has been demonstrated to induce an increase of mucus‐degrading bacteria, leading to mucus degradation and a compensatory increase in Muc2 expression, 34 which is critical for the formation of the intestinal mucus barrier. 35 Importantly, an upregulation of Muc2 expression in colon epithelial cells has also been reported to be induced by pathogens as well as pro‐inflammatory cytokines. 36 , 37
In addition to the mucus barrier, tight junction proteins are important for maintaining a selective barrier function. While several tight junction proteins decrease epithelial permeability, Cldn2 is a pore‐forming tight junction protein creating cation selective pores leading to increased permeability of the intestinal epithelium. 38 Cldn2 expression is upregulated by pro‐inflammatory cytokines and shows higher expression under inflammatory conditions such as inflammatory bowel disease. 39 Similarly, Ocel1 has been demonstrated to be necessary for cytokine‐induced occludin mobilization, internalization, and barrier loss 21 and has been proposed to enhance epithelial apoptosis through increased caspase‐3 transcription. 40 In an attempt to deduce potential associations between differentially changed microbial taxa and altered colonic barrier markers, we screened for significant correlations and observed positive correlations between Parabacteroides and Ocel1. In line with this finding, increased abundance of Parabacteroides has been associated with a penetrable mucus barrier. 41 , 42 , 43
As expected, expression of intestinal Y‐receptors was increased due to knockout of their ligand PYY. 44 Interestingly, a recent publication investigated interactions between metabolites of the intestinal microbiota and various receptors including Y1 and Y2. 45 No agonism could be demonstrated between microbial metabolites and Y1 or Y2 receptors. We therefore hypothesize that upregulation of Y1 and Y2 receptors per se does not affect interactions between microbial metabolites and Y‐receptors.
Postprandial release of PYY has been repeatedly reported to be attenuated in obese patients. 46 On the contrary, caloric restriction is able to ameliorate the blunted PYY‐release seen in obesity leading to increased PYY‐release in response to a high‐fat meal, 47 while increased postprandial secretion of PYY after Roux‐en‐Y gastric bypass contributes to appetite reduction and weight loss after surgery. 48 Moreover, it has been demonstrated that both mice and humans show differential patterns of PYY‐release in response to a standardized meal, which correlates with satiety scores. 8 While the underlying mechanisms of these differing responses have not been fully identified, diet‐microbiome interactions are likely to be involved. 49 , 50 Pyy‐KO mice are thus a suitable model of blunted PYY‐release as observed in obese patients. 46 While we observed an expected increase in food intake in Pyy‐KO mice, bodyweight and composition were comparable in the littermates expressing PYY. This metabolic phenotype is in line with the previously published findings in Pyy‐KO mice, were increases in fat mass in Pyy‐KO as compared to WT controls usually develop after a longer period of HFD feeding as well as in response to an earlier onset of HFD feeding. 51
In conclusion, this paper is the first to describe gut microbiome perturbations in mice lacking PYY signaling, especially demonstrating that in response to HFD this leads to increased abundance of bacterial taxa belonging to the Bacteroidetes phylum (Tannerellaceae_Parabacteroides, Rikenellaceae_Alistipes, and Muribaculum) and associated changes in the mRNA expression of tight junction proteins Cldn2 and Ocel1. Together these results highlight a critical gene‐environment interaction between diet and the gut microbiome with the potential to affect homeostasis of the intestinal epithelium under reduced PYY signaling. Intestinal PYY signaling thus regulates gut microbiome composition and tight junction expression in response to HFD.
CONFLICT OF INTEREST
No potential conflicts of interest associated with this article were reported and there has been no significant financial support for this work that could have influenced its outcome.
AUTHOR CONTRIBUTIONS
A. Farzi, P. Holzer, and H. Herzog designed the research; A. Farzi, C. K. Ip, F. Reed, R. Enriquez, and G. Zenz performed research; M. Durdevic and L. Zhang analyzed data; A. Farzi and H. Herzog wrote the paper.
ACKNOWLEDGMENTS
This research was supported by the National Health and Medical Research Council of Australia (NHMRC #1124723), a Research Fellowship to HH (NHMRC #118775), and the Austrian Science Fund (FWF grant J‐3814) to AF. We would like to thank Angela Horvath for her assistance with microbiome analysis.
Farzi A, Kin Ip C, Reed F, et al. Lack of peptide YY signaling in mice disturbs gut microbiome composition in response to high‐fat diet. The FASEB Journal. 2021;35:e21435. 10.1096/fj.202002215R
Contributor Information
Aitak Farzi, Email: aitak.farzi@medunigraz.at.
Herbert Herzog, Email: h.herzog@garvan.org.au.
REFERENCES
- 1. Cox HM. Peptide YY: a neuroendocrine neighbor of note. Peptides. 2007;28:345‐351. [DOI] [PubMed] [Google Scholar]
- 2. Batterham RL, Cowley MA, Small CJ, et al. Gut hormone PYY(3–36) physiologically inhibits food intake. Nature. 2002;418:650‐654. [DOI] [PubMed] [Google Scholar]
- 3. Psichas A, Sleeth ML, Murphy KG, et al. The short chain fatty acid propionate stimulates GLP‐1 and PYY secretion via free fatty acid receptor 2 in rodents. Int J Obes. 2015;39:424‐429. [DOI] [PMC free article] [PubMed] [Google Scholar]
- 4. Cox HM, Tough IR, Woolston AM, et al. Peptide YY is critical for acylethanolamine receptor Gpr119‐induced activation of gastrointestinal mucosal responses. Cell Metab. 2010;11:532‐542. [DOI] [PMC free article] [PubMed] [Google Scholar]
- 5. Breton J, Tennoune N, Lucas N, et al. Gut commensal E. coli proteins activate host satiety pathways following nutrient‐induced bacterial growth. Cell Metab. 2016;23:324‐334. [DOI] [PubMed] [Google Scholar]
- 6. Cox HM. Neuropeptide Y receptors; antisecretory control of intestinal epithelial function. Auton Neurosci. 2007;133:76‐85. [DOI] [PubMed] [Google Scholar]
- 7. Souli A, Chariot J, Voisin T, et al. Several receptors mediate the antisecretory effect of peptide YY, neuropeptide Y, and pancreatic polypeptide on VIP‐induced fluid secretion in the rat jejunum in vivo. Peptides. 1997;18:551‐557. [DOI] [PubMed] [Google Scholar]
- 8. Karra E, Chandarana K, Batterham RL. The role of peptide YY in appetite regulation and obesity. J Physiol. 2009;587:19‐25. [DOI] [PMC free article] [PubMed] [Google Scholar]
- 9. Mushref MA, Srinivasan S. Effect of high fat‐diet and obesity on gastrointestinal motility. Ann Transl Med. 2013;1:14. [DOI] [PMC free article] [PubMed] [Google Scholar]
- 10. Adam CL, Thomson LM, Williams PA, Ross AW. Soluble fermentable dietary fibre (pectin) decreases caloric intake, adiposity and lipidaemia in high‐fat diet‐induced obese rats. PLoS ONE. 2015;10:e0140392. [DOI] [PMC free article] [PubMed] [Google Scholar]
- 11. Ye L, Mueller O, Bagwell J, Bagnat M, Liddle RA, Rawls JF. High fat diet induces microbiota‐dependent silencing of enteroendocrine cells. eLife. 2019;8:e48479 [DOI] [PMC free article] [PubMed] [Google Scholar]
- 12. Zhang L, Nguyen AD, Lee IC, et al. NPY modulates PYY function in the regulation of energy balance and glucose homeostasis. Diabetes Obes Metab. 2012;14:727‐736. [DOI] [PubMed] [Google Scholar]
- 13. Robertson SJ, Lemire P, Maughan H, et al. Comparison of co‐housing and littermate methods for microbiota standardization in mouse models. Cell Rep. 2019;27:1910‐1919 e2. [DOI] [PubMed] [Google Scholar]
- 14. Nagpal R, Wang S, Solberg Woods LC, et al. Comparative microbiome signatures and short‐chain fatty acids in mouse, rat, non‐human primate, and human feces. Front Microbiol. 2018;9:2897. [DOI] [PMC free article] [PubMed] [Google Scholar]
- 15. L’Huillier C, Jarbeau M, Achamrah N, et al. Glutamine, but not branched‐chain amino acids, restores intestinal barrier function during activity‐based anorexia. Nutrients. 2019;11. [DOI] [PMC free article] [PubMed] [Google Scholar]
- 16. Ip CK, Zhang L, Farzi A, et al. Amygdala NPY circuits promote the development of accelerated obesity under chronic stress conditions. Cell Metab. 2019;30:111‐128 e6. [DOI] [PubMed] [Google Scholar]
- 17. Caporaso JG, Kuczynski J, Stombaugh J, et al. QIIME allows analysis of high‐throughput community sequencing data. Nat Methods. 2010;7:335‐336. [DOI] [PMC free article] [PubMed] [Google Scholar]
- 18. Zakrzewski M, Proietti C, Ellis JJ, et al. Calypso: a user‐friendly web‐server for mining and visualizing microbiome‐environment interactions. Bioinformatics. 2017;33:782‐783. [DOI] [PMC free article] [PubMed] [Google Scholar]
- 19. Segata N, Izard J, Waldron L, et al. Metagenomic biomarker discovery and explanation. Genome Biol. 2011;12:R60. [DOI] [PMC free article] [PubMed] [Google Scholar]
- 20. Rothschild D, Weissbrod O, Barkan E, et al. Environment dominates over host genetics in shaping human gut microbiota. Nature. 2018;555:210‐215. [DOI] [PubMed] [Google Scholar]
- 21. Buschmann MM, Shen L, Rajapakse H, et al. Occludin OCEL‐domain interactions are required for maintenance and regulation of the tight junction barrier to macromolecular flux. Mol Biol Cell. 2013;24:3056‐3068. [DOI] [PMC free article] [PubMed] [Google Scholar]
- 22. Forbes SC, Cox HM. Peptide YY, neuropeptide Y and corticotrophin‐releasing factor modulate gastrointestinal motility and food intake during acute stress. Neurogastroenterol Motil. 2014;26:1605‐1614. [DOI] [PubMed] [Google Scholar]
- 23. Kashyap PC, Marcobal A, Ursell LK, et al. Complex interactions among diet, gastrointestinal transit, and gut microbiota in humanized mice. Gastroenterology. 2013;144:967‐977. [DOI] [PMC free article] [PubMed] [Google Scholar]
- 24. Shobar RM, Velineni S, Keshavarzian A, et al. The effects of bowel preparation on microbiota‐related metrics differ in health and in inflammatory bowel disease and for the mucosal and luminal microbiota compartments. Clin Transl Gastroenterol. 2016;7:e143. [DOI] [PMC free article] [PubMed] [Google Scholar]
- 25. Kang M, Mischel RA, Bhave S, et al. The effect of gut microbiome on tolerance to morphine mediated antinociception in mice. Sci Rep. 2017;7:42658. [DOI] [PMC free article] [PubMed] [Google Scholar]
- 26. Parker BJ, Wearsch PA, Veloo ACM, Rodriguez‐Palacios A. The genus Alistipes: gut bacteria with emerging implications to inflammation, cancer, and mental health. Front Immunol. 2020;11. [DOI] [PMC free article] [PubMed] [Google Scholar]
- 27. Chung YW, Gwak HJ, Moon S, Rho M, Ryu JH. Functional dynamics of bacterial species in the mouse gut microbiome revealed by metagenomic and metatranscriptomic analyses. PLoS ONE. 2020;15:e0227886. [DOI] [PMC free article] [PubMed] [Google Scholar]
- 28. Smith BJ, Miller RA, Ericsson AC, Harrison DC, Strong R, Schmidt TM. Changes in the gut microbiome and fermentation products concurrent with enhanced longevity in acarbose‐treated mice. BMC Microbiol. 2019;19:130. [DOI] [PMC free article] [PubMed] [Google Scholar]
- 29. Marion S, Desharnais L, Studer N, et al. Biogeography of microbial bile acid transformations along the murine gut. J Lipid Res. 2020;61:1450‐1463. [DOI] [PMC free article] [PubMed] [Google Scholar]
- 30. Liu D, Li T, Zheng H, et al. Study on alterations of physiological functions in aged constipation rats with fluid‐deficiency based on metabonomic and microbiology analysis. RSC Adv. 2017;7:48136‐48150. [Google Scholar]
- 31. Reinoso Webb C, den Bakker H, Koboziev I, et al. Differential susceptibility to T cell‐induced colitis in mice: role of the intestinal microbiota. Inflamm Bowel Dis. 2018;24:361‐379. [DOI] [PMC free article] [PubMed] [Google Scholar]
- 32. Johnson EL, Heaver SL, Walters WA, Ley RE. Microbiome and metabolic disease: revisiting the bacterial phylum Bacteroidetes. J Mol Med. 2017;95:1‐8. [DOI] [PMC free article] [PubMed] [Google Scholar]
- 33. Lapebie P, Lombard V, Drula E, Terrapon N, Henrissat B. Bacteroidetes use thousands of enzyme combinations to break down glycans. Nat Commun. 2019;10:2043. [DOI] [PMC free article] [PubMed] [Google Scholar]
- 34. Desai MS, Seekatz AM, Koropatkin NM, et al. A dietary fiber‐deprived gut microbiota degrades the colonic mucus barrier and enhances pathogen susceptibility. Cell. 2016;167:1339‐1353 e1321. [DOI] [PMC free article] [PubMed] [Google Scholar]
- 35. Allaire JM, Morampudi V, Crowley SM, et al. Frontline defenders: goblet cell mediators dictate host‐microbe interactions in the intestinal tract during health and disease. Am J Physiol Gastrointest Liver Physiol. 2018;314:G360‐G377. [DOI] [PMC free article] [PubMed] [Google Scholar]
- 36. Ahn DH, Crawley SC, Hokari R, et al. TNF‐alpha activates MUC2 transcription via NF‐kappaB but inhibits via JNK activation. Cell Physiol Biochem. 2005;15:29‐40. [DOI] [PubMed] [Google Scholar]
- 37. Leon‐Coria A, Kumar M, Moreau F, Chadee K. Defining cooperative roles for colonic microbiota and Muc2 mucin in mediating innate host defense against Entamoeba histolytica . PLoS Pathog. 2018;14:e1007466. [DOI] [PMC free article] [PubMed] [Google Scholar]
- 38. Van Itallie CM, Anderson JM. Claudins and epithelial paracellular transport. Annu Rev Physiol. 2006;68:403‐429. [DOI] [PubMed] [Google Scholar]
- 39. Zeissig S, Burgel N, Gunzel D, et al. Changes in expression and distribution of claudin 2, 5 and 8 lead to discontinuous tight junctions and barrier dysfunction in active Crohn's disease. Gut. 2007;56:61‐72. [DOI] [PMC free article] [PubMed] [Google Scholar]
- 40. Kuo WT, Shen L, Zuo L, et al. Inflammation‐induced occludin downregulation limits epithelial apoptosis by suppressing caspase‐3 expression. Gastroenterology. 2019;157:1323‐1337. [DOI] [PMC free article] [PubMed] [Google Scholar]
- 41. Rodriguez‐Pineiro AM, Johansson ME. The colonic mucus protection depends on the microbiota. Gut Microbes. 2015;6:326‐330. [DOI] [PMC free article] [PubMed] [Google Scholar]
- 42. Dicksved J, Schreiber O, Willing B, et al. Lactobacillus reuteri maintains a functional mucosal barrier during DSS treatment despite mucus layer dysfunction. PLoS ONE. 2012;7:e46399. [DOI] [PMC free article] [PubMed] [Google Scholar]
- 43. Jakobsson HE, Rodriguez‐Pineiro AM, Schutte A, et al. The composition of the gut microbiota shapes the colon mucus barrier. EMBO Rep. 2015;16:164‐177. [DOI] [PMC free article] [PubMed] [Google Scholar]
- 44. Trivedi PG, Yu H, Trumbauer M, Chen H, Van der Ploeg LH, Guan X. Differential regulation of neuropeptide Y receptors in the brains of NPY knock‐out mice. Peptides. 2001;22:395‐403. [DOI] [PubMed] [Google Scholar]
- 45. Colosimo DA, Kohn JA, Luo PM, et al. Mapping interactions of microbial metabolites with human G‐protein‐coupled receptors. Cell Host Microbe. 2019;26:273‐282 e277. [DOI] [PMC free article] [PubMed] [Google Scholar]
- 46. Lean ME, Malkova D. Altered gut and adipose tissue hormones in overweight and obese individuals: cause or consequence? Int J Obes. 2016;40:622‐632. [DOI] [PMC free article] [PubMed] [Google Scholar]
- 47. Brennan IM, Seimon RV, Luscombe‐Marsh ND, Otto B, Horowitz M, Feinle‐Bisset C. Effects of acute dietary restriction on gut motor, hormone and energy intake responses to duodenal fat in obese men. Int J Obes. 2011;35:448‐456. [DOI] [PubMed] [Google Scholar]
- 48. Svane MS, Jorgensen NB, Bojsen‐Moller KN, et al. Peptide YY and glucagon‐like peptide‐1 contribute to decreased food intake after Roux‐en‐Y gastric bypass surgery. Int J Obes. 2016;40:1699‐1706. [DOI] [PubMed] [Google Scholar]
- 49. Fernandes SP, Alessi J, Santos ZEA, de Mello ED. Association between eating behavior, anthropometric and biochemical measurements, and peptide YY (PYY) hormone levels in obese adolescents in outpatient care. J Pediatr Endocrinol Metab. 2020;33:873‐877. [DOI] [PubMed] [Google Scholar]
- 50. Cani PD, Lecourt E, Dewulf EM, et al. Gut microbiota fermentation of prebiotics increases satietogenic and incretin gut peptide production with consequences for appetite sensation and glucose response after a meal. Am J Clin Nutr. 2009;90:1236‐1243. [DOI] [PubMed] [Google Scholar]
- 51. Boey D, Lin S, Karl T, et al. Peptide YY ablation in mice leads to the development of hyperinsulinaemia and obesity. Diabetologia. 2006;49:1360‐1370. [DOI] [PubMed] [Google Scholar]