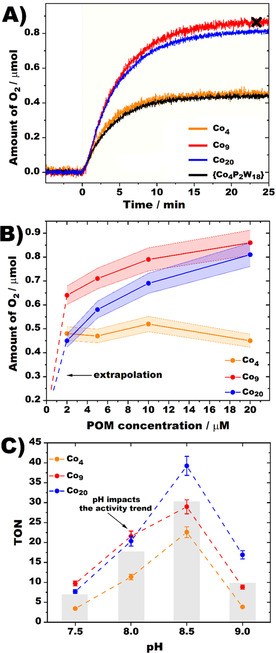
Figure 2.

(A) As‐recorded O2 evolution profiles for Co4, Co9 and Co20 compounds along with the reference {Co4P2W18}, measured from 20 μm POM solutions buffered in 80 mm borate buffer at pH 8 and containing Na2S2O8 (5 mm) and [Ru(bpy)3]2+ (1 mm) as an oxidant and a photosensitizer, respectively. (B) Recorded oxygen evolution amounts as a function of POM catalyst concentrations measured for 2, 5, 10 and 20 μm values. A summary of as‐recorded profiles is shown in Figure S23. (C) Amount of generated O2 plotted as TONs as a function of pH (7.5–9). The bars indicate an average O2 amount generated by all three catalysts at a certain pH to demonstrate a cumulative effect of pH on activity. For all conditions, a monochromatic visible LED (λ max=445±13 nm) was chosen as light source to trigger photocatalytic reaction.
