

Abstract
α‐Synuclein aggregation is a hallmark of Parkinson's disease and a promising biomarker for early detection and assessment of disease progression. The prospect of a molecular test for Parkinson's disease is materializing with the recent developments of detection methods based on amplification of synuclein seeds (e.g. RT‐QuIC or PMCA). Here we adapted single‐molecule counting methods for the detection of α‐synuclein aggregates in cerebrospinal fluid (CSF), using a simple 3D printed microscope. Single‐molecule methods enable to probe the early events in the amplification process used in RT‐QuIC and a precise counting of ThT‐positive aggregates. Importantly, the use of single‐molecule counting also allows a refined characterization of the samples and fingerprinting of the protein aggregates present in CSF of patients. The fingerprinting of size and reactivity of individual aggregate shows a unique signature for each PD patients compared to controls and may provide new insights on synucleinopathies in the future.
Keywords: confocal spectroscopy, isothermal amplification, Parkinson's disease, single-molecule counting, α-synuclein
A new single‐molecule method was established for the detection of α‐synuclein fibrils, a promising biomarker of Parkinson's disease (PD). Individual ThT(+) aggregates were fingerprinted and amplified to improve detection limits by 3 orders of magnitude, compared to direct detection. A difference of behaviour was detected between PD and control samples.

Introduction
α‐Synuclein (αSyn) aggregation has been linked to many neurodegenerative diseases which collectively are classified as synucleopathies. [1] Synucleopathies, [2] including Parkinson's disease (PD), dementia with Lewy bodies (DLB) and multiple system atrophy (MSA), are characterized by the formation of abnormal protein aggregates in neurons, nerve cells and glial cells, called Lewy bodies. Earlier studies have established that αSyn was the main component of the Lewy bodies. [3] Furthermore, links between familial forms of PD and αSyn mutations[ 3b , 4 ] or duplications of gene encoding αSyn [5] were soon identified, leading to the hypothesis that αSyn aggregation played an important role in disease genesis and progression.
Association between aggregation of αSyn and disease progression [6] has made it a promising target for biomarker development. [7] So far, the diagnosis for synucleinopathies is based on the recognition of clinical symptoms, which represent advanced stages of these diseases. [8] The absence of quantitative biomarkers also hinders the development of therapies to treat the cause of these diseases. Yet, αSyn aggregation pathway has been extensively studied biophysically. [9] αSyn is known to form Thioflavin‐T (ThT) positive amyloid fibrils. Upon binding to β sheet‐rich structures, ThT fluorescence is enhanced and shifted towards the red, making ThT a common diagnostic tool for amyloid and a reference assay for aggregation kinetics. [10] αSyn fibrils can seed the fibrillation of monomeric αSyn, in a prion‐like manner, [11] which have been exploited to design various αSyn detection assays. [12]
Recent developments of these seeding assays, either Protein‐Misfolding Cyclic Amplification (PMCA) [13] or Real‐Time Quaking‐Induced conversion (RT‐QuIC), [14] have shown promising results, renewing the interest in the study of αSyn aggregation. Indeed, PMCA and RT‐QuIC have the ability of detecting αSyn aggregates in biological samples (brain homogenate and cerebral spinal fluid (CSF) with high (>90 %) selectivity and specificity. [15] Trials are ongoing to transpose these techniques to clinical set‐up. [16] However, these techniques are time consuming (upwards of 50–60 hours), rely on repeated sonication and/or heating steps, all of which can impede the reproducibility of these assays.
In this study, we use single molecule counting (SMC) to detect minute amount of aggregated material, with high sensitivity. More specifically, we used AttoBright, a single molecule fluorescence 3D‐printed microscope, [17] to detect the fibrillar species of αSyn in the presence of ThT. To increase reproducibility, we developed a one‐step, non‐shaking, temperature‐dependent amplification assay that allows us to detect αSyn aggregates with sensitivity of 1 femtomolar (fM) of αSyn fibrils in buffer, in 5 h. More importantly, we show that this assay can detect αSyn aggregates in patients CSF and discriminate between PD patients and healthy controls.
Results
Single molecule spectroscopy detects aggregation at earlier time points
Single molecule counting (SMC) using confocal spectroscopy [18] is able to detect aggregated material sensitively and reliably. [19] In this case, detection of αSyn aggregates is obtained by focusing a laser in solution; this creates a small excitation volume in which single aggregates can be counted one‐by‐one. Far from interference by surfaces, protein aggregates diffuse freely in the sample; when they enter the excitation volume, ThT‐positive aggregates create a large burst of fluorescence signal that is easily differentiated from a baseline of unbound ThT, see Figure 1 A,B. The single molecule counting modules capture many features of the individual bursts: maximal burst intensity and integral of the peak (which correlates with the number of ThT fluorophores bound), as well as duration of the burst (which gives information on the physical size of the diffusing aggregates), [19c] as shown in Figure 1 C.
Figure 1.

Detection of individual ThT‐positive aggregates using single molecule counting. A) Principle of single molecule detection: a very small (femtolitre) detection volume is coupled to single photon detectors, in order to measure freely diffusing single particles with high sensitivity. As fluorescently labelled particles diffuse in and out of the confocal volume, bursts of photons are collected by the detectors. B) In single molecule experiments, bulk ThT is deconvoluted into baseline and individual peaks. C) Principle of fingerprinting of each individual peak; the number of photons detected correlates with the number of fluorophores and the residence time of the aggregates. D) Total ThT fluorescence as a function of time. αSyn WT aggregation was detected by increased ThT fluorescence in the absence (red) and presence (blue) of 1 nM seed, using either a plate reader (light red/light blue) or AttoBright (bright red/ bright blue). E) ThT signal measured on a plate reader for the first 10 h, as in (A). No difference is visible between unseeded (light pink) and seeded (light blue) reactions in this time frame. F) The same experiment as in (B) performed on AttoBright shows a marked difference between seeded (bright blue) and unseeded (bright red) experiments; note that at t=0, the presence of seeds (1 nM) is already detectable. Error bars are mean ± s.d of 3× 400 s measurements.
Typically, single molecule experiments are conducted on high‐end instruments, either large and expensive commercial confocal microscopes, or home‐made setups that cannot be replicated easily by other groups. We envisaged that instruments need to be made truly plug‐and‐play to reach non‐specialists and used 3D printing to create an ultra‐compact microscope, the “AttoBright”, that performs single molecule detection in a user‐friendly format. We recently showed that AttoBright had enhanced sensitivity as compared with a bulk fluorescence assay with an ability to detect ThT positive fibrillar species down to pM concentrations. [17] In this work, we will demonstrate how this enhanced sensitivity can be exploited to accelerate the detection of aggregates by seeding assay.
We first compared the data obtained for seeded vs. unseeded aggregation assays, using a fluorescent plate reader and AttoBright (Figure 1 D–F). A typical amyloid aggregation assay exhibits sigmoidal growth kinetics, broadly described by a lag phase followed by a growth phase and final plateau. [20] 50 μM αSyn (PBS, pH 7.4) was incubated at 37 °C with orbital shaking at 500 rpm in the presence and absence of 1 nM seed fibrils. Aliquots were taken and total fluorescence intensity was measured on both the fluorescence plate reader (Figure 1 D,E) and the AttoBright (Figure 1 D and F). In bulk fluorescence detection (using the fluorescence plate reader), a significant deviation from time 0 was detected after 11 h (seeded, blue) or 20 h (unseeded, red). Using SMC (on AttoBright), ThT‐positive events were detected at time 0 for the seeded experiment (Figure 1 F, blue), since the seed concentration is above the detection limit of the instrument [17] and after 5 h for the unseeded experiment (Figure 1 F, red). As expected, the use of single molecule detection lowers the detection limit and greatly accelerates the detection of aggregates upon seeding assays. These experiments also revealed that shaking reliably small reaction volumes is unpractical, and that unseeded aggregation needs to be tightly controlled.
Hence, we first examined the effect of the reaction conditions on αSyn aggregation to define an optimized protocol for aggregate detection. αSyn amplification assays, PMCA and RT‐QuIC, have used shaking or sonication to promote amplification of the αSyn fibrils. [12] To capitalize on the fact that SMC only requires small amounts of sample (typically 20 μL), we first modified the amplification protocol to remove the sonication or shaking steps that may introduce variability on small samples. Thermal agitation may provide the necessary energy for elongation or nucleation of αSyn. [21] Therefore, we made use of a PCR machine for even heating of the sample and tested different temperatures to promote fibrillation of αSyn.
To remove any undesired aggregates that could be present in monomeric αSyn (even after size‐exclusion chromatography), we used a filtration step with a 100 kDa cut‐off before each experiment. We then tested the thermal stability of αSyn monomers at different temperatures, monitoring the ThT baseline for any spontaneous conversion of monomers into ThT‐positive aggregates. As shown in Figure S1, we found that above 50 °C, filtered αSyn WT can spontaneously form aggregates within 5 h; these aggregates in unseeded controls would contribute false‐positive events. Previous reports [22] have used the mutant K23Q of αSyn as a more stable monomer “amplifier”. Indeed, in our hands, the K23Q monomer remained stable across all tested temperatures for up to 5 h, though some individual peaks could be detected after incubation at 68 °C and 70 °C (Figure S2). Using this K23Q mutant as the monomer “amplifier”, we then tested the optimal temperature for amplification of αSyn aggregates.
Amplification of αSyn aggregates is rapid at high temperatures
20 μM αSyn K23Q (PBS, pH 7.4) was incubated with 10 μM ThT, at different temperatures (50–70 °C) without shaking, in the presence or absence of 100 pM seed fibrils. Fluorescence time traces were acquired on AttoBright in SMC at 3 h and 5 h amplification and aggregation, measured by the Brightness (B)[ 19c , 23 ] of the fluorescence time traces, was assessed (Figure S3). A rapid amplification of αSyn efficiently occurred at all temperature tested, with B increasing at both 3 h and 5 h compared to the starting seeds. To avoid the spontaneous conversion of K23Q monomers into ThT aggregates at higher temperatures and to obtain the optimal amplification, we decided to focus on an amplification temperature of 55 °C in subsequent experiments. The kinetics of this amplification is shown in Figure S4; importantly, in the absence of seeds, K23Q remained mainly monomeric for the duration of the experiment.
Finally, we compared the efficacy of this new protocol (55 °C without shaking) to the well‐established amplification protocol (37 °C with orbital shaking). Using the B parameter, both conditions led to similar amplification of the seeds with 300–500 folds increase in brightness over 5 h (Figure S5). Overall, this new protocol is easy to implement and offers, in our hands, robust results with similar efficacy compared to the standard protocol (37 °C with orbital shaking).
SMC detects down to 1 fM αSyn fibrils after amplification
To establish the detection limit of the assay, experiments were repeated with decreasing amount of seeds. As before, 20 μM αSyn K23Q and 10 μM ThT were incubated at 55 °C in a PCR machine without shaking, in the presence of different concentrations of seed fibrils (100 nM to 100 aM). Aggregation, measured by B, was assessed at different time points. Figure 2 A shows that the amplification results in an increase of the signal by up to 1 order of magnitude (at 1 nM and 10 pM seed concentration). Figure 2 B shows that 5 h amplification decreased the limit of detection by almost 2 orders of magnitude, from 1 pM at time 0 to 10 fM, after 5 h. At low concentration (<10 fM), as the number of fibrils present is very limited, the average brightness parameter B is no longer the most sensitive parameter. Rather, counting the number of individual events detected on the fluorescence time traces allows to differentiate between control and the presence of fibrils, after amplification (Figure 2 C). Therefore, SMC enabled the quantification of αSyn fibrils down to 1 fM after 5 h amplification.
Figure 2.

Detection limit upon seeding conditions. A) Kinetics of amplification at different concentrations of αSyn fibrils analysed using the Brightness parameter (B parameter). Each sample was incubated with 20 μM αSyn K23Q monomer in the presence of ThT (10 μM) at 55 °C without shaking and analysed on AttoBright. Seeds concentrations varied between 100 nM and 100 fM as indicated. Error bars are mean ± s.d of 3 × 300 s measurements. B) Increase of sensitivity upon amplification, using the B parameter. B was measured as a function of fibrils concentration, before (0 h, red squares) and after 5 h amplification (black triangles). Different concentrations of αSyn seeds were amplified and the aggregates were detected by ThT fluorescence. Data are averaged over three independent dilutions on separate days, each sample was measured 3×300 s. C) Detection limit using the number of events per minute as a parameter. Box plot representing the results for 4 separate experiments (3 technical replicates each) for unseeded (circles), and seeded experiments using 10 fM (squares), 1 fM (upright triangles) and 100 aM seeds (downward triangles).
We re‐evaluated the effect of amplification conditions at the detection limit (Figure 3). Amplification was carried out at 37 °C without or with orbital shaking at 500 rpm, or at 55 °C without shaking. Fluorescence time traces were obtained before and after 5 h amplification in all conditions (Figure 3 A). Data were analysed to identify individual fluorescent events, for which the maximal intensity, duration of the event and total intensity (area under the curve) were measured. Figure 3 B compares the number of ThT‐positive events detected per minute on fluorescence time traces and shows that all three protocols significantly increased the number of events detected. When comparing the total ThT fluorescence in the events (Figure 3 C), all protocols again led to a significant increase in aggregation compared to the starting seeds. The increase in temperature (from 37 °C to 55 °C) in the absence of shaking leads to a small but significant increase in total fluorescence. In all cases, the unseeded controls remained monomeric (data not shown).
Figure 3.
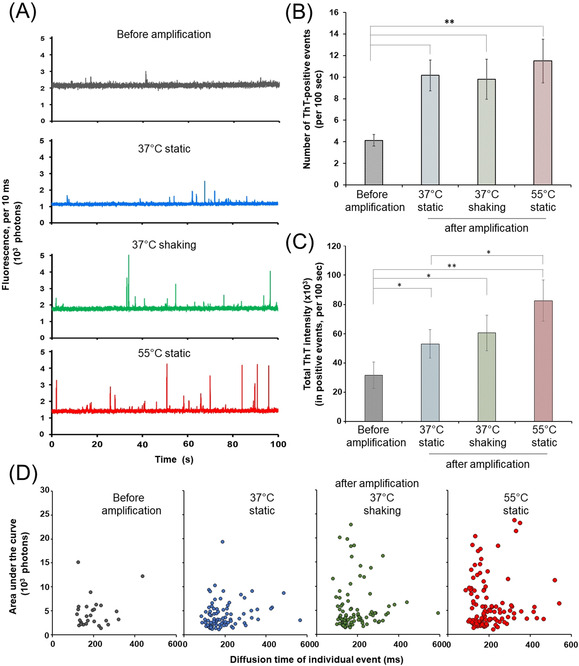
Comparison between amplification protocols. A) Typical fluorescence time traces obtained before (grey) and after amplification at 37 °C in the absence (blue) or with orbital shaking (500 rpm, green), or at 55 °C without shaking (red). 2 pM seeds were incubated with 20 μM monomeric αsyn K23Q and 10 μM ThT and amplification was carried out as indicated. 100 sec fluorescence time traces were obtained before and after 5 h amplification. B) Average number of ThT‐positive events per traces as a function of reaction conditions, as in (A). Fluorescence time traces obtained as in (A) were analysed to detect individual ThT‐positive events. All amplification protocols lead to an increase in the number of events detected. C) Total ThT fluorescence as a function of reaction conditions, as in (A). Fluorescence time traces obtained as in (A) were analysed to detect individual ThT‐positive events. Total ThT fluorescence for the trace was calculated as the sum of the area under the curve for all individual events. All amplification protocols lead to an increase in the total ThT fluorescence. D) Fingerprinting of the different reaction conditions. For each reaction conditions as in (A), the intensity (calculated as the area under the curve, AUC) was plotted as the function of diffusion time for each individual event. Note the increased presence of high but sharp events (AUC>103 photons, diffusion time <200 ms) when amplification occurred at either 37 °C with orbital shaking or 55 °C without shaking. All experiments were carried out as a biological triplicate with 2 successive measurements for each sample. (Average ± SE) are plotted where relevant. Student's t‐tests were performed to analyse statistical significance. In all cases, ** indicates p<0.01 and *, p<0.1.
We then tried and compared the “fingerprints” of the different protocols by analysing the properties of the individual fluorescent events. To this end, the maximal intensity was plotted as a function of the diffusion time, for each individual event (Figure 3 D). Qualitatively, this reveals that amplification at 37 °C without shaking leads to the increased presence of slow diffusing peaks (high diffusion time with a low maximal intensity). In contrast, amplification at 37 °C with shaking and, especially, at 55 °C without shaking, yields a population of high fluorescent peaks, with a high maximal intensity but fast diffusion time. How these differences of behaviour relate to the molecular mechanisms of amplification remains to be evaluated. Nevertheless, this proves that SMC can detect and discriminate between “species” at very low fibrils concentration.
SMC discriminates between PD patients and healthy samples in biological fluids
We then evaluated our method on relevant patients’ samples. Cerebrospinal fluid (CSF) from 8 PD patients and 8 healthy, age‐matched controls from the LRRK2 cohort consortium were obtained from the Michael J. Fox Foundation biorepository (Table S1). The use of human CSF samples was approved by the University of Sydney Human Research Ethics Committee (reference number 2017/076).
The presence of ThT‐positive objects in these samples was evaluated before and after amplification. A 2 μL of CSF were diluted 10 times in 10 μM ThT, in the presence of 20 μM αSyn K23Q monomer and multiple 100 sec fluorescence time traces were recorded on AttoBright (direct detection). The mixture was then transferred to the PCR machine for a 5 h amplification at 55 °C without shaking, after which fluorescence time traces were obtained. As illustrated in Figure 4 A, direct detection revealed the presence of rare ThT‐positive events, mainly in PD patients’ samples. The 5 h amplification resulted in an increase of both the intensity and number of events detected. Other examples of raw traces and analysis are shown in Supplementary Figures S6 and S7.
Figure 4.

Direct detection and amplification of biological samples. A) Typical fluorescence time traces obtained for a patient's sample (S4) before (left) and after (right) amplification. 2 μL of CSF were diluted 10 times in 20 μM αSyn K23Q monomer and 10 μM ThT. Amplification was carried out at 55 °C, without shaking, for 5 hours. B) Comparison between PD patients (dark grey) and healthy controls (dotted) samples, before (left) and after (right) amplification. Fluorescence time traces were acquired as in (A) and analysed for the presence of ThT‐positive events. The percentage of positive reads was calculated as the number of traces presenting at least 1 ThT‐positive event over the total number of traces. C) Comparison of the number of ThT‐positive events detected between PD patients (dark grey) and healthy controls (dotted) samples, before (left) and after (right) amplification. Fluorescence time traces were acquired as in (A) and analysed for the presence of ThT‐positive events. The number of events was calculated for each time trace. The graph shows (average ± SE) number of ThT‐positive events per minute. Each sample was analysed at least 4 times (4 biological repeats, individual amplifications on separate days). The unpaired t‐test with Welch's correction (which does not assume that data have the same standard deviation) indicates a significant difference between the group of PD patients and the group of controls, with P value <0.0001.
Because the concentration of amyloid fibrils is low in these samples, we first assessed the probability of detecting a ThT‐positive event, when measuring a 100 sec trace. A read was considered positive when at least 1 ThT‐positive event is detected and this is divided by the total number of traces obtained to yield the proportion of positive reads for each patient. ThT‐reactive species were identified by direct detection in 6/8 PD patients’ samples compared to 1/8 controls (Figure 4 B right). The probability to observing a ThT‐positive event in PD patients’ samples was at or above 30 %, while 1 control showed 25 % probability of detection. Upon amplification (Figure 4 B right), ThT‐positive events were detected at least once in all samples, including controls. However, the probability of detecting an event after amplification was higher for all PD patients compared to healthy control samples (75 % vs. 23 % in average).
We then compared the average number of events recorded per minute (Figure 4 C). In direct detection (Figure 4 C left), the number of events varies between samples (0.6±0.6 event min−1, 95 % C.I), including amongst PD patients’ samples. In contrast, amplification (Figure 4 C right), generated more homogeneous data within each category (PD patients or controls). More importantly, there are significantly more events detected in the case of the PD patients compared to the control samples (1.4±0.3 vs. 0.2±0.1 events per min, 95 % C.I, see also Figure S8). The combination of both parameters (probability of detection and number of events) revealed clear differences between PD patients and healthy control samples. As we show in Figure 4 C we noted large difference between PD patients. If the number of ThT positive species is consistently high between PD patients after 5 h of amplification, the number of aggregates detected before amplification is very different. One interesting possibility is that the increase of number of events corresponds to the conversion of small oligomeric species into larger ThT positive aggregates. In the future, the amplification differential (i.e. ratio of direct and amplified events) could be examined as one parameter to discriminate between PD patients.
Finally, we analysed the fingerprint of these samples by taking advantage of SMC ability to detect and analyse individual events. First, the individual events (after amplification) were analysed based on either their maximal intensity of the peak, the diffusion time of the event or the total fluorescence intensity (or area under the curve) (Figure 5 A). The ThT‐positive events detected in the PD patients’ samples were proportionally brighter (higher proportion of events with max. intensity >300 photons) and fast‐diffusing (higher proportion of events with diffusion time <250 ms) compared to control. However, the total fluorescence distribution (< or >2000 photons) were similar for both categories.
Figure 5.

Characterisation of ThT‐positive events from biological samples. A) Physical characterisation of ThT‐positive events in biological fluids, detected after amplification. The fluorescence time traces collected as in Figure 5 were analysed to detect individual ThT‐positive events. These events were analysed based on maximal intensity (left), diffusion time (centre) or total intensity (area under the curve, right), comparing healthy controls (grey) and PD patients (red) samples. The percentages of events presenting left: a maximal intensity <300 photons (light dotted pattern) or >300 photons (heavy dotted pattern), ‐centre) diffusion time <250 ms (light color) or >250 ms (darker color), and right: AUC<2000 photons (light upward stripes) or >2000 photons (dark downward stripes) were calculated and plotted. B) Maximal intensity as a function of diffusion time is represented for each individual ThT‐positive event, detected following amplification of PD patients (red circles) and healthy controls (grey triangles) samples. 4 types of events can be identified: small (S), high (H), long (L) and neutral (N) events, as depicted. Limits are set at 250 ms and 300 photons, on the x‐ and y‐axis, respectively. C) Comparison of the number of ThT‐positive events belonging to the categories described in (B), between healthy controls (grey) and PD patients (red) samples. Each category (S, H, L and N) is represented by a different shade, as indicated.
We then examined the properties of each individual event and, as in Figure 3 D, by plotting the maximal intensity of each peak as a function of diffusion (Figure 5 B). The PD patients’ samples are presented in red while the controls are in grey. Data points, from both categories, do not randomly scatter on the plot; rather, three behaviours can be identified. As before (Figure 4 D), small events (maximal intensity <300 photons and diffusion time <250 ms) can be seen (S). Two types of larger events exist, either “high” peaks (H) with fast diffusion time (<250 ms) and high maximal intensity (>300 photons) or “long” peaks (L) that diffuse more slowly (>250 ms) but have low intensity (<300 photons max.). Interestingly, we note that very few events are both intense and slow diffusing (N). When quantifying the number of events in each category (Figure 5 C), we noted a striking lack of H events in the control samples compared to PD patients’ samples (4 % vs. 32 %). In reverse, more events were classed in the L category in control samples compared to PD patients’ samples (52 % vs. 22 %). We expect those trends to be confirmed as more data are collected, and these fingerprints could help set‐up more stringent parameters for diagnostics. It is possible that the most relevant species in terms of diagnostics and marker of disease progression may be the smaller aggregates with high ThT reactivity (“H”). This suggests that centrifugation of the CSF samples to remove the large, slow diffusing species could be useful to enhance the differences between PD and non‐PD patients, or even between PD patients.
Discussion
The last couple of years have witnessed a renewed interest for the detection of αSyn aggregation as a potential biomarker for Parkinson's disease and other synucleinopathies. [24] PMCA and RT‐quIC assays were initially developed for the detection of the misfolded prion protein (PrPSc) and are now used for the diagnostic of transmissible spongiform encephalopathies in animal and humans. Both assays can be used to detect sporadic and variant Creutzfeldt‐Jakob disease from a variety of biological samples. Recently, these assays have been adapted to detect αSyn aggregates by taking advantage of the intrinsic property of amyloid fibrils to self‐template. Several groups have reported on the detection of αSyn aggregates in brain homogenates and cerebrospinal fluid (CSF) of Parkinson's patients, using either RT‐quIC or PMCA. [15] Recently, Fenyi et al. [25] used gastrointestinal biopsies as sample sources for PMCA amplification of αSyn seeds. Becker et al. [26] could show seeding from formaldehyde‐fixed tissues from MSA patients. Multiple groups are working to optimize the assay conditions to lower the detection limit and access a larger panel of biofluids as sources. [27] Recent developments of the RT‐QuIC assay for αSyn include the use of a mutant form of αSyn (K23Q) as the monomer reservoir, [22] as used here for the development of new derivatives of ThT with a better signal‐to‐background ratio [28] or distinctive properties depending on structural features. [29] Very recently, the FDA has granted a “breakthrough device” designation for the use of PMCA to help in the diagnosis of Parkinson's disease using CSF and plasma samples.
Single Molecule Counting (SMC) has revolutionized many fields from sequencing to imaging, as detection of a single event represents the ultimate sensitivity. Here we show that single molecule detection of αSyn aggregates is possible using ThT, the already widely used dye for biophysical assays and histology staining. ThT has recently been used as a fluorescent dye for single‐molecule super‐resolution imaging. [30] Horrocks et al. [31] used total internal reflection fluorescence (TIRF) microscopy to visualize αSyn oligomers in cerebrospinal fluid (CSF) samples. Using single molecule detection in combination with an amplification assay significantly lowers the detection threshold and shortens the reaction time, compared to bulk methods. Furthermore, the development of a new SMC instrument (AttoBright [17] ) that performs similarly to commercially available confocal setups but in a simplified, compact, auto‐aligned design, allows for a generalized use of this method. Indeed, this apparatus significantly reduces overhead costs (i.e. it does not a dark room, air tables and training specialised personnel) associated with maintaining state‐of‐the‐art single molecule instruments and can be assembled at a fraction of the price.
Our method allows a significant reduction of the time required to conduct the experiments. Indeed, the amplification time here is reduced to 5 h, while the measurement time is very short (10 min). The corresponding amplification phase for PMCA or RT‐QuIC is typically >50 h in buffer conditions. To detect α‐Syn seeds in patients CSF, Kang et al. performed RT‐QuIC assay for 120 h or PMCA for 400 h. [15] Shortening of the reaction time limits the effect of α‐Syn monomer auto‐aggregation and should allow for a decrease in false positive results. It also decreases the time necessary for protocol testing and optimisation. Direct detection of recombinant αSyn fibrils can be as low as 1 pM, corresponding to 75 fg of fibrils in the sample. The same experiment run on a standard plate reader gives a detection limit 106 times higher (≈μg of fibrils). [17] Using a simple one‐step amplification protocol, without shaking or sonication steps and without addition of beads, the detection limit is approximately 1 fM, corresponding to less than 100 attogram of seeds. The Soto group that developed PMCA reported a detection limit of 20 fg (LOD) for their assay [13] while Manne et al. [32] calibrated the RT‐QuIC assay in buffer and found a detection limit below 0.5 ng.
Further modifications of this protocols are likely to improve the current sensitivity. For diagnostic purposes, it would be more efficient to run a single amplification of 5 h, and a single long read of 10 min. As the number of events detected will scale (approximately linearly) with the duration of the experiment, we can expect to gain a factor 6 in sensitivity (with acquisition of 600 s vs. 100 s currently, see Supplementary Figure 9). To limit the amount of sample used and multiply the number of experiments, we worked with 10 % CSF in the monomeric solution. The Soto group routinely conducts experiments with 40 % CSF in αSyn monomer [29] . Using larger CSF volumes would be beneficial and should not be an issue as the amounts of amplified seeds is very low in control patients, and as the average ThT baseline is also very low for CSF. In Supplementary Figure 10, we discuss the idea of counting the number of events as a function of acquisition time and CSF concentration to improve the assay. We also noted that the protocol from the Soto group utilizes monomeric αSyn at a higher concentration of >60 μM (we use 30 μM). Working at higher concentrations of Syn monomers would probably enhance conversion or elongation of seeds.
Conclusion
Overall, our single molecule counting assay should be able to discriminate between PD and controls patients at least as well as PMCA and RT‐QuiC as we use the same principle of amplification by monomeric αSyn and the same reagents. If a sample is PMCA/RT‐QuiC positive then it is certain that SMC will detect a large number of amplified aggregates at early time points, before the ThT average baseline increases. PMCA is incredibly sensitive as the number of initial aggregates are multiplied over many cycles of breaking and elongation. One of the main issues is that when the sample becomes ThT‐positive, the number of aggregates is multiplied by orders of magnitude and cannot be used to estimate the number (or size) of the seeds that are initially present in the sample. Besides the increased sensitivity and shorter measurement times, SMC offers the possibility to investigate each event individually. This ability to detect and characterize individual events may prove to be invaluable to follow disease progression or discriminate between pathologies.[ 29 , 33 ] By coupling SMC to existing PMCA protocols in the first round(s) of amplification, we believe that decoupling the size, number and reactivity of seeds present initially would add a new dimension to PD diagnostics.
Conflict of interest
The authors declare no conflict of interest.
Supporting information
As a service to our authors and readers, this journal provides supporting information supplied by the authors. Such materials are peer reviewed and may be re‐organized for online delivery, but are not copy‐edited or typeset. Technical support issues arising from supporting information (other than missing files) should be addressed to the authors.
Supplementary
Acknowledgements
The authors would like to thank James Brown for useful discussion and Figure 1, and Prof. Cooper (Garvan Institute) for discussions. This work was supported by a grant from the Michael J. Fox Foundation for Parkinson's disease research (to Y.G. and E.S.), by the Australian Research Council (DP180101275 to E.S.) and the National Health and Medical Research Council (APP1120374 to E.S.). CSF samples used in this article were obtained from the MJFF LRRK2 Cohort Consortium (LCC), which is coordinated and funded by the Michael J Fox Foundation for Parkinson's disease research. For up to date information on the LCC study, visit https://www.michaeljfox.org. The investigators within the LCC contributed to the design and implementation of the LCC and/or provided data and collected biospecimens, but did not participate in the analysis or writing of this report. The list of investigators is available in the supplementary information.
A. Bhumkar, C. Magnan, D. Lau, E. S. W. Jun, N. Dzamko, Y. Gambin, E. Sierecki, Angew. Chem. Int. Ed. 2021, 60, 11874.
Contributor Information
Dr. Yann Gambin, Email: y.gambin@unsw.edu.au.
Dr. Emma Sierecki, Email: e.sierecki@unsw.edu.au.
References
- 1. Alafuzoff I., Hartikainen P. in Handbook of Clinical Neurology, Vol. 145 (Eds.: Kovacs G. G., Alafuzoff I.), Elsevier, Amsterdam, 2018, pp. 339–353. [DOI] [PubMed] [Google Scholar]
- 2. Goedert M., Jakes R., Spillantini M. G., J. Parkinson′s Dis. 2017, 7, S51–S69. [DOI] [PMC free article] [PubMed] [Google Scholar]
- 3.
- 3a. Spillantini M. G., Schmidt M. L., Lee V. M., Trojanowski J. Q., Jakes R., Goedert M., Nature 1997, 388, 839–840; [DOI] [PubMed] [Google Scholar]
- 3b. Lesage S., Houot M., Mangone G., Tesson C., Bertrand H., Forlani S., Anheim M., Brefel-Courbon C., Broussolle E., Thobois S., Damier P., Durif F., Roze E., Tison F., Grabli D., Ory-Magne F., Degos B., Viallet F., Cormier-Dequaire F., Ouvrard-Hernandez A. M., Vidailhet M., Lohmann E., Singleton A., Corvol J. C., Brice A., Front. Neurol. 2020, 11, 682. [DOI] [PMC free article] [PubMed] [Google Scholar]
- 4. Polymeropoulos M. H., Lavedan C., Leroy E., Ide S. E., Dehejia A., Dutra A., Pike B., Root H., Rubenstein J., Boyer R., Stenroos E. S., Chandrasekharappa S., Athanassiadou A., Papapetropoulos T., Johnson W. G., Lazzarini A. M., Duvoisin R. C., Di Iorio G., Golbe L. I., Nussbaum R. L., Science 1997, 276, 2045–2047. [DOI] [PubMed] [Google Scholar]
- 5. Chartier-Harlin M. C., Kachergus J., Roumier C., Mouroux V., Douay X., Lincoln S., Levecque C., Larvor L., Andrieux J., Hulihan M., Waucquier N., Defebvre L., Amouyel P., Farrer M., Destée A., Lancet 2004, 364, 1167–1169. [DOI] [PubMed] [Google Scholar]
- 6.
- 6a. Taschenberger G., Garrido M., Tereshchenko Y., Bähr M., Zweckstetter M., Kügler S., Acta Neuropathol. 2012, 123, 671–683; [DOI] [PMC free article] [PubMed] [Google Scholar]
- 6b. Wakabayashi K., Neuropathology 2020, 40, 415–425; [DOI] [PubMed] [Google Scholar]
- 6c. Kayed R., Dettmer U., Lesné S. E., J. Parkinson′s Dis. 2020, 10, 791–818. [DOI] [PMC free article] [PubMed] [Google Scholar]
- 7. Atik A., Stewart T., Zhang J., Brain Pathol. 2016, 26, 410–418. [DOI] [PMC free article] [PubMed] [Google Scholar]
- 8. Dickson D. W., Braak H., Duda J. E., Duyckaerts C., Gasser T., Halliday G. M., Hardy J., Leverenz J. B., Del Tredici K., Wszolek Z. K., Litvan I., Lancet Neurol. 2009, 8, 1150–1157. [DOI] [PubMed] [Google Scholar]
- 9.
- 9a. Fink A. L., Acc. Chem. Res. 2006, 39, 628–634; [DOI] [PubMed] [Google Scholar]
- 9b. Alam P., Bousset L., Melki R., Otzen D. E., J. Neurochem. 2019, 150, 522–534. [DOI] [PubMed] [Google Scholar]
- 10. Biancalana M., Koide S., Biochim. Biophys. Acta Proteins Proteomics 2010, 1804, 1405–1412. [DOI] [PMC free article] [PubMed] [Google Scholar]
- 11.J. Ma, J. Gao, J. Wang, A. Xie, Front Neurosci. 2019, DOI: 10.3389/fnins.2019.00552. [DOI] [PMC free article] [PubMed]
- 12. Paciotti S., Bellomo G., Gatticchi L., Parnetti L., Front. Neurol. 2018, 9, 415–415. [DOI] [PMC free article] [PubMed] [Google Scholar]
- 13. Shahnawaz M., Tokuda T., Waragai M., Mendez N., Ishii R., Trenkwalder C., Mollenhauer B., Soto C., JAMA Neurol. 2017, 74, 163–172. [DOI] [PubMed] [Google Scholar]
- 14. Fairfoul G., McGuire L. I., Pal S., Ironside J. W., Neumann J., Christie S., Joachim C., Esiri M., Evetts S. G., Rolinski M., Baig F., Ruffmann C., Wade-Martins R., Hu M. T. M., Parkkinen L., Green A. J. E., Ann. Clin. Transl. Neurol. 2016, 3, 812–818. [DOI] [PMC free article] [PubMed] [Google Scholar]
- 15. Kang U. J., Boehme A. K., Fairfoul G., Shahnawaz M., Ma T. C., Hutten S. J., Green A., Soto C., Mov. Disord. 2019, 34, 536–544. [DOI] [PMC free article] [PubMed] [Google Scholar]
- 16. Singh S., DeMarco M. L., J. Appl. Lab. Med. 2020, 5, 142–157. [DOI] [PubMed] [Google Scholar]
- 17. Brown J. W. P., Bauer A., Polinkovsky M. E., Bhumkar A., Hunter D. J. B., Gaus K., Sierecki E., Gambin Y., Nat. Commun. 2019, 10, 5662. [DOI] [PMC free article] [PubMed] [Google Scholar]
- 18. Weiss S., Science 1999, 283, 1676–1683. [DOI] [PubMed] [Google Scholar]
- 19.
- 19a. Jung W., Sierecki E., Bastiani M., O'Carroll A., Alexandrov K., Rae J., Johnston W., Hunter D. J. B., Ferguson C., Gambin Y., Ariotti N., Parton R. G., J. Cell Biol. 2018, 217, 2141–2165; [DOI] [PMC free article] [PubMed] [Google Scholar]
- 19b. O'Carroll A., Chauvin B., Brown J. W. P., Meagher A., Coyle J., Schill J., Bhumkhar A., Hunter D. J. B., Ve T., Kobe B., Sierecki E., Gambin Y., BMC Biol. 2018, 16, 149; [DOI] [PMC free article] [PubMed] [Google Scholar]
- 19c. Sierecki E., Giles N., Bowden Q., Polinkovsky M. E., Steinbeck J., Arrioti N., Rahman D., Bhumkar A., Nicovich P. R., Ross I., Parton R. G., Böcking T., Gambin Y., Sci. Rep. 2016, 6, 37630. [DOI] [PMC free article] [PubMed] [Google Scholar]
- 20. Brown J., Horrocks M. H., Semin. Cell Dev. Biol. 2020, 99, 65–77. [DOI] [PubMed] [Google Scholar]
- 21.V. N. Uversky, J. Li, A. L. Fink, JBC 2001, 276, 10737–10744. [DOI] [PubMed]
- 22. Groveman B. R., Orrù C. D., Hughson A. G., Raymond L. D., Zanusso G., Ghetti B., Campbell K. J., Safar J., Galasko D., Caughey B., Acta Neuropathol. Commun. 2018, 6, 7. [DOI] [PMC free article] [PubMed] [Google Scholar]
- 23.
- 23a. Gambin Y., Giles N., O'Carroll A., Polinkovsky M., Hunter D., Sierecki E., J. Mol. Biol. 2018, 430, 491–508; [DOI] [PubMed] [Google Scholar]
- 23b. Gambin Y., Polinkovsky M., Francois B., Giles N., Bhumkar A., Sierecki E., Int. J. Mol. Sci. 2016, 17, 655. [DOI] [PMC free article] [PubMed] [Google Scholar]
- 24. Candelise N., Baiardi S., Franceschini A., Rossi M., Parchi P., Acta Neuropathol. Commun. 2020, 8, 117. [DOI] [PMC free article] [PubMed] [Google Scholar]
- 25. Fenyi A., Leclair-Visonneau L., Clairembault T., Coron E., Neunlist M., Melki R., Derkinderen P., Bousset L., Neurobiol. Dis. 2019, 129, 38–43. [DOI] [PubMed] [Google Scholar]
- 26. Becker K., Wang X., Vander Stel K., Chu Y., Kordower J., Ma J., Mol. Neurobiol. 2018, 55, 8728–8737. [DOI] [PMC free article] [PubMed] [Google Scholar]
- 27. M. A. Metrick II , do Carmo Ferreira N., Saijo E., Hughson A. G., Kraus A., Orrú C., Miller M. W., Zanusso G., Ghetti B., Vendruscolo M., Caughey B., Proc. Natl. Acad. Sci. USA 2019, 116, 23029–23039. [DOI] [PMC free article] [PubMed] [Google Scholar]
- 28.
- 28a.N. Pravin, R. Kumar, S. Tripathi, P. Kumar, G. M. Mohite, A. Navalkar, R. Panigrahi, N. Singh, L. G. Gadhe, S. Manchanda, M. Shimozawa, P. Nilsson, J. Johansson, A. Kumar, S. K. Maji, M. Shanmugam, J. Neurochem. 2020, DOI: 10.1111/jnc.15138; [DOI]
- 28b. Kumar M., Hong Y., Thorn D. C., Ecroyd H., Carver J. A., Anal. Chem. 2017, 89, 9322–9329; [DOI] [PubMed] [Google Scholar]
- 28c. Taylor C. G., Meisl G., Horrocks M. H., Zetterberg H., Knowles T. P. J., Klenerman D., Anal. Chem. 2018, 90, 10385–10393. [DOI] [PMC free article] [PubMed] [Google Scholar]
- 29. Shahnawaz M., Mukherjee A., Pritzkow S., Mendez N., Rabadia P., Liu X., Hu B., Schmeichel A., Singer W., Wu G., Tsai A. L., Shirani H., Nilsson K. P. R., Low P. A., Soto C., Nature 2020, 578, 273–277. [DOI] [PMC free article] [PubMed] [Google Scholar]
- 30. Tiiman A., Jelić V., Jarvet J., Järemo P., Bogdanović N., Rigler R., Terenius L., Gräslund A., Vukojević V., J. Alzheimer′s Dis. 2019, 68, 571–582. [DOI] [PMC free article] [PubMed] [Google Scholar]
- 31. Horrocks M. H., Lee S. F., Gandhi S., Magdalinou N. K., Chen S. W., Devine M. J., Tosatto L., Kjaergaard M., Beckwith J. S., Zetterberg H., Iljina M., Cremades N., Dobson C. M., Wood N. W., Klenerman D., ACS Chem. Neurosci. 2016, 7, 399–406. [DOI] [PMC free article] [PubMed] [Google Scholar]
- 32. Manne S., Kondru N., Hepker M., Jin H., Anantharam V., Lewis M., Huang X., Kanthasamy A., Kanthasamy A. G., J. Neuroimmune Pharm. 2019, 14, 423–435. [DOI] [PMC free article] [PubMed] [Google Scholar]
- 33. Ruf V. C., Nübling G. S., Willikens S., Shi S., Schmidt F., Levin J., Bötzel K., Kamp F., Giese A., ACS Chem. Neurosci. 2019, 10, 1649–1659. [DOI] [PubMed] [Google Scholar]
Associated Data
This section collects any data citations, data availability statements, or supplementary materials included in this article.
Supplementary Materials
As a service to our authors and readers, this journal provides supporting information supplied by the authors. Such materials are peer reviewed and may be re‐organized for online delivery, but are not copy‐edited or typeset. Technical support issues arising from supporting information (other than missing files) should be addressed to the authors.
Supplementary