

Abstract
Background
In children with juvenile idiopathic arthritis (JIA), the temporomandibular joint (TMJ) can be involved, resulting in dysfunction of the masticatory system. Bite force is one of the variables that reflects the function of the masticatory system. The aim of this study was to compare maximum bite force in children with JIA, with and without TMJ involvement and with healthy children.
Methods
Children with JIA and healthy children between the ages 6 and 18 were included in this cross‐sectional study. The clinical examination consisted of measuring the anterior maximum voluntary bite force (AMVBF), assessment of the TMJ screening protocol items and TMJ, masseter and temporal muscle palpation pain. Unadjusted linear regression analyses were performed to evaluate the explanatory factors for AMVBF. Two adjusted models were constructed with corrections for age and gender differences: model 1 to compare children with JIA and healthy children and model 2 to compare children with JIA with and without TMJ involvement.
Results
In this cross‐sectional study, 298 children with JIA and 169 healthy children participated. AMVBF was 24 Newton (N) lower in children with JIA, when compared with healthy children (95%CI: −35.5–−12.4, p = .000). When children with JIA also had clinically established TMJ involvement, AMVBF was reduced 42 N (component JIA:−16.78, 95% CI −28.96–−4.59, p = .007 and component TMJ involvement:−25.36, 95% CI −40.08–−10.63, p = .001). Age and male gender increased AMVBF.
Conclusion
Children with JIA had a reduction in the AMVBF compared with healthy children. In children with JIA and clinically established TMJ involvement, AMVBF was more reduced.
Keywords: arthritis, bite force, child, cross‐sectional studies, juvenile, linear models, temporomandibular joint
This study found a considerable bite force reduction and less functioning of the TMJ in children with JIA compared to healthy children, and even more reduction of these issues in children with JIA and TMJ involvement compared to JIA without TMJ involvement. For all children, the demographic variables age, length and male gender increased the maximum bite force.

1. BACKGROUND
In children with juvenile idiopathic arthritis (JIA), oral function can be impacted as a result of joint and/or muscle involvement of the masticatory system. The sequels of JIA are reported in terms of temporomandibular pain, restricted mandibular range of motion, radiographic and magnetic resonance imaging (MRI) findings, indicating inflammation of the temporomandibular joint (TMJ) structures. 1 , 2 According to the International League of Associations for Rheumatology (ILAR) classification, JIA is diagnosed when arthritis is characterised by inflammation of one or more joints and is present for at least 6 weeks with an onset before the age of 16. 3 Arthritis of the TMJ is characterised by synovial swelling, bone marrow oedema and synovial hypertrophy and may lead to destruction of the bony structures and disc abnormalities. 4 However, inflammatory signs and symptoms of TMJ arthritis are often not detected in the clinical examination; for this reason, the TMJ is sometimes quoted as the “forgotten” or “silent joint.” 5 , 6 If not adequately treated, impaired global health and growth disturbances needing surgical intervention at later age may result. 7 , 8 , 9 , 10 , 11 Clinical symptoms of TMJ arthritis are pain while chewing, muscle palpation pain and limited maximum mouth opening. 11 , 12 , 13 Muscle palpation pain has been mentioned as a prevalent symptom of TMJ arthritis. 1 There is a need for objective assessments to characterise mandibular function in children with JIA. Next to measuring mouth opening capacity, maximum bite force measurement might be such an assessment. In non‐specific conditions of the TMJ such as temporomandibular disorders (TMD), a reduced maximum bite force was found. 14 In healthy individuals, the maximum bite force explains over 60% of the variance in masticatory performance and is therefore an important variable to measure the functional state of the masticatory system. 15 , 16 In children with JIA, a 30% bite force reduction was found compared with healthy children. 17 This study, however, was performed in 1995, in the era before the introduction of biologicals. Biologicals have led to an important improvement in treatment of children with JIA. 18 In addition, in this study only patients with JIA with TMJ signs and symptoms were included. To our knowledge, there is no recent literature on maximum bite force in children with JIA, with and without TMJ involvement. It would be interesting to explore whether the bite force is reduced in children with JIA with and without TMJ involvement. Hence, the first aim of this study was to compare maximum bite force, temporomandibular function and pain on palpation of the TMJ and masticatory muscles in both children with JIA and in healthy children. The second aim was to compare these parameters in children with JIA with and without clinically established TMJ involvement.
2. METHODS
This cross‐sectional study was performed in children with JIA between January 2018 and February 2020 at the outpatient clinic of the Department of Pediatric Immunology and Rheumatology in collaboration with the Department of Oral and Maxillofacial Surgery and Special Dental Care of the University Medical Center (UMC) Utrecht, The Netherlands. The inclusion criteria for participation were children with JIA as classified using the ILAR criteria and an age between 6 and 18 years. Exclusion criteria were as follows: (1) a history of mandibular trauma; (2) previous TMJ treatment, such as physical therapy, occlusal splints, intra‐articular injections, or maxillofacial surgery; (3) incisal dental restoration or non‐erupted incisors; and (4) an additional orofacial condition not related to JIA (e.g., dental pain or a pre‐existing jaw or temporomandibular disorder). The measurements took place immediately after the regular consultation with the paediatric rheumatologist.
Healthy children were recruited from primary schools in Utrecht and a high school in Tilburg (the Netherlands) between February 2018 and April 2019. The in‐ and exclusion criteria for children with JIA were likewise applied for healthy children. In addition, healthy children with a TMJ screening protocol ≥2 were excluded (n = 12). 12 All measurements were conducted at the participating schools. The study protocol, with study ID: NL.METC‐17‐528/C, was approved by the Ethics Committees of the UMC Utrecht. All participants and their parents and/or guardians received written information and provided their oral and signed informed consent.
The following data were extracted from the electronic medical records for the included children with JIA: JIA subtype (see also Table 1), date of JIA diagnosis, medication, height, weight, gender, age, the presence of antinuclear antibody (ANA) or rheumatoid factor (RF) and the clinical Juvenile Arthritis Disease Activity Score (cJADAS). 19 Data collection was performed using the good clinical practice (GCP) compliant electronic data capture (EDC) system Research Online owned by the Julius Center (UMC Utrecht).
TABLE 1.
Demographics and clinical characteristics of children with JIA, with and without TMJ involvement and healthy children
| JIA, n = 298 | Healthy children, n = 169 | p‐value | JIA with TMJ involvement, n = 92 | JIA without TMJ involvement, n = 206 | p‐value | |
|---|---|---|---|---|---|---|
| Gender (n, %) | .000 a | .479 a | ||||
| Male | 96 (32.2) | 88 (52.1) | 27 (29.3) | 69 (33.5) | ||
| Female | 202 (67.8) | 81 (47.9) | 65 (70.7) | 137 (66.5) | ||
| Mean age (years; mean, SD | 12.7 (3.5) | 11.5 (3.5) | .000 b | 15.0 (4.0) | 13.0 (6.0) | .000 b |
| Mean weight (kg; mean, SD) | 50.7 (17.7) | 46.9 (17.3) | .026 b | 56.5 (24.5) | 48.4 (28.2) | .001 b |
| Mean length (cm; mean, SD) | 157.1 (18.3) | 153.0 (20.9) | .032 b | 165.0 (22) | 160.5 (27.0) | .001 b |
| Orthodontic treatment (n, %) | 48 (16.1) | 17 (10.1) | .070 a | 16 (17.4) | 32 (15.5) | .687 a |
| Medication use (n, %) | 225 (75.5) | 14 (8.3) | .000 a | 76 (82.6) | 149 (72.3) | .074 a |
| Clinical remission off medication | 73 (24.5) | 16 (17.4) | 55 (26.7) | .000 a | ||
| JIA subtype (n, %) | .615 a | |||||
| Systemic | 29 (9.7) | 11 (12.0) | 18 (8.7) | |||
| Oligoarticular, persistent | 113 (24.2) | 26 (28.3) | 87 (42.2) | |||
| Oligoarticular, extended | 32 (6.9) | 11 (12.0) | 21 (10.2) | |||
| Polyarticular, RF‐ | 63 (13.5) | 24 (26.1) | 39 (18.9) | |||
| Polyarticular, RF+ | 15 (3.2) | 5 (5.4) | 10 (4.9) | |||
| Enthesitis‐related | 18 (3.9) | 6 (6.5) | 12 (5.8) | |||
| Psoriatic arthritis | 15 (3.2) | 5 (5.4) | 10 (4.9) | |||
| Undifferentiated | 13 (4.4) | 4 (4.3) | 9 (4.4) | |||
| Laboratory studies | ||||||
| Positive ANA | 96 (20.6) | 67 (32.5) | 29 (31.5) | .645 a | ||
| Positive RF | 17 (3.6) | 12 (5.8) | 5 (5.4) | .457 a | ||
| Positive HLA‐B27 | 22 (4.7) | 15 (7.3) | 7 (7.6) | .629 a | ||
| Mean disease duration (months; mean, SD) | 62.1 (51.2) | 73.5 (56.9) | 57.1 (47.8) | .017 a | ||
| cJADAS (n, %) | .000 a | |||||
| 0–2 (low) | 189 (63.4) | 49 (53.3) | 140 (68.0) | |||
| 3–7 (moderate) | 61 (20.5) | 20 (21.7) | 41 (19.9) | |||
| ≥8 high | 42 (14.1) | 19 (20.7) | 23 (11.2) | |||
| Missing | 6 (2.0) | 4 (4.3) | 2 (1.0) | |||
| Medication use (n, %) | ||||||
| NSAIDS | 87 (29.2) | 33 (35.9) | 54 (26.2) | .090 a | ||
| Corticosteroid | 15 (5.0) | 8 (8.7) | 7 (3.4) | .050 a | ||
| DMARDS | 138 (46.3) | 43 (46.7) | 95 (46.2) | .627 a | ||
| Biologicals | 88 (29.5) | 37 (40.2) | 51 (24.8) | .007 a | ||
| No medication | 71 (23.8) | 16 (17.4) | 55 (26.7) | .074 a | ||
| DMARDS (n, %) | .404 a | |||||
| Methotrexaat | 119 (39.9) | 33 (35.9) | 86 (41.7) | |||
| Leflunomide | 12 (4.0) | 6 (6.5) | 6 (2.9) | |||
| Azathioprine | 2 (0.7) | 1 (1.1) | 1 (0.5) | |||
| Sulphasalazine | 2 (0.7) | 1 (1.1) | 1 (0.5) | |||
| Other | 3 (1.0) | 2 (2.2) | 1 (0.5) | |||
| No DMARDS | 160 (53.7) | 49 (53.3) | 111 (53.9) | |||
| Biologicals (n, %) | .073 a | |||||
| Adalimumab | 42 (14.1) | 14 (15.2) | 28 (13.6) | |||
| Etanercept | 23 (7.7) | 10 (10.9) | 13 (6.3) | |||
| Tocilizumab | 6 (2.0) | 3 (3.3) | 3 (1.5) | |||
| Canakinumab | 5 (1.7) | 2 (2.2) | 3 (1.5) | |||
| Golimumab | 5 (1.7) | 4 (4.3) | 1 (0.5) | |||
| Abatacept | 1 (0.3) | 1 (1.1) | 0 | |||
| Anakinra | 2 (0.7) | 1 (1.1) | 1 (0.5) | |||
| Infliximab | 1 (0.3) | 0 | 1 (0.5) | |||
| Other | 3 (1.0) | 2 (2.2) | 1 (0.5) | |||
| No biologicals | 210 (70.5) | 55 (59.8) | 155 (75.2) | |||
| AMVBF (Newton; mean, SD) | 136.7 (63.4) | 155.4 (68.1) | .004 b | 127.1 (64.6) | 141.0 (62.5) | .089 b |
Abbreviations: AMVBF, anterior voluntary maximum bite force; cJADAS, clinical juvenile arthritis disease activity score; DMARDS, disease‐modifying anti‐rheumatic drugs; JIA, juvenile idiopathic arthritis; NSAIDS, non‐steroidal anti‐inflammatory drugs; TMJ, temporomandibular joint.
Chi‐squared test.
Independent sample t‐test.
2.1. Anterior maximum voluntary bite force
The anterior maximum voluntary bite force (AMVBF) was measured using a bite force transducer, based on the bite force transducer from the Amsterdam University Medical Center and further developed by the University Medical Center Utrecht. 20 The bite force gauge is a handheld device with a load cell to measure AMVBF, with a range between 0 and 490 Newton (N) in a linear fashion. The device consists of a strain gauge mounted on a mouthpiece of 10 × 15 mm and a thickness of 12 mm. A plastic foil was applied around the mouthpiece for each child to guarantee hygiene. The mouthpiece was placed between the upper and lower central incisors. The bite force measurement consists of clenching, as hard as possible for ten seconds at maximum strength. Three attempts were documented. In between the three attempts, the children themselves indicated when they were ready for the next attempt. All participants were instructed and encouraged in a similar way through a taped voice recording. The highest bite force of the three attempts was defined as the AMVBF and is expressed in Newtons (N).
2.2. TMJ screening protocol
To establish clinical TMJ involvement, we used the TMJ screening protocol. 12 The assessment of the TMJ status in children with JIA and in the healthy children was carried out according to this protocol (Appendix S1). The measurements were performed by experienced examiners (WS, DV, MHS). The sum of the history, examination and inspection item scores (either 0 or 1) produced the TMJ screening protocol score.
The history items were collected by a questionnaire, adapted from the validated questionnaire “Screen”. 21 All participants were interviewed following this questionnaire regarding their mandibular function. The history items, part of the TMJ screening protocol, addressed the following: (1) problems in chewing; (2) eating slower than others; (3) difficulty in biting hard food; (4) pain while eating; and (5) a limited mouth opening.
The clinical examination items of the TMJ screening addressed (1) active maximum interincisal mouth opening (AMIO), (2) crepitation on mandibular opening and closing, (3) pain on AMIO and (4) left or right mandibular midline deviation on opening wide. 22
The AMIO was the distance between the incisal edges of the upper and lower central incisors, measured with a metal ruler to the nearest millimetre. The cutoff value for restricted mouth opening was ≤35 mm for children of 10 years old and younger and ≤40 mm in children older than 10 years. 23 A clinically visible deviation at maximum mouth opening (≥2 mm on maximum excursion) was scored, using the metal ruler as a reference line. Auscultation of the TMJs to establish crepitation was performed using a stethoscope during the opening and closing of the mouth. The stethoscope was placed on the skin over the TMJ. Patients were asked to open the mouth as far as possible and close the mouth.
The inspection items of the TMJ screening protocol addressed (1) facial asymmetry and (2) retrognathia. Facial asymmetry comprised the mandibular ramus length and chin deviation. Ramus length was assessed by palpating the left and right mandibular angle simultaneously and comparing the left and right side. Differences in right and left ramus length yielded a positive score.
Retrognathia was evaluated by the examiner using the images of the TMJ screening protocol (Appendix S1). A retrognathic profile as in the image was allocated a positive score. A normal profile and a class II profile scored zero points.
Each positive item of the TMJ screening protocol received 1 point; negative scoring items received 0 points. All positive items produced the TMJ screening protocol score. A TMJ screening protocol score ≥2 has been suggested to indicate clinically established TMJ involvement in children with JIA. 12
2.3. TMJ and masseter and temporal muscle palpation pain
The TMJ and masseter and temporal muscles were palpated for pain provocation extra‐orally. A numeric rating scale (NRS) was used in which no pain had a score of 0 and the worst imaginable pain scored 10. The NRS is a validated measurement tool for pain measurements. 24 In the case of NRSpain > 3, the pain report was supposed to be clinically relevant. 25
2.4. Statistical analysis
Characteristics of the children were presented as numbers and percentages, as means and standard deviations (SD). For the analyses of all clinical data (demographics, JIA characteristics, AMVBF, TMJ screening protocol score, TMJ and masseter and temporal muscle palpation pain), the unpaired Student t‐test was used for continuous data, and the chi‐square test was used for dichotomous or ordered categorical outcomes.
We used linear regression analysis to assess the difference in AMVBF between healthy children and children with JIA, with and without TMJ involvement. We considered several potential confounding factors: age, gender, and height. Age and height showed a high correlation (i.e., collinearity), suggesting the explanatory impact is very similar. Additionally, when we graphically evaluated the effect of age on AMVBF, we noticed a non‐linear effect, suggesting that AMVBF reaches a maximum during adolescence. We therefore include age squared in addition to a linear term.
For these variables, we performed unadjusted (i.e., for each variable separately) and adjusted analyses. Subsequently, two adjusted models were constructed. Model 1 compared AMVBF in children with JIA and healthy children, with corrections for age, age squared and gender. Model 2 compared AMVBF in children with and without TMJ involvement, also with corrections for age, age squared and gender.
In a secondary analysis, we explored the effect of disease characteristics, cJADAS and medication use, and the variables orthodontic treatment, TMJ screening protocol score, TMJ, masseter and temporal palpation pain, height, problems with biting something off, problems with eating hard, chewy or soft food, without adjustment for gender and age. Validity of the models (i.e., normality, homoscedasticity) was assessed with residual analysis. 26
Results were reported as regression coefficients with 95% CIs and p‐values. For dichotomous variables, regression coefficients represent the difference in mean AMVBF. For continuous variables, the regression coefficient represents the increase in mean AMVBF for each unit increase in the explanatory variable. To provide insight into the results, figures were constructed to show estimated marginal mean AMVBF from models 1 and 2, comparing healthy children with JIA, both with and without TMJ involvement, over ages ranging from 6 to 18 years.
A p‐value of less than 0.05 was accepted as significant. Statistical analyses were performed using SPSS 25 (IBM SPSS Statistics for Windows, version 25.0. IBM Corp).
3. RESULTS
In this cross‐sectional study, 298 children with JIA and 169 healthy children participated (Table 1). The children with JIA had a mean age of 12.7 years (SD 3.5), a mean height of 157.1 cm (SD 18.3) and a mean disease duration of 62.1 months (SD 51.2), and 67.8% of the participants were girls. The healthy children had a mean age of 11.5 years (SD 3.5) and a mean height of 153.0 cm (SD 20.9), and 47.9% were girls. From the total of 298 children with JIA, 92 (30.9%) had TMJ involvement (TMJ screening protocol score ≥2) (Table 2). Children in the group “JIA with TMJ involvement” had a significantly higher age compared with the group “JIA without TMJ involvement” (p = .032), had less clinical remission off medication (p = .000), had a longer mean disease duration (p = .017), had a higher score on the cJADAS (p = .000) and used more biologicals (p = .007).
TABLE 2.
Scores of TMJ screening protocol for JIA patients and healthy children
| TMJ score | JIA, n = 298 | Healthy children n = 169 | JIA with TMJ involvement n = 92 | JIA without TMJ involvement n = 206 |
|---|---|---|---|---|
| Score 0 | 148 (49.7%) | 138 (81.7%) | 0 | 148 |
| Score ≥ 1 | 150 (50.3%) | 31 (18.3%) | 0 | 58 |
| Score ≥ 2 | 92 (30.9%) | 0 (0.0%) | 92 | 0 |
| Score ≥ 3 | 63 (21.1%) | 0 (0.0%) | 63 | 0 |
A TMJ screening.
Abbreviations: JIA, juvenile idiopathic arthritis; TMJ, temporomandibular joint.
3.1. AMVBF in children with JIA, with and without TMJ involvement and in healthy children
After adjustment, AMVBF was 24.0 N lower (95% CI: −35.5–−12.4, p = .000) compared with healthy children (Table 3, model 1, Figure 1). When we incorporated TMJ involvement, this difference was reduced to 16.8 N (95% CI: −28.9–−4.6, p = .007). In children with JIA and TMJ involvement, AMVBF was 42.1 N lower compared with healthy children (Table 3, model 2, Figure 2). The 42.1 N reduction in AMVBF is the effect of the JIA diagnosis, which resulted in a 16.8 N reduction, and the clinical established TMJ involvement diagnosis, which resulted in a 25.4 N reduction. The adjusted variable male gender increases AMVBF with 22.7 N (95% CI: 34.0–11.4, p = .000, Table 3, model 1). The effect of age combined with age squared results in an increase of 13.4 N for each year (95% CI: 7.5–19.4, p = .000), with the flattening effect of age squared of −0.5 N (95% CI:−1.0–−0.02, p = .074) (Table 3, model 1, Figure 1).
TABLE 3.
Adjusted and unadjusted linear regression model for AMVBF in children with JIA
| Variable | Unadjusted Regression coefficients (95% CI) | p‐value | Adjusted Model 1 JIA vs healthy children Regression coefficients (95% CI) | p‐value | Adjusted Model 2 JIA with vs without TMJ Regression coefficients (95% CI) | p‐value |
|---|---|---|---|---|---|---|
| JIA vs healthy children | −18.71 (−31.12–−6.29) | .003 | −24.0 (−35.50–−12.40) | .000 | −16.78 (−28.96–−4.59) | .007 |
| JIA with vs without TMJ involvement | −20.49 (−35.57–−5.41) | .008 | −25.36 (−40.08–−10.63) | .001 | ||
| Male gender | 25.97 (13.82–38.12) | .000 | 22.7 (33.98–11.44) | .000 | 22.41 (33.55–11.26) | .000 |
| Age (centred at 6) | 13.59 (7.44–19.74) | .000 | 13.43 (7.51–19.35) | .000 | 13.20 (7.35–19.06) | .000 |
| Age squared (centred at 6) | −0.58 (−1.08–−0.07) | .025 | −0.50 (−0.99–−0.02) | .042 | −0.45 (−0.93–0.37) | .070 |
| Intercept | 138.42 (115.27–161.58) | 129.85 (106.43–153.28) | ||||
| R 2 | .212 | .231 |
| Variable | Unadjusted Regression coefficients (95% CI) | p‐value |
|---|---|---|
| TMJ screening protocol score | −6.38 (−10.51–−2.25) | .003 |
| Orthodontic treatment | −10.13 (−27.64–7.38) | .256 |
| Pain during palpation: TMJ | −26.94 (−50.50–−3.38) | .025 |
| Pain during palpation: masseter muscle | 2.78 (−19.67–25.22) | .808 |
| Pain during palpation: temporal muscle | −30.89 (−67.14–5.36) | .095 |
| cJADAS | 0.253 (−1.351–1.857) | .757 |
| Medication use | −2.38 (−14.50–9.75) | .700 |
| Height | 1.31 (1.02–1.60) | <.000 |
| Problems to bite off | −11.56 (−35.22–12.11) | .338 |
| Problems eating hard food | −22.17 (−48.18–3.85) | .095 |
| Problems eating chewy food | −20.47 (−46.47–5.53) | .122 |
| Problems eating soft food | −49.50 (−107.35–8.36) | .093 |
A TMJ screening protocol score ≥2 is proposed to indicate TMJ involvement in children with JIA. 12 The unadjusted model showed the association of each variable to AMVBF. Model 1 showed AMVBF and the effect of children with JIA and healthy children, with corrections for gender and age (R 2 = .212). Model 2 showed the additional comparison between children with JIA with TMJ involvement and children with JIA without TMJ involvement, and with corrections for gender and age (R 2 = .231).
Abbreviations: CI, confidence interval; cJADAS, clinical juvenile arthritis disease activity score; JIA, juvenile idiopathic arthritis; TMJ, temporomandibular joint.
FIGURE 1.
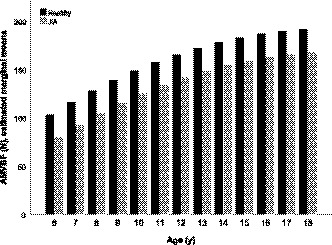
Estimated marginal means anterior voluntary maximum bite force in children with JIA and in healthy children. The estimated marginal means of anterior voluntary maximum bite force (AMVBF) are subtracted from the linear regression model 1 (Table 3). The AMVBF in Newton (N) for each year group is presented
FIGURE 2.
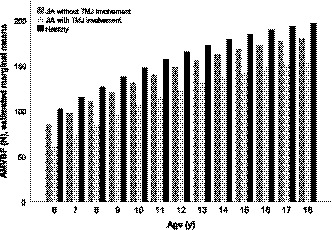
Estimated marginal means anterior voluntary maximum bite force in children with JIA, with and without TMJ involvement and in healthy children. The estimated marginal means of anterior voluntary maximum bite force (AMVBF) are subtracted from the linear regression model 2 (Table 3). The AMVBF in Newton (N) for each year group is presented
3.2. Factors related to anterior maximum voluntary bite force
In the unadjusted linear regression models, age combined with age squared, gender, JIA, TMJ involvement, TMJ screening protocol score, TMJ palpation pain and height were associated with AMVBF (Table 3). The variables orthodontic treatment (p = .256), masseter muscle palpation pain (p = .808), temporal muscle palpation pain (p = .095), cJADAS (p = .757) and medication use (p = .700) did not have a significant influence on AMVBF.
3.3. TMJ screening protocol
Each item of the TMJ screening protocol was statistical significantly more present in children with JIA than in healthy children (p < .05), except retrognathia (p = .325; Table 4). TMJ, masseter and temporal muscle palpation pain were reported more frequently in children with JIA compared with healthy children (p < .05). Children with TMJ involvement most frequently reported “pain while eating” (53.3%) and were examined with “deviation AMIO” (50.0%), asymmetry (45.7%) and problems with chewing (43.5%), as depicted in Table 4. In children with JIA and TMJ involvement, palpation pain of the TMJ, masseter muscle and temporal muscle outcomes were more frequently reported than in children with JIA without TMJ involvement.
TABLE 4.
The TMJ screening protocol scores, palpation pain in patients with JIA, with and without TMJ involvement and in healthy children
| JIA, n = 298 | Healthy, n = 169 | p‐value | JIA with TMJ involvement n = 92 | JIA without TMJ involvement, n = 206 | |
|---|---|---|---|---|---|
| Items of the TMJ protocol score | |||||
| History: | |||||
| Problems in chewing (n, %) | 42 (14.1) | 0 (0.0) | <.000 | 40 (43.5) | 2 (1.0) |
| Eating more slowly than others (n, %) | 28 (9.4) | 5 (3.0) | .005 | 26 (28.3) | 2 (1.0) |
| Biting hard food difficult (n, %) | 38 (12.8) | 0 (0.0) | <.000 | 38 (41.3) | 0 (0.0) |
| Pain while eating (n, %) | 54 (18.1) | 0 (0.0) | <.000 | 49 (53.3) | 5 (2.4) |
| Limited mouth opening (n, %) | 33 (11,1) | 1 (0.6) | <.000 | 29 (31.5) | 4 (1.9) |
| Examination | |||||
| Limited mouth opening (n, %) | 42 (14.1) | 2 (1.2) | <.000 | 33 (35.9) | 9 (4.4) |
| Crepitation (audible) (n, %) | 33 (11.1) | 0 (0.0) | <.000 | 26 (28.3) | 7 (3.4) |
| Pain AMIO (n, %) | 21 (7.0) | 0 (0.0) | <.000 | 20 (21.7) | 1 (0.5) |
| Deviation AMIO (>2 mm) (n, %) | 51 (17.1) | 1 (0.6) | <.000 | 46 (50.0) | 5 (2.4) |
| Inspection | |||||
| Asymmetry (n, %) | 57 (19.1) | 13 (7.8) | .001 | 42 (45.7) | 15 (7.3) |
| Retrognathia (n, %) | 23 (7.7) | 9 (5.4) | .325 | 15 (16.3) | 8 (3.9) |
| Palpation pain | |||||
| TMJ (n, %) | 28 (9.4) | 4 (2.4) | .004 | 18 (19.6) | 10 (4.9) |
| Masseter muscle (n, %) | 30 (10.1) | 6 (3.6) | .011 | 22 (23.9) | 8 (3.9) |
| Temporal muscle (n, %) | 13 (4.4) | 0 (0.0) | .006 | 11 (12.0) | 2 (1.0) |
Chi‐square test was used in all variables.
Abbreviations: AMIO, active maximum interincisal mouth opening; JIA, juvenile idiopathic arthritis; TMJ, temporomandibular joint.
TMJ screening protocol score: Appendix S1.
4. DISCUSSION
In this cross‐sectional study, children with JIA had a lower AMVBF compared with healthy children. Only part of this difference is due to TMJ involvement; in a second analysis, a lower AMVBF was still observed in children with JIA without TMJ involvement. Additionally, we also observed a higher maximum bite force in boys and in older children.
We found a decrease of 24.0 N of maximum bite force in children with JIA, corresponding with a reduction of 17.3% compared with healthy children. In children with JIA and TMJ involvement, we found a reduction of 42.1 N in maximum bite force, which is a reduction of 32.2% compared with healthy children. In a cross‐sectional study, it was found that children with JIA and TMJ involvement had a maximum bite force reduction of 30%, which is in accordance with our results. This study only selected children with JIA with clinically established TMJ involvement; a comparison with our children with JIA without TMJ involvement was not possible. 17
We found 30.9% (92 out of 298 children with JIA) with clinically established TMJ involvement. In a previous study using the same clinical screening protocol, 33.8% of the children with JIA were assigned as “with TMJ involvement,” supporting the validity of our protocol. 12
Some studies found a higher prevalence of TMJ involvement in children with JIA 27 , 28 This might be the effect of terminology, method of identifying TMJ involvement and difference in study groups. It should be mentioned that we used the term “clinically established TMJ involvement” instead of TMJ arthritis, as we only performed a clinical screening of the TMJ in children with JIA. 29 , 30 Secondly, studies that used the “gold standard” MRI to establish TMJ involvement may be more accurate to detect TMJ involvement. 1 , 9 , 29 For example, a study reported 75% active TMJ arthritis diagnosed by MRI. However, only children with new‐onset JIA not yet treated were included, whereas the children with JIA in our study were in regular care by the paediatric rheumatologist, as indicated in Table 1, mean disease duration. 27 Thirdly, we did not select children with JIA with TMJ complaints on beforehand. All children who were in regular care of the paediatric rheumatologist could participate in our study.
The reduction in AMVBF in children with JIA without TMJ involvement may also be the result of our clinical detection method for TMJ involvement. Our clinical diagnosis is probably less accurate than diagnosis by MRI (the gold standard). 1 , 9 , 29 Since the TMJ is quoted as the “silent” joint, implicating arthritis not detected by clinical examination only, 5 , 6 the AMVBF reduction in children with JIA can thus be related to underdiagnoses of TMJ arthritis.
Whether or not children with JIA without clinically established TMJ involvement have (a history of) TMJ arthritis, in comparison with their healthy peers, their bite force is reduced, although to a lesser extent than in children with clinically established TMJ involvement. In addition, in the subgroup “JIA without clinically established TMJ involvement” clinical remission off medication was more prevalent than in the group “JIA with clinically established TMJ involvement” (Table 1). This may explain their slightly reduced bite force compared with the healthy children and more pronounced bite force reduction compared with the children with JIA with clinically established TMJ involvement as well.
Another possible explanation for the AMVBF reduction in children with JIA without TMJ involvement compared with healthy children can be the psychological effects of a hospital setting for children with JIA. 31 The measurements for children with JIA were conducted in a hospital, while the measurements for healthy children were performed in their own school. Behavioural alternations and situational changes are mentioned as influencing factors for maximum bite force. 31
The demographic variables age and gender were significant factors of influence on AMVBF in both children with JIA and healthy children. AMVBF increased by male gender and increasing age, which were also found in previous studies with healthy children. 32 , 33 , 34 In our study, age and height showed a high correlation (i.e., collinearity), suggesting the explanatory impact is very similar. We chose the variable age as we found a slightly higher explained variation (R 2 = .22) in the adjusted analysis compared with length (R 2 = .20). Moreover, in the literature, age has been mostly used as a factor of influence in bite force. 17 , 35 , 36 On the other hand, height might also be an accurate correction to compare a growing population as in children. Children in the same age group can differ greatly in height, especially among different nationalities. Our study was performed in the Dutch population, known as one of the tallest populations in the world. 37 To compare our findings among bite force in an international setting, height might be more applicable than age.
The physiological mechanism behind the reduced AMVBF is not completely clarified yet. In the literature, bite force reduction in children with JIA is explained by muscle involvement as a consequence of the systemic inflammatory disease itself and by weakened masticatory muscles. 17 The weakened masticatory muscles may be reflected in problems to bite off, eating hard food, eating chewy food and eating soft food; these variables did not have a significant effect, although the regression coefficients are relatively high (Table 3). Handgrip strength has been reported to be reduced as well in children with JIA, due to muscle weakness. 38 Muscle pain is a prevalent symptom in children with JIA and TMJ involvement, but muscle pain itself seems not to be an explanation for the AMVBF reduction. It has been shown that experimental induced pain in the TMJ or masticatory muscles did not affect the bite force. 39 The strengths of this study were its large study population (n = 298), the comparison with healthy controls and the evaluation of all children with JIA, with and without TMJ involvement. We chose to measure the interincisal maximum bite force instead of molar bite force, as a higher reliability for interincisal bite force has been described compared with molar bite force. 31 Measuring interincisal bite force implies a more symmetrical bite than unilateral molar bites, possibly explaining the high–intra‐class correlation. In addition, the bite force transducer in the molar region will lead to a larger gap than interincisal bites. In younger children, this may well be an advantage. However, difficulties when using interincisal bite force may also arise. The pressure on the front teeth of not completely erupted front teeth could have an unusual sensation that may influence the bite force. In general, all patients and healthy children indicated some soreness of the front teeth for a few seconds. The results from the three attempts do not indicate a trend towards a lower bite force in the second and third attempts due to unwillingness to generate a maximum bite force. In addition, restoration and tooth shedding of the front teeth may lead to the inability of a bite force measurement. We used the lateral incisors in case the central incisors were absent. Restoration or tooth eruption in the molar region may have less influence of bite force measurement due to more occlusal surface in the lateral area of the dental arches. The parameter dental status has been found as an influencing factor for maximum bite force. 31 In our study, we did not measure the dental status, although to our knowledge there are no indications in the literature and from our clinical experience that dental status is likely to differ between children with JIA and healthy children. Therefore, we presumed that the difference in AMVBF between the groups was mainly caused by JIA and by TMJ involvement. In future research, these factors could be studied to gain more insight into their influence in children with JIA and their maximum bite force. Thereby, a longitudinal prospective cohort study is important to obtain more evidence related to the influence of JIA with and without TMJ involvement on maximum bite force.
Another important question could be answered in further studies by studying the clinical relevance of the bite force reduction found in children with JIA. Our study found no correlation between bite force reduction and problems with eating hard, chewy and soft food. Nevertheless, the regression coefficients are relatively high and may be an indication of problems in eating.
A limitation of this study is the use of the TMJ screening protocol to clinically establish TMJ involvement, instead of the more accurate “gold standard” MRI. However, MRI has disadvantages such as the need for sedation, the need for infusion due to the contrast, the concern with contrast retention in the human brain, limited availability and expertise, as well as high costs. 40 , 41 In case of patients with dental braces, scattering can also lead to inadequate images. In the future, it might be worthwell to study AMVBF in children with JIA and TMJ involvement identified by MRI as the gold standard.
In conclusion, our study showed a considerable bite force reduction and less functioning of the TMJ in children with JIA compared to healthy children, and even more reduction in these issues in children with JIA and TMJ involvement compared to JIA without TMJ involvement. For all children, the demographic variables age, height and male gender increased the maximum bite force.
CONFLICT OF INTEREST
The authors report no financial conflicts of interest.
PEER REVIEW
The peer review history for this article is available at https://publons.com/publon/10.1111/joor.13172.
Supporting information
Appendix S1
Supplementary Material
ACKNOWLEDGEMENT
We thank Ernest Boskovic for the technical support and software development of the bite force transducer.
de Sonnaville WFC, Speksnijder CM, Zuithoff NPA, et al. Maximum bite force in children with juvenile idiopathic arthritis with and without clinical established temporomandibular joint involvement and in healthy children: a cross‐sectional study. J Oral Rehabil. 2021;48:774–784. 10.1111/joor.13172
DATA AVAILABILITY STATEMENT
The data that support the findings of this study are available from the corresponding author upon reasonable request.
REFERENCES
- 1. Stoustrup P, Twilt M, Spiegel L, et al. Clinical orofacial examination in juvenile idiopathic arthritis: international consensus‐based recommendations for monitoring patients in clinical practice and research studies. J Rheumatol. 2017;44(3):326‐333. 10.3899/jrheum.160796 [DOI] [PubMed] [Google Scholar]
- 2. Kellenberger CJ, Junhasavasdikul T, Tolend M, Doria AS. Temporomandibular joint atlas for detection and grading of juvenile idiopathic arthritis involvement by magnetic resonance imaging. Pediatr Radiol. 2018;48(3):411‐426. 10.1007/s00247-017-4000-0 [DOI] [PMC free article] [PubMed] [Google Scholar]
- 3. Petty RE, Southwood TR, Manners P, et al. International league of associations for rheumatology classification of juvenile idiopathic arthritis: second revision, Edmonton, 2001. J Rheumatol. 2004;31(2):390‐392. [PubMed] [Google Scholar]
- 4. Kellenberger CJ, Junhasavasdikul T, Tolend M, Doria AS, Kellenberger CJ. Identification and grading of juvenile idiopathic arthritis related changes in the temporomandibular joints in contrast enhanced magnetic resonance imaging: an imaging atlas. Pediatr Radiol. 2017;47(S1):1‐296. 10.1007/s00247-017-3809-x 27889813 [DOI] [Google Scholar]
- 5. Arabshahi B, Cron RQ. Temporomandibular joint arthritis in juvenile idiopathic arthritis: the forgotten joint. Curr Opin Rheumatol. 2006;18:490‐495. [DOI] [PubMed] [Google Scholar]
- 6. Fernanda F, Daniela M, Lorenzo C, et al. Temporomandibular joint involvement (TMJ), a silent disease with severe alterations in young adulthood patients affected by juvenile idiopathic arthritis (JIA). Pediatr Rheumatol. 2011;9(S1):P174. 10.1186/1546-0096-9-s1-p174 [DOI] [Google Scholar]
- 7. Arvidsson LZ, Fjeld MG, Smith HJ, Flatø B, Øgaard B, Larheim TA. Craniofacial growth disturbance is related to temporomandibular joint abnormality in patients with juvenile idiopathic arthritis, but normal facial profile was also found at the 27‐year follow‐up. Scand J Rheumatol. 2010;39(5):373‐379. 10.3109/03009741003685624 [DOI] [PubMed] [Google Scholar]
- 8. Isola G, Perillo L, Migliorati M, et al. The impact of temporomandibular joint arthritis on functional disability and global health in patients with juvenile idiopathic arthritis. Eur J Orthod. 2019;41(2):117‐124. 10.1093/ejo/cjy034 [DOI] [PubMed] [Google Scholar]
- 9. Kuseler A, Pedersen T, Gelineck J, Herlin T. A 2‐year follow‐up study of enhanced magnetic resonance imaging and clinical examination of the temporomandibular joint in children with juvenile idiopathic arthritis. J Rheumatol. 2005;32(1):162‐169. [PubMed] [Google Scholar]
- 10. Frid P, Nordal E, Bovis F, et al. Temporomandibular joint involvement in association with quality of life, disability, and high disease activity in juvenile idiopathic arthritis. Arthritis Care Res. 2017;69(5):677‐686. 10.1002/acr.23003 [DOI] [PubMed] [Google Scholar]
- 11. Kristensen KD, Stoustrup P, Küseler A, Pedersen TK, Twilt M, Herlin T. Clinical predictors of temporomandibular joint arthritis in juvenile idiopathic arthritis: a systematic literature review. Semin Arthritis Rheum. 2016;45(6):717‐732. 10.1016/j.semarthrit.2015.11.006 [DOI] [PubMed] [Google Scholar]
- 12. Steenks MH, Giancane G, de Leeuw RRJ, et al. Temporomandibular joint involvement in juvenile idiopathic arthritis: reliability and validity of a screening protocol for the rheumatologist. Pediatr Rheumatol. 2015;13(1):1‐8. 10.1186/s12969-015-0011-2 [DOI] [PMC free article] [PubMed] [Google Scholar]
- 13. Ringold S, Cron RQ. The temporomandibular joint in juvenile idiopathic arthritis: frequently used and frequently arthritic. Pediatr Rheumatol. 2009;7:1‐9. 10.1186/1546-0096-7-11 [DOI] [PMC free article] [PubMed] [Google Scholar]
- 14. Hansdottir R, Bakke M. Joint tenderness, jaw opening, chewing velocity, and bite force in patients with temporomandibular joint pain and matched healthy control subjects. J Orofac Pain. 2004;18(2):108‐113. [PubMed] [Google Scholar]
- 15. van der Bilt A Tekamp A, van der Glas H Abbink J. Bite force and electromyograpy during maximum unilateral and bilateral clenching. Eur J Oral Sci. 2008;116(3):217‐222. 10.1111/j.1600-0722.2008.00531.x [DOI] [PubMed] [Google Scholar]
- 16. Pereira LJ, Duarte Gaviao MB, Van Der Bilt A. Influence of oral characteristics and food products on masticatory function. Acta Odontol Scand. 2006;64(4):193‐201. 10.1080/00016350600703459 [DOI] [PubMed] [Google Scholar]
- 17. Wenneberg B, Kjellberg H, Kiliaridis S. Bite force and temporomandibular disorder in juvenile chronic arthritis. J Oral Rehabil. 1995;22(8):633‐641. [DOI] [PubMed] [Google Scholar]
- 18. Ruperto N, Martini A. Current medical treatments for juvenile idiopathic arthritis. Front Pharmacol. 2011;2:1‐8. 10.3389/fphar.2011.00060 [DOI] [PMC free article] [PubMed] [Google Scholar]
- 19. Consolaro A, Negro G, Chiara Gallo M, et al. Defining criteria for disease activity states in nonsystemic juvenile idiopathic arthritis based on a three‐variable juvenile arthritis disease activity score. Arthritis Care Res. 2014;66(11):1703‐1709. 10.1002/acr.22393 [DOI] [PubMed] [Google Scholar]
- 20. Weijenberg RAF, Lobbezoo F, Knol DL, Tomassen J, Scherder EJA. Increased masticatory activity and quality of life in elderly persons with dementia‐a longitudinal matched cluster randomized single‐blind multicenter intervention study. BMC Neurol. 2013;13:1‐9. 10.1186/1471-2377-13-26 [DOI] [PMC free article] [PubMed] [Google Scholar]
- 21. de Leeuw JRJ, Ros WJG, Steenks MH, Lobbezoo‐Scholte AM, Bosman F, Winnubst JAM. Multidimensional evaluation of craniomandibular dysfunction. II: pain assessment. J Oral Rehabil. 1994;21(5):515‐532. 10.1111/j.1365-2842.1994.tb01166.x [DOI] [PubMed] [Google Scholar]
- 22. Lobbezoo‐Scholte AM, Steenks MHFJ. Diagnostic value of orthopaedic tests in patients with temporomandibular disorders. J Dent Res. 1993;72:1443‐1453. [DOI] [PubMed] [Google Scholar]
- 23. van Bruggen HW, van den Engel‐Hoek L, van der Pol WL, de Wijer A, de Groot IJM, Steenks MH. Impaired mandibular function in spinal muscular atrophy type II: need for early recognition. J Child Neurol. 2011;26(11):1392‐1396. 10.1177/0883073811407696 [DOI] [PubMed] [Google Scholar]
- 24. Williamson A, Hoggart B. Pain: a review of three commonly used pain rating scales. J Clin Nurs. 2005;14(7):798‐804. 10.1111/j.1365-2702.2005.01121.x [DOI] [PubMed] [Google Scholar]
- 25. Karcioglu O, Topacoglu H, Dikme O, Dikme O. A systematic review of the pain scales in adults: which to use? Am J Emerg Med. 2018;36(4):707‐714. 10.1016/j.ajem.2018.01.008 [DOI] [PubMed] [Google Scholar]
- 26. Kleinbaum D, Kupper L, Nizam A, Muller A. Applied Regression Analysis and Other Multivariable Methods, 3rd ed. Pacific Grove, CA: Duxbury Press; 1998. [Google Scholar]
- 27. Weiss PF, Arabshahi B, Johnson A, et al. High prevalence of temporomandibular joint arthritis at disease onset in children with juvenile idiopathic arthritis, as detected by magnetic resonance imaging but not by ultrasound. Arthritis Rheum. 2008;58(4):1189‐1196. 10.1002/art.23401 [DOI] [PubMed] [Google Scholar]
- 28. Twilt M, Mobers SMLM, Arends LR, et al. Temporomandibular involvement in juvenile idiopathic arthritis. J Rheumatol. 2004;31(7):1418‐1422. [PubMed] [Google Scholar]
- 29. Stoustrup P, Resnick CM, Pedersen TK, et al. Standardizing terminology and assessment for orofacial conditions in juvenile idiopathic arthritis: International, multidisciplinary consensus‐based recommendations. J Rhematol. 2019;46:518‐522. 10.3899/jrheum.180785 [DOI] [PubMed] [Google Scholar]
- 30. Steenks MH. Temporomandibular joint damage in juvenile idiopathic arthritis: diagnostic validity of diagnostic criteria for temporomandibular disorders. J Oral Rehabil. 2019;46(10):883‐884. 10.1111/joor.12811 [DOI] [PubMed] [Google Scholar]
- 31. Roldán S, Buschang PH, Isaza Saldarriaga JF, Throckmorton G. Reliability of maximum bite force measurements in age‐varying populations. J Oral Rehabil. 2009;36(11):801‐807. 10.1111/j.1365-2842.2009.01997.x [DOI] [PubMed] [Google Scholar]
- 32. van der Bilt A. Assessment of mastication with implications for oral rehabilitation: a review. J Oral Rehabil. 2011;38(10):754‐780. 10.1111/j.1365-2842.2010.02197.x [DOI] [PubMed] [Google Scholar]
- 33. Palinkas M, Nassar MSP, Cecílio FA, et al. Age and gender influence on maximal bite force and masticatory muscles thickness. Arch Oral Biol. 2010;55(10):797‐802. 10.1016/j.archoralbio.2010.06.016 [DOI] [PubMed] [Google Scholar]
- 34. Kamegai T, Tatsuki T, Nagano H, et al. A determination of bite force in northern Japanese children. Eur J Orthod. 2005;27(1):53‐57. 10.1093/ejo/cjh090 [DOI] [PubMed] [Google Scholar]
- 35. Roldán SI, Restrepo LG, Isaza JF, Vélez LG, Buschang PH. Are maximum bite forces of subjects 7 to 17 years of age related to malocclusion? Angle Orthod. 2016;86(3):456‐461. 10.2319/051315-323.1 [DOI] [PMC free article] [PubMed] [Google Scholar]
- 36. Yamanaka R, Akther R, Furuta M, et al. Relation of dietary preference to bite force and occlusal contact area in Japanese children. J Oral Rehabil. 2009;36(8):584‐591. 10.1111/j.1365-2842.2009.01971.x [DOI] [PubMed] [Google Scholar]
- 37. Schönbeck Y, Talma H, van Dommelen P, et al. The world’s tallest nation has stopped growing taller: the height of Dutch children from 1955 to 2009. Pediatr Res. 2013;73(3):371‐377. 10.1038/pr.2012.189 [DOI] [PubMed] [Google Scholar]
- 38. Rashed AM, Abdel‐Wahab N, Moussa EMM, Hammam N. Association of hand grip strength with disease activity, disability and quality of life in children and adolescents with Juvenile Idiopathic Arthritis. Adv Rheumatol. 2018;58(1):11. 10.1186/s42358-018-0012-1 [DOI] [PubMed] [Google Scholar]
- 39. Kumar A, Castrillon E, Svensson P. Can experimentally evoked pain in the jaw muscles or temporomandibular joint affect anterior bite force in humans? J Oral Facial Pain Headache. 2015;29(1):31‐40. 10.11607/ofph.1268 [DOI] [PubMed] [Google Scholar]
- 40. Hechler BL, Phero JA, Van Mater H, Matthews NS. Ultrasound versus magnetic resonance imaging of the temporomandibular joint in juvenile idiopathic arthritis: a systematic review. Int J Oral Maxillofac Surg. 2018;47(1):83‐89. 10.1016/j.ijom.2017.07.014 [DOI] [PubMed] [Google Scholar]
- 41. Elbeshlawi I, AbdelBaki MS. Safety of gadolinium administration in children. Pediatr Neurol. 2018;86:27‐32. 10.1016/j.pediatrneurol.2018.07.010 [DOI] [PubMed] [Google Scholar]
Associated Data
This section collects any data citations, data availability statements, or supplementary materials included in this article.
Supplementary Materials
Appendix S1
Supplementary Material
Data Availability Statement
The data that support the findings of this study are available from the corresponding author upon reasonable request.