Abstract
The i‐motif DNA, also known as i‐DNA, is a non‐canonical DNA secondary structure formed by cytosine‐rich sequences, consisting of two intercalated parallel‐stranded duplexes held together by hemi‐protonated cytosine–cytosine+ (C:C+) base pairs. The growing interest in the i‐DNA structure as a target in anticancer therapy increases the need for tools for a rapid and meaningful interpretation of the spectroscopic data of i‐DNA samples. Herein, we analyzed the circular dichroism (CD) and thermal difference UV‐absorbance spectra (TDS) of 255 DNA sequences by means of multivariate data analysis, aiming at unveiling peculiar spectral regions that could be used as diagnostic features during the analysis of i‐DNA‐forming sequences.
Keywords: circular dichroism, DNA, i-motif, multivariate data analysis, thermal difference spectroscopy
i‐DNA is an emerging non‐canonical DNA secondary structure that represents a suitable target in anticancer therapy. A multivariate data analysis unveiled peculiar TDS and CD spectral regions that could be used for the structural determination of i‐DNA‐forming sequences.

Introduction
In the last decades, a variety of DNA secondary structures other than the canonical Watson–Crick duplex, have been documented. Such structural polymorphism depends on sequence, hydration, ions and/or ligands and superhelical stress; it occurs during biological processes such as replication and transcription, thus having an impact on genetic stability. [1] Non‐canonical DNA structures include hairpins, cruciforms, triplexes, G‐quadruplexes (G4s), and i‐motifs (i‐DNAs).[ 2 , 3 , 4 , 5 , 6 , 7 ] i‐DNA was first observed in 1993 for the hexamer sequence d(TCCCCC) under acidic conditions. [8] It consists of two intercalated parallel‐stranded duplexes held together by hemi‐protonated cytosine–cytosine+ (C:C+) base pairs (Figure 1 A).[ 8 , 9 ] i‐DNA formation at physiological pH has been recently reported.[ 10 , 11 ] Moreover, the generation of an antibody able to detect i‐DNA has proved its presence in the nucleus of human cells, arguing for regulatory roles in the genome, e.g., at proto‐oncogene promoters and telomeres, [12] making this DNA structure a potential target for anticancer therapy. Putative i‐DNA‐forming sequences occur in C‐rich strands complementary to G‐rich regions that may form G4s. However, if the G4 counterpart folding conditions have already been extensively studied, i‐DNA's optimal features for its formation near physiological pH in vitro are still under investigation. In fact, several studies have been conducted recently to better understand the influence of external conditions, such as presence of metals[ 13 , 14 ] or ligands,[ 15 , 16 , 17 ] molecular crowding,[ 11 , 18 , 19 ] cation type and ionic strength, [20] on i‐DNA formation. However, i‐DNA stability also depends on sequence composition. A typical formula of an intramolecular i‐DNA‐forming sequence is (CnXN)3Cn, where X can be either a C or non‐C (T, A, G); the presence of four C tracts (Cn) allows the generation of a C‐stem, while the three spacers (XN), connect the four cytosine tracts (C‐tracts) and form the loops (Figure 1 B).
Figure 1.
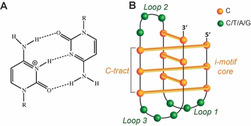
A) Hemi‐protonated cytosine–cytosine+ (C:C+) base pair. B) Schematic representation of an i‐motif structure.
Much attention has been paid to the influence of the loops’ length and composition as well as to the length of the C‐tracts. In general, it was found that thymines confer a higher i‐DNA stability compared to other non‐C deoxynucleotides.[ 21 , 22 ] Very recently, the Vorlickova's group reported a systematic investigation of sequence requirements for i‐DNA formation. They found that the lower number of residues are present in the spacers, the more i‐DNA is destabilized. This is due to the loss of C:C+ base pairs as several Cs need to be incorporated into the loops to compensate for the short linkers. [23]
In the companion paper of this investigation, some of us have explored the simultaneous variation of both C‐tract length and loop arrangements. [24] In particular, by analyzing a first set of 180 different DNA sequences (Table S1), the contribution of C‐tracts and spacer length on i‐DNA stability was explored. The general formula of the majority of i‐DNA‐forming oligos employed in that study is C(3–6)T(1–6)C(3–6)T(1–6)C(3–6)T(1–6)C(3–6). We investigated sequences with cytosine tracts of equal length made of 3 up to 6 Cs and three spacers made of 1 up to 6 thymines, in such a combination to have from 4 to 12 total thymines. The samples were named according to the following rationale: a “T” was used as prefix because the three spacers were composed of thymines only; three consecutive numbers were used to describe the lengths of the three spacers in the 5′ to 3′ direction; while the suffix referred to the length of the C‐tracts (“‐3”, “‐4”, “‐5” or “‐6”′ for C3, C4, C5, and C6, respectively). Thus, for example, the sample T124‐3 corresponded to the following DNA sequence: 5′‐CCCTCCCTTCCCTTTTCCC‐3′. An additional set of 75 i‐DNA‐forming sequences was added to evaluate the effects of different spacer lengths and compositions, terminal nucleobases, and non‐equal C‐tracts. The nomenclature of these additional sequences, listed in Table S2, uses the same rationale employed for the previous 180 samples. In particular, a subset of 40 samples was designed to generate sequences characterized by five Cs in each C‐tract and differing for: (i) the length of central spacer, ranging from seven up to fifteen Ts (4 samples); (ii) the presence of adenines in the different positions of the spacers (24 samples); (iii) the length of the first and third spacers (12 samples). A second subset of 35 samples (all variants based on the original sequence “T252‐5”) included: (i) sequences having As, Ts or Gs as flanking nucleobases (9 samples); (ii) sequences with an increasing number of As or Gs in the spacers (20 samples); (iii) sequences with four non‐equally sized C‐tracts (6 samples). Thus, overall, a total of 255 samples was employed. In particular, ultraviolet (UV) and circular dichroism (CD) spectroscopies at different pH and temperature values were used to evaluate the thermal and pH stability of each i‐DNA, as described in the companion paper. [24]
In the present work, we analyze the CD spectral profiles and UV thermal difference spectra (TDS) of these 255 samples by means of multivariate data analysis to detect hidden but potentially informative bands in the spectra of the i‐DNA‐forming sequences. Indeed, to our knowledge, only the well‐known i‐DNA characteristic bands of the CD (positive at 288 and negative at 264 nm) and TDS (positive at 240 and negative at 295 nm) spectra have been considered so far, limiting the informative power of the CD and UV‐absorbance spectroscopies.
Results and Discussion
Considering the large number of spectra to be compared and the very high number of variables (i.e., the intensity at each sampled wavelength) they contain, a plain visual inspection of the TDS and CD spectra may not be sufficient to reveal hidden information in these spectra. However, this huge amount of data can be handled by multivariate data analysis. In particular, the Principal Component Analysis (PCA) is an unsupervised multivariate method that allows the reduction of the dimensionality of a data set, providing a visual representation of the major variance in the data. [25] Particularly, the original variables are transformed into a smaller set of new uncorrelated variables, called principal components (PCs), which are ordered according to the variance they explain (PC1 explains the greatest variance, PC2 contains the second greatest variance, and so on). The principal components are visualized in two plots, termed “scores plot” (where the samples appear close to each other when they are similar, and apart when they are dissimilar) and “loadings plot” (which highlights the variables responsible for the separation of the samples along each PC, in our case the spectral regions). Therefore, this method allows the clustering of the samples based on their similarities and the identification of the spectral regions of the spectra that are characteristic for each cluster. In the following two paragraphs the multivariate data analysis of the CD and TDS spectra is reported.
Circular Dichroism
We decided to first consider the 180 samples, listed in Table S1, characterized by cytosine tracts of equal length and thymine‐based spacers. The characteristic CD profile of an i‐DNA structure having a positive and a negative band, respectively, at 288 and 264 nm, is clearly distinguishable at acidic pH values (Figure S1). The intensity values of each data point of the 180 CD spectra acquired at pH 5.0 were used as variables in a PCA (Figure 2) that produced three meaningful principal components (PCs). Coloring the samples in the PC1/PC2 score plot (Figure 2 A) according to the numbers of Cs in the C‐tract reveals the first information of this analysis. In fact, the samples turn out to be separated along PC1, where those having a higher number of Cs lie on the right side of the plot, and those having shorter C‐tracts lie on the left part. The PC1 loading plot (Figure 2 B) reports the variables mainly responsible for the separation along the first principal component. Interestingly, this loading plot closely resembles the CD spectrum of an i‐DNA structure. This result indicates that samples with longer C‐tracts (that are in the positive region of the PC1) are characterized by more intense CD signals at 288 and 264 nm compared to those having shorter C‐tracts. This is also evident from the superimposition of the 180 CD spectra colored according to C‐tract length (Figure S2). This observation is not surprising since these bands are directly correlated to the number of C:C+ base pairs in the i‐DNA structure.[ 23 , 26 ] Indeed, calculating the Pearson's correlation coefficient r, a very good positive correlation is found between the CD signal intensity at 288 nm and the number of Cs in the C‐tract (r=0.90). Interestingly, if the samples are colored according to the total number of Ts (Figure 2 C), they turn out to be distributed along PC2. Particularly, the samples characterized by higher number of Ts are placed in the top of the score plot, while samples having a lower number of Ts lie in the bottom of the plot. The PC2 loading plot (Figure 2 D) shows that the more Ts are present, the more intense is the signal at 275 nm. This can be explained considering that the CD spectrum of a single‐stranded poly(dT) shows a positive band at 275 nm (Figure S3), thus the more Ts are in the sequence, the higher is the signal intensity at 275 nm, independently from the presence of a secondary structure. Indeed, also in this case, a good correlation coefficient between the signal intensity at 275 nm and the total number of Ts in the spacers is found (r=0.65). Valuable information can also be retrieved by analyzing the PC1/PC3 score plot.
Figure 2.
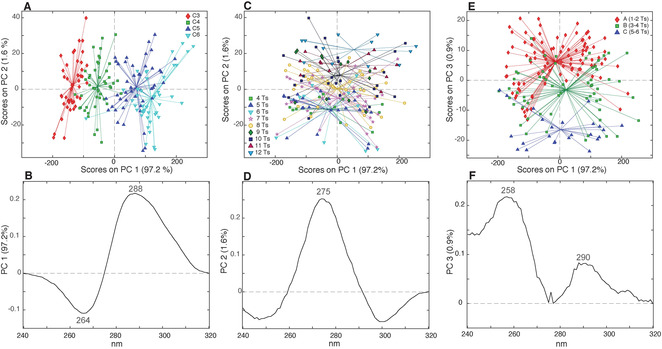
PC1/PC2 score plots of the PCA model calculated using the 180 CD spectra (acquired at pH 5.0) colored according to A) C‐tract length and C) total number of Ts. E) PC1/PC3 score plot colored according to the length of the central spacer. Loading plots of B) PC1, D) PC2, and F) PC3.
Indeed, an interesting trend along PC3 is observed when the samples are colored according to the length of the central spacer. This is particularly evident if the samples are grouped in three classes: “class A” for samples containing 1 or 2 Ts in the central spacer; “class B” for 3 or 4 Ts; and “class C” for 5 or 6 Ts (Figure 2 E). Unfortunately, the PC3 loading plot (Figure 2 F) is difficult to be interpreted, as it is characterized by two positive bands at 258 and 290 nm, apparently not related to any i‐DNA bands or base composition of the DNA. The profile reported in the PC3 loading plot is ascribable to a combination of effects, maybe related, to different extents, to sequence composition and conformational features.
In order to verify this hypothesis, we computed another PCA on samples having the same nucleotide composition, but different residue sequences. By way of example, we show the results obtained by selecting the nine samples having twenty cytosines (five Cs in each C‐tract) and seven Ts (differently distributed in the three spacers) namely T115‐5/T151‐5/T511‐5, T223‐5/T232‐5/T322‐5, T331‐5/T313‐5/T133‐5. In order to improve the reliability of the multivariate analysis, we decided to increase the size of this data set by also including the spectra of the selected samples acquired at pH 5.25 and 5.50, after having carefully checked the irrelevance of the slight pH variation on CD spectra (Figure S4A). Thus, a total of 27 spectra (9 samples, whose CD spectra have been acquired at 3 different pH values) were used to compute a new PCA, and the resulting PC1/PC2 score and loading plot are showed in Figures 3 A and B, respectively. The variance on PC1 was again explained by the bands at 288 nm and 264 nm (Figure S4B), however, in this case, the distribution of the samples is obviously not related to the content of Cs, since all the samples have the same base composition. Most probably, the variance observed in PC1 has to be ascribed simply to an intrinsic uncertainty of the DNA concentration and extinction coefficient values of the samples. On the other hand, the samples turn out to be distributed according to the length of the central spacer along PC2. In this case, the PC2 loading plot (Figure 3 B) appears different from the one obtained in the previous analysis (Figure 2 F). Indeed, the signal intensity at 275 nm seems to carry the information about the central spacer length; in particular, samples with shorter central spacer show more intense CD signal at 275 nm compared to those with longer central spacer. This result confirms that the PC3 loading plot of the analysis performed on all the samples (Figure 2 F) is probably polluted by the information related to the total number of thymines in the sequences that also affects the signal around 275 nm. To shed light on this point, we decided to calculate the correlation coefficients between the CD signal intensity at 275 nm and the central spacer length (r=−0.17). The expected low correlation improves to a value of r=−0.61 when the CD signal intensity at 275 nm is divided by the total number of Ts of each sample. This confirms that the 275 nm wavelength hides both information. Furthermore, the negative sign of the correlation agrees with the PCA outcome, indicating that the longer is the central spacer the less intense is the band at 275 nm.
Figure 3.
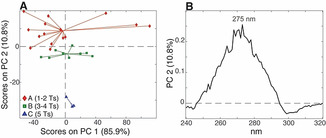
A) PC1/PC2 score plot of the PCA model calculated using the 9 samples, having a total of twenty Cs and seven Ts, acquired at pH 5.00, 5.25, and 5.50 (27 CD spectra in total), colored according to the central spacer length; B) relative PC2 loading plot.
To better understand, in practice, how the chemical composition of the samples and the length of the central spacer affect the CD profile, it is useful to look at the superimposition of CD spectra of some samples having the same C‐tract length and a different number of Ts and samples with the same number of Cs and Ts, but different length of the central spacer. By way of example, the comparison between the CD spectra of T112‐4 and T336‐4, which have the same number of Cs and different number of Ts, is reported in Figure 4 A. The increased intensity around 275 nm, expected for the sample having a higher number of Ts (T336‐4), turns into an overall shift of the spectrum towards shorter wavelengths, while the relative intensities of the two bands at 264 and 288 nm remain basically unchanged. In contrast, the comparison of CD spectra of samples that have the same number of cytosines and thymines, but different length of the central spacers (T116‐5 and T161‐5) (Figure 4 B), shows that the decrement of the intensity of the signal around 275 nm for the sample having the longer central spacer (T161‐5) turns into a general shift of the spectrum towards longer wavelengths.
Figure 4.
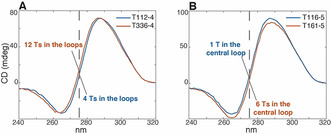
Superimposition of CD spectra of A) samples having the same C‐tract length with different number of Ts (T112‐4 vs. T336‐4), B) samples having the same chemical composition but different central spacer lengths (T116‐4 vs. T161‐4). The dashed line is centered at 275 nm.
Interestingly, in this case, a change in the relative intensities of the bands at 264 and 288 nm is also observable. In order to better visualize this, we decided to normalize each data point of the CD spectra by the intensity of the signal at 264 nm (Figure 5).
Figure 5.
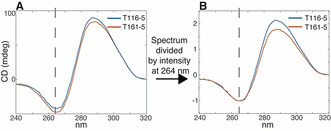
Superimposition of CD spectra of samples having the same chemical composition but with different central spacer length (T116‐5 vs. T161‐5) A) before and B) after dividing the spectra by their intensity value at 264 nm. The dashed line is centered at 264 nm.
This basically provides normalized CD spectra whose bands’ intensities are no more related to the number of Cs or Ts. Such normalization was applied to the 180 CD spectra and the new data set was submitted to a PCA (Figure 6).
Figure 6.

A) PC1/PC2 score plot and relative inset of the PCA model calculated using the 180 CD spectra (normalized by the signal intensity at 264 nm) colored according to the length of the central spacer; B) PC1 loading plot.
As expected, the major variance (PC1) is no more related to the length of the C‐tract, but it is related to the length of the central spacer (Figure 6 A): indeed, samples having 5–6 nucleobases in the central spacer are mainly located in the left part of the plot, while samples having 1 or 2 Ts in their central spacer are placed on the right.
Interestingly, some samples having 1–2 Ts in the central spacer and three Cs in the C‐tracts (T211‐3, T112‐3, T113‐3, T311‐3, T411‐3, T114‐3, T611‐3, T116‐3, T511‐3, T115‐3, T122‐3, T121‐3, T212‐3) do not follow the general trend observed along PC1 (Figure 6 A, inset). The reason of this apparent anomaly may be ascribed to the formation of bimolecular i‐DNA structures, as proposed by Vorlickova's group. [23] Indeed, they observed that reducing the length both of the first and third, or the second and the third spacers, bimolecular i‐DNAs are preferentially formed, and this only happens when the C‐tract is made of three Cs.
As suggested by the PC1 loading plot (Figure 6 B), samples having longer central spacer are characterized by a low intensity ratio between the bands at 288 and 264 nm. The reason of this can be explained taking into account the structural requisites for the formation of an i‐DNA structure. In particular, the central spacer is often responsible for the formation of a loop that spans the major groove of the i‐DNA (see companion paper [24] ) and that this loop requires at least 3 residues. [23] If the central spacer contains a lower number of residues, the i‐DNA structure can be formed in any case using some Cs of the adjacent C‐tracts. In this case, a lower number of C:C+ pairs are formed and the structure will contain some unpaired Cs. Obviously, the CD spectrum of the sample will proportionally contain information about both paired and unpaired Cs in the structure. As already mentioned, the C:C+ base pairs in the stem provide a CD spectrum having a negative and a positive band at 264 and 288 nm, respectively, while cytosines not involved in the pairing are characterized by a CD spectrum having only a positive band centered around 275 nm. [27] As a matter of fact, when both type of Cs contribute to define the general appearance of the CD spectrum, the positive band of the unpaired Cs is summed to the negative band at 264 nm of the paired ones, reducing in this way the intensity of this latter band, while the intensity of the positive band at 288 nm is further increased. Therefore, overall, the relative intensities of the two bands changes proportionally to the number of unpaired Cs in the i‐DNA structure. Hence, the higher is the number of unpaired Cs, the higher is the ratio between the intensity of the bands at 288 and 264 nm.
In order to verify the robustness of these findings, we calculated the ratio between the intensity of the positive band at 288 nm and the intensity of the negative band at 264 nm for all the CD spectra (not normalized) employed in the study. A graphical representation of the calculated values is reported in the bar graph in Figure 7. This bar graph confirms that the higher is the central spacer length, the lower is the intensity ratio regardless of the number of Cs in the stem. The exception to this general “rule” is represented by sequences having very short spacers (T112, T121, T211) and samples having a spacer combination where two spacers are longer than the third one (T221, T212, T122, T331, T313, T133, T332, T323, T332).
Figure 7.
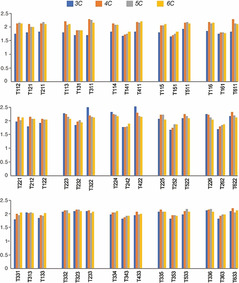
Graphic representation of the maximum (288 nm)/minimum (264 nm) ratio for the 180 CD spectra. Blue, orange, gray, and yellow represent C‐tracts characterized by 3, 4, 5, and 6 Cs, respectively.
In order to evaluate if the findings reported for the first 180 sequences, characterized by equally sized cytosine tracts and thymine‐based spacers, were still valid for a more heterogeneous set of i‐DNA‐forming sequences, we decided to perform multivariate data analyses of the CD spectra of 75 additional sequences divided in two subsets of 40 and 35 samples (Table S2), respectively.
The PCA computed on the subset made of 40 samples (characterized by five Cs in each C‐tract and by different lengths and nucleotide composition of the spacers) generated a score plot where the samples are distributed along PC1 according to the length of the central spacer. In particular, the samples having a very short central spacer are characterized by lower intensities i‐DNA bands around 264 and 288 nm, compared to the samples having a longer spacer, suggesting that a short central spacer is detrimental to the formation of i‐DNA structures (Figures S5 and S6).
However, it should be noted that one sample (“T1151‐5”), characterized by fifteen thymines in the central spacer, is clustered together with the samples having a single nucleotide in this central position. This observation suggests that a particularly long central spacer is also detrimental for the formation of i‐DNA. This is in agreement with the pH and thermal stabilities reported in the companion paper. [24]
Then, the CD spectra of these 40 samples were normalized by the signal intensity at 264 nm (Figure S7) and the resulting spectra were submitted to PCA. As observed for the previously normalized 180 CD spectra, the samples having a longer central spacer are characterized by a lower ratio between the intensity of the bands at 288 and 264 nm. Interestingly, the T1151‐5 sample is now clustered along those having a long central spacer, indicating that in this case, as expected, formation of the central loop involves this very long spacer and does not require the unpairing of C:C+ base pairs (Figure S8). Thus, this additional data set allows to corroborate the fact that, independently from their composition, short and very long central spacers are detrimental for the formation of i‐DNA structures and that, when the central spacer is shorter than three residues, the ratio between the signal intensity at 288 nm and 264 nm increases.
The same analysis has also been performed on the subset made of 35 samples (Figure S9) listed in Table S2. In particular, these samples were analyzed in three subgroups to evaluate the impact on the i‐DNA formation of three main sequence modifications: (i) addition of flanking bases, (ii) increasing number of purines in the spacers and (iii) non‐equal C‐tracts. In particular, the CD spectra of 9 samples having Ts, As, or Gs at the 5′‐ or 3′‐ends (or both) were submitted to PCA. The PC1 loading plot indicates that the samples are distributed according to their propensities to form i‐DNA. In particular, two samples (TT252‐5 and TT252‐5T), both characterized by a thymine at the 5′‐end, turn out to be characterized by higher intensities of the i‐DNA bands at 264 and 288 nm. We speculate that this is due to the formation of a T:T base pair between the thymine at the 5′‐end and one of the thymines present in the central spacer (Figures S10A and S10B). The samples are also distributed along PC2 according to the Gs content (increasing number of Gs from the top to the bottom) and As content (increasing number of As from the bottom to the top) (Figures S10C and S10D). The PC2 loading plot indicates that the more Gs and, in turn, the less As, are in the sequence, the lower is the intensity of the band around 270–280 nm and the higher is the intensity of the band around 250–255 nm (Figure S10E). These spectral regions perfectly agree with the characteristic CD bands of a single‐stranded poly(dG) [27] and a single‐stranded poly(dA). [28] Thus, the PC2 basically explains the contributions of the Gs and As to the i‐DNA CD spectrum. Therefore, the analysis of this first subset of samples suggests that the addition of flanking residues to the i‐DNA forming sequence may have effects on the CD spectrum both for the change in chemical composition of the samples and also for the different propensity of the sample to form an i‐DNA structure, especially for the samples having an additional T at the 5′‐end.
The CD spectra of twenty samples belonging to the second subgroup of samples, which contains an increasing number of As or Gs in the spacers, were also submitted to PCA. From the PC1/PC2 score plot (Figure S11A), we first observed the presence of two outliers (A252‐5 and G252‐5) that bothered the interpretation of the data (see discussion in the Supporting Information, Figure S11). Thus, a new PCA without these two samples was computed. The resulting PC1/PC2 score plot (Figure S12A) shows that samples are distributed according to the number of Gs present in the spacers along PC1. The PC1 loading plot (Figure S12B) reveals that the more Gs are in the spacers, the less intense are the bands around 250–265 nm and 275–300 nm. These bands are wider than those observed for the samples having Gs as flanking sequences (respectively, 250–255 nm and 270–280 nm) and include the wavelength typical of the i‐DNA structure (264 and 288 nm). Therefore, this observation could be explained in two ways: (i) the presence of Gs in the sequence may favor the formation of G:C base pairs at the expense of the number of C:C+ pairs, so that the bands of i‐DNA structure decrease in intensity; (ii) since the presence of Gs in the sequence naturally increases the positive band at around 255 nm and the negative band at 278 nm, [27] these bands are summed to the bands of the i‐DNA structure generating a decrease of their intensities. Instead, we were not able observe a clear contribution of the As (Figure S13). Thus, the analysis of this second subset of samples suggests that the complete substitution of the thymines with purines changes the appearance of the i‐DNA CD spectrum, suggesting the formation of additional DNA secondary structures in solution. Instead, when few thymines are substituted with guanines, the i‐DNA general spectral profile is still observable even though its characteristic bands are less intense compared to the same sequence having only thymine‐based spacers (Figure S14). Also, we found that peculiar bands (255 and 278 nm) are indicative of the content of Gs, in agreement with the observations made for the first subgroup of samples.
Finally, the CD spectra of the last subgroup (six samples) characterized by samples having non‐equally sized C‐tracts (designed to obtain an odd number of C:C+ pairs—Table S2) was also analyzed by PCAs. Interestingly, all observations retrieved from the analysis of the previous 180 samples are perfectly applicable to this sample subset (Figure S15).
The entire data set of CD spectra acquired at pH 7.0 was also analyzed. As discussed in the Supporting Information (Figures S16–S18), the analysis confirmed the absence of i‐DNA structure for the majority of the analyzed samples and revealed the contribution of Cs, Ts, As and Gs to the spectrum. Interestingly, the presence of flanking bases (in particular adenines) seems to induce the i‐DNA structure at neutral pH.
Thermal Difference Spectra (TDS)
The same approach used for CD was employed to study the TDS of the 255 samples investigated in this study. A TDS is calculated by subtracting the UV spectrum of the folded structure, at low temperature, from that of the unfolded structure, at high temperature. The resulting profile is unique and can be used to obtain a specific signature for DNA secondary structures. [29] At pH 5.0, the TDS profiles are in perfect agreement with the typical i‐DNA signature (Figure 8) with a positive peak at 240 nm (used to normalize the spectra) and a negative one at 295 nm. [29] As for CD spectra, we first analyzed the initial set of 180 sequences, characterized by equally sized cytosine tracts and thymine‐based spacers. The PCA computed on the such profiles revealed that the band around 250–265 nm is more intense when there are more Ts in the sequence (Figures 9 A and B) (for a more detailed discussion see the SI and Figures S19 and S20). Moreover, the lower is the C content the higher is the band around 295–310 nm (Figures 9 C and D). Then, as done for the CD analysis, we decided to get rid of the variability related to the different number of Ts. Thus, we generated a data set including only sequences with seven and eight Ts in the spacers, accounting for a total of 72 samples and a new PCA was computed. The resulting PC1/PC2 score plot shows that the sequences with the longest central spacers (5 or 6 Ts) are separated from the rest of the samples along PC2 and that they are characterized by low values of ΔA around 250–265 nm (Figures 10 A and 10B).
Figure 8.
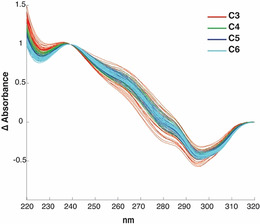
Thermal difference spectra (TDS) of the 180 samples acquired at pH 5.0. The different colors indicate distinct lengths of the C‐tract.
Figure 9.
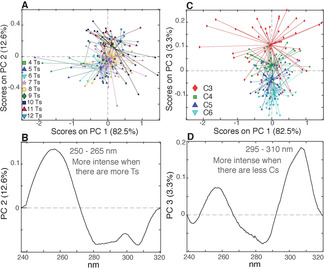
A) PC1/PC2 score plot of the PCA model calculated using the 180 TDS acquired at pH 5.0, colored according to the total number of Ts; B) PC2 loading plot. C) PC1/PC3 score plot colored according to the C‐tract length; D) PC3 loading plot.
Figure 10.
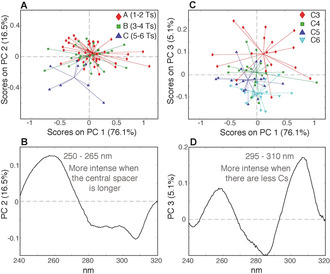
A) PC1/PC2 score plot of the PCA model calculated using the 72 TDS of samples having 7 and 8 Ts (acquired at pH 5.0), colored according to the number of Ts in the central spacer; B) PC2 loading plot. C) PC1/PC3 score plot colored according to the C‐tract length; D) PC3 loading plot.
Thus, once again, as observed in the CD data set, the information about the total number of Ts and central spacer seems hidden under the same wavelength. This observation was also mathematically verified (see Supporting Information). Then, by coloring the samples in the PC1/PC3 score plot according to the C‐tract length (Figure 10 C), it is possible to observe the same trend along PC3 observed considering all the sample (Figure 9 C), thus confirming that samples having longer central spacers are characterized by lower ΔA around 295–310 nm (Figure 10 D). These results can be easily observed comparing the TDS profiles of the samples as showed in Figure 11.
Figure 11.

Superimposition of TDS of samples having A) the same C‐tract length and different number of total Ts, B) the same chemical composition and different length of the central spacer, C) the same spacers compositions and different C‐tract length.
As in the case for CD, the TDS profiles of the 75 additional sequences were analyzed through PCA. As discussed in Supporting Information (Figures S21–S23), all the observations retrieved from the analysis of the 180 samples turned out to be perfectly applicable also to this additional subset of sequences. Unfortunately, no peculiar band could be ascribable to the presence of As or Gs. However, some samples (G252‐5, TT252‐5T, TT252‐5, and 252‐5_A6) turned out to have unprecedented TDS profiles that, for the time being, we are not able to explain.
Conclusion
In this work, multivariate data analysis was used to study the TDS and CD spectral profiles of an unprecedented large selection of i‐DNA forming sequences (255 in total). This analysis reveals the impact of several kinds of sequence modifications on i‐DNA formation and on the entirety of its CD spectral profile. In particular, our findings confirm that, the higher is the number of cytosines in a sequence, the higher its propensity to form i‐DNA. This result is true both for sequences having an even and an odd number of C:C+ base pairs. Moreover, our results corroborate the importance of the length of the central spacer for the i‐DNA structure. Indeed, we observe that both a particularly short (i.e., one base) or long (i.e., fifteen bases) central spacers are detrimental for i‐DNA. Interestingly, the presence of terminal bases (at 5′ and 3′ ends) is not detrimental for the formation of i‐DNA structure. Instead, the presence of a T at the 5′ end seems to favor i‐DNA formation. Moreover, the complete absence of thymines in the spacers (obtained by their substitution with purines) changes the appearance of the i‐DNA CD spectrum, suggesting the formation of additional DNA secondary structures in solution. Instead, a partial substitution of some of the thymines with a few purines still allows i‐DNA formation, even if to a lesser extent compared to the same sequence having only thymine‐based spacers.
Interestingly, a principal component analysis allows to detect other CD bands than those strictly related to the i‐DNA (264 and 288 nm). In particular, we find peculiar informative bands that have never been reported before, related to the presence of thymines, guanines and adenines in the sequences. The intensity of the CD signal intensity at 275 nm is positively correlated with the total number of thymines, while the bands around 250–255 nm and 270–280 nm are indicative of the presence of adenines and guanines in the sequence. Moreover, the band around 275 nm is negatively correlated with the length of the central spacer. Moreover, the ratio of the intensities of the CD signals at 288 and 264 nm is negatively correlated with the length of the central spacer, when shorter than 3 residues.
The analysis of the CD spectra acquired at pH 7.0 confirmed the absence of i‐DNA structure for the majority of the analyzed samples and revealed the contribution of Cs, Ts, As and Gs to spectrum. Interestingly, the presence of flanking bases (in particular adenines) seems to induce the i‐DNA structure at neutral pH.
Furthermore, the multivariate analysis of the TDS data set reveals that the band around 250–265 nm is positively correlated with the total number of Ts, while it is negatively correlated with the length of the central spacer (if divided by the total number of Ts of the sequence). Moreover, the band around 295–310 nm deepens as the number of cytosines in the C‐tracts increases.
Our results demonstrate that CD and TDS are much more informative for these structures than previously believed and that they can be used to retrieve interesting structural information on i‐DNA.
Conflict of interest
The authors declare no conflict of interest.
Supporting information
As a service to our authors and readers, this journal provides supporting information supplied by the authors. Such materials are peer reviewed and may be re‐organized for online delivery, but are not copy‐edited or typeset. Technical support issues arising from supporting information (other than missing files) should be addressed to the authors.
Supplementary
Acknowledgements
This work was supported in part by the Italian Association for Cancer Research AIRC (IG 18695) and by Regione Campania‐POR Campania FESR2014/2020 [B61G18000470007], National Natural Science Foundation of China (21977045), funding from Nanjing University (020514912216), and Fundamental Research Funds for the Central Universities (02051430210).
N. Iaccarino, M. Cheng, D. Qiu, B. Pagano, J. Amato, A. Di Porzio, J. Zhou, A. Randazzo, J.-L. Mergny, Angew. Chem. Int. Ed. 2021, 60, 10295.
References
- 1. Wang G., Vasquez K. M., DNA Repair 2014, 19, 143–151. [DOI] [PMC free article] [PubMed] [Google Scholar]
- 2. Bacolla A., Wells R. D., Mol. Carcinog. 2009, 48, 273–285. [DOI] [PubMed] [Google Scholar]
- 3. van de Sande J., Ramsing N., Germann M., Elhorst W., Kalisch B., von Kitzing E., Pon R., Clegg R., Jovin T., Science 1988, 241, 551–557. [DOI] [PubMed] [Google Scholar]
- 4. Guéron M., Leroy J.-L., Curr. Opin. Struct. Biol. 2000, 10, 326–331. [DOI] [PubMed] [Google Scholar]
- 5. Gajarský M., Živković M. L., Stadlbauer P., Pagano B., Fiala R., Amato J., Tomáška L., Šponer J., Plavec J., Trantírek L., J. Am. Chem. Soc. 2017, 139, 3591–3594. [DOI] [PubMed] [Google Scholar]
- 6. Cerofolini L., Amato J., Giachetti A., Limongelli V., Novellino E., Parrinello M., Fragai M., Randazzo A., Luchinat C., Nucleic Acids Res. 2014, 42, 13393–13404. [DOI] [PMC free article] [PubMed] [Google Scholar]
- 7.
- 7a. Neidle S., Nat. Rev. Chem. 2017, 1, 41; [Google Scholar]
- 7b. Sanchez-Martin V., Lopez-Pujante C., Soriano-Rodriguez M., Garcia-Salcedo J. A., Int. J. Mol. Sci. 2020, 21, 8900. [DOI] [PMC free article] [PubMed] [Google Scholar]
- 8. Gehring K., Leroy J. L., Guéron M., Nature 1993, 363, 561–565. [DOI] [PubMed] [Google Scholar]
- 9. Amato J., Iaccarino N., Randazzo A., Novellino E., Pagano B., ChemMedChem 2014, 9, 2026–2030. [DOI] [PubMed] [Google Scholar]
- 10. Zhou J., Wei C., Jia G., Wang X., Feng Z., Li C., Mol. BioSyst. 2010, 6, 580–586. [DOI] [PubMed] [Google Scholar]
- 11. Rajendran A., Nakano S., Sugimoto N., Chem. Commun. 2010, 46, 1299. [DOI] [PubMed] [Google Scholar]
- 12. Zeraati M., Langley D. B., Schofield P., Moye A. L., Rouet R., Hughes W. E., Bryan T. M., Dinger M. E., Christ D., Nat. Chem. 2018, 10, 631–637. [DOI] [PubMed] [Google Scholar]
- 13. Day H. A., Huguin C., Waller Z. A. E., Chem. Commun. 2013, 49, 7696. [DOI] [PubMed] [Google Scholar]
- 14. Saxena S., Joshi S., Shankaraswamy J., Tyagi S., Kukreti S., Biopolymers 2017, 107, e23018. [DOI] [PubMed] [Google Scholar]
- 15. Day H. A., Pavlou P., Waller Z. A. E., Bioorg. Med. Chem. 2014, 22, 4407–4418. [DOI] [PubMed] [Google Scholar]
- 16. Fernández S., Eritja R., Aviñó A., Jaumot J., Gargallo R., Int. J. Biol. Macromol. 2011, 49, 729–736. [DOI] [PubMed] [Google Scholar]
- 17. Pagano A., Iaccarino N., Abdelhamid M. A. S., Brancaccio D., Garzarella E. U., Di Porzio A., Novellino E., Waller Z. A. E., Pagano B., Amato J., Randazzo A., Front. Chem. 2018, 6, 281. [DOI] [PMC free article] [PubMed] [Google Scholar]
- 18. Bhavsar-Jog Y. P., Van Dornshuld E., Brooks T. A., Tschumper G. S., Wadkins R. M., Biochemistry 2014, 53, 1586–1594. [DOI] [PMC free article] [PubMed] [Google Scholar]
- 19. Zhou J., Jia G., Feng Z., Li C., Chin. J. Chem. 2010, 31, 309–311. [Google Scholar]
- 20. Iaccarino N., Di Porzio A., Amato J., Pagano B., Brancaccio D., Novellino E., Leardi R., Randazzo A., Anal. Bioanal. Chem. 2019, 411, 7473–7479. [DOI] [PubMed] [Google Scholar]
- 21. McKim M., Buxton A., Johnson C., Metz A., Sheardy R. D., J. Phys. Chem. B 2016, 120, 7652–7661. [DOI] [PubMed] [Google Scholar]
- 22. Fleming A. M., Stewart K. M., Eyring G. M., Ball T. E., Burrows C. J., Org. Biomol. Chem. 2018, 16, 4537–4546. [DOI] [PubMed] [Google Scholar]
- 23. Školáková P., Renčiuk D., Palacký J., Krafčík D., Dvořáková Z., Kejnovská I., Bednářová K., Vorlíčková M., Nucleic Acids Res. 2019, 47, 2177–2189. [DOI] [PMC free article] [PubMed] [Google Scholar]
- 24. Cheng M., Qiu D., Tamon L., Maturová E., Víšková P., Amrane S., Guédin A., Chen J., Lacroix L., Ju H., Trantírek L., Sahakyan A. B., Zhou J., Mergny J. L., Angew. Chem. Int. Ed. 2021, 10.1002/anie.202016801; [DOI] [PubMed] [Google Scholar]; Angew. Chem. 2021, 10.1002/ange.202016801. [DOI] [Google Scholar]
- 25.
- 25a. Hotelling H., J. Educ. Psychol. 1933, 24, 417–441; [Google Scholar]
- 25b. Jaumot J., Eritja R., Navea S., Gargallo R., Anal. Chim. Acta 2009, 642, 117–126. [DOI] [PubMed] [Google Scholar]
- 26. Mergny J. L., Lacroix L., Hélène C., Han X., Leroy J. L., J. Am. Chem. Soc. 1995, 117, 8887–8898. [Google Scholar]
- 27. Gray D. M., Bollum F. J., Biopolymers 1974, 13, 2087–2102. [DOI] [PubMed] [Google Scholar]
- 28. Greve J., Maestre M. F., Levin A., Biopolymers 1977, 16, 1489–1504. [DOI] [PubMed] [Google Scholar]
- 29. Mergny J. L., Li J., Lacroix L., Amrane S., Chaires J. B., Nucleic Acids Res. 2005, 33, e138. [DOI] [PMC free article] [PubMed] [Google Scholar]
Associated Data
This section collects any data citations, data availability statements, or supplementary materials included in this article.
Supplementary Materials
As a service to our authors and readers, this journal provides supporting information supplied by the authors. Such materials are peer reviewed and may be re‐organized for online delivery, but are not copy‐edited or typeset. Technical support issues arising from supporting information (other than missing files) should be addressed to the authors.
Supplementary


