

Abstract
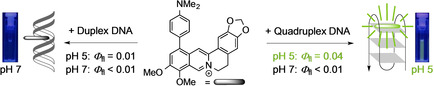
The 9‐ and 12‐dimethylaminophenyl‐substituted berberine derivatives 3 a and 3 b were readily synthesized by Suzuki‐Miyaura reactions and shown to be useful fluorescent probes for the optical detection of quadruplex DNA (G4‐DNA). Their association with the nucleic acids was investigated by spectrometric titrations, CD and LD spectroscopy, and with DNA‐melting analysis. Both ligands bind to duplex DNA by intercalation and to G4‐DNA by terminal π stacking. At neutral conditions, they bind with higher affinity (K b=105−106 M−1) to representative quadruplex forming oligonucleotides 22AG, c‐myc, c‐kit, and a2, than to duplex calf thymus (ct) DNA (K b=5‐7×10⁴ M−1). At pH 5, however, the affinity of 3 a towards G4‐DNA 22AG is higher (K b=1.2×10⁶ M−1), whereas the binding constant towards ct DNA is lower (K b=3.9×10³ M−1) than under neutral conditions. Notably, the association of the ligand with DNA results in characteristic changes of the absorption and emission properties under specific conditions, which may be used for optical DNA detection. Other than the parent berberine, the ligands do not show a noticeable increase of their very low intrinsic emission intensity upon association with DNA at neutral conditions. In contrast, a fluorescence light‐up effect was observed upon association to duplex (Φ fl=0.01) and quadruplex DNA (Φ fl=0.04) at pH 5. This fluorimetric response to G4‐DNA association in combination with the distinct, red‐shifted absorption under these conditions provides a simple and conclusive optical detection of G4‐DNA at lower pH.
Keywords: berberine alkaloids, DNA recognition, fluorescent probes, G4-DNA, nucleic acids
The very weak fluorescence of 4‐dimethylaminophenyl‐substituted berberines only increases significantly if both their conformational flexibility is strongly restricted, i. e. in viscous medium or when bound to quadruplex DNA, and the amino group is protonated at low pH. This requirement of a dual stimulation to cause a light‐up effect enables the spectrometric detection of quadruplex DNA at pH 5.
Introduction
Nucleic acids are key targets in analytical biochemistry and medicine because these biomacromolecules are involved in several biologically relevant processes. [1] Accordingly, the detection and identification of particularly important DNA forms is a challenging task, especially in the diagnosis of diseases and monitoring of their development. [2] For that purpose, fluorimetric methods figure as straightforward and selective tools for DNA detection, because they permit to determine three different physical quantities, namely emission energy, emission quantum yield and emission lifetime, in real time and at relatively low concentration ranges.[ 3 , 4 ] Specifically, fluorescent probes have been shown to be highly efficient chemosensors that allow the sensitive and selective detection of DNA by non‐covalent or covalent attachment of the probe molecule to the target DNA.[ 3 , 5 ] In this context, quadruplex DNA has been identified as a very important analyte, because of its activity in many biological processes, such as transcription regulation[ 6 , 7 ] or telomerase inhibition.[ 7 , 8 ] As a result, fluorescent probes have been developed and employed widely for the selective detection of G4‐DNA structures.[ 9 , 10 , 11 , 12 , 13 , 14 , 15 , 16 , 17 , 18 , 19 ] Such probes usually consist of a G4‐DNA‐binding molecule whose emission properties change upon association to the target G4‐DNA. For an efficient detection, however, either the emission intensity of the otherwise non‐fluorescent ligand has to increase strongly or the emission energy has to shift distinctly. Thus, several organic fluorophores have been introduced that serve this purpose, for example benzimidazole, [9] benzindole, [10] triazine, [11] coumarin, [12] cyanine, [13] pyridinium,[ 14 , 15 ] quinolinium,[ 15 , 16 ] quinolizinium,[ 15 , 17 ] triangulenium [18] and benzothiazole [19] based dyes. Among the promising compound classes for this application are also DNA‐binding natural products with suitable fluorescence properties, because these compounds usually provide sufficient affinity, and often selectivity, towards DNA, along with the required biocompatibility. Along these lines, the berberine alkaloids, especially berberine (1 a), coralyne and their derivatives, have been studied extensively[ 20 , 21 , 22 , 23 ] and developed as selective fluorescent probes for G4‐DNA detection.[ 21 , 24 ] Particularly, berberine (1 a) is a known DNA‐binding alkaloid with antimicrobial, [25] antiviral [26] and anticancer activity, [27] and it has been demonstrated that the substitution with alkyl and arylalkyl substituents leads to an improved affinity and selectivity towards G4‐DNA.[ 24 , 28 ] Most importantly, the parent berberine (1 a) as well as several derivatives thereof have a low emission quantum yield in aqueous solution that increases significantly upon binding to nucleic acids.[ 21 , 24 ] However, in most cases this light‐up effect is merely coincidental and the investigation of the relationship between emission and DNA‐binding properties is often neglected. Therefore, we intended to generate berberine derivatives with structural features that enable a more predictable effect of the DNA‐binding on the emission properties. Specifically, we reasoned that an aminophenyl substituent at the isoquinolinium unit may have a considerable influence on the emission and DNA‐binding properties of the ligand. Firstly, the additional aromatic unit was supposed to provide stronger π stacking with the terminal quartet of the G4‐DNA. Secondly, we have already shown with resembling quinolizinium derivatives that this substituent has the ability to induce strong fluorescence quenching in aqueous solution by torsional relaxation and photoinduced electron or charge transfer on one hand, whereas on the other hand, the suppression of these quenching routes within the DNA binding site leads to an increased emission intensity. [17] In fact, the extent of the latter effect depends strongly on the type of binding site and the resulting torsional angle of the biaryl axis. Ultimately, the electron‐donating effect of the amino group, and for that matter all electron or charge‐transfer processes, can also be suppressed in an acidic environment,[ 17 , 29 ] which may be of interest for the analysis of biological samples with lower pH values, such as cancer cells and biofilms.[ 30 , 31 ] Based on these observations, we focused our attention to the 9‐ and 12‐dimethylaminophenyl‐substituted berberine derivatives 3 a and 3 b (Scheme 1) that should have the desired properties and be readily available with a Suzuki‐Miyaura coupling reaction. Indeed, 12‐aryl‐substiuted berberine derivatives have been synthesized already by Suzuki‐Miyaura cross‐coupling reactions, [32] but studies of the DNA‐binding properties of these products have not been reported, yet. Herein, we present the synthesis of compounds 3 a and 3 b and the investigation of their absorption, emission and DNA‐binding properties. And we demonstrate that these compounds are useful fluorescent probes for the pH‐dependent optical detection of quadruplex DNA.
Scheme 1.
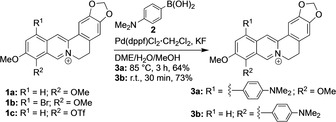
Synthesis of the 4‐(N,N‐dimethylamino)phenyl‐substituted berberine derivatives 3 a and 3 b (dppf=diphenylphosphinoferrocene).
Results
Synthesis
The 4‐(N,N‐dimethylamino)phenyl‐substituted berberine derivatives 3 a and 3 b were synthesized by Pd‐mediated coupling reactions of the known 12‐bromoberberine (1 b) [33] and 9‐O‐triflylberberrubine (1 c) (Scheme 1). The latter was synthesized by the reaction of berberrubine [34] with Tf2O in 70 % overall yield. The Suzuki‐Miyaura reactions of substrates 1 b and 1 c were performed under the optimized reaction conditions established for quinolizinium derivatives [35] with Pd(dppf)Cl2⋅CH2Cl2 as catalyst and KF as additive to give the 4‐(N,N‐dimethylamino)phenyl‐substituted berberine derivatives 3 a (64 %) and 3 b (73 %) in good yields. The structures of the new compounds 1 b, 3 a and 3 b were confirmed and characterized by NMR‐spectroscopic analysis (1H, 13C, COSY, HSQC, HMBC), mass‐spectrometric data and elemental analysis.
Absorption and emission properties
The berberine derivatives 3 a and 3 b exhibit similar absorption properties with band maxima ranging between 341 nm in MeOH and 348 nm in aqueous buffer, along with a shoulder at approximately 440 nm (3 a) or an additional maximum between 432 nm (3 b in BPE buffer) and 488 (3 b in CHCl3) (Figure 1A and B, Table S1). However, the derivative 3 b could not be examined in glycerol and 1‐BuOH due to its low solubility in these solvents. Furthermore, the dependence of the absorption properties of compounds 3 a and 3 b on the pH value of the aqueous solution was examined with a photometric titration (Figure 1C, Figure S2). At pH 2 these derivatives exhibited absorption maxima at 354 nm and 431 nm (3 a) and 346 nm and 418 nm (3 b), along with very weak emission maxima at 552 nm (3 a) and 520 nm (3 b, Figure 1C, Figure S2). With increasing pH, a continuous decrease of the absorption bands as well as a slight decrease of the emission intensity was observed. The analysis of the titration curves according to the Henderson‐Hasselbalch equation [36] (cf. Supporting Information) revealed pK a values of 3.74±0.04 (3 a) and 3.52±0.12 (3 b).
Figure 1.
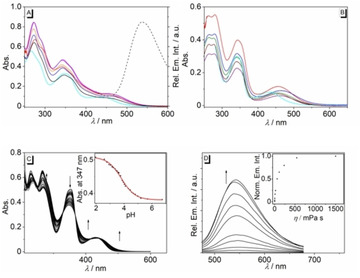
Absorption (A,B solid line, c=20 μM) and emission (dashed line, λ ex=345 nm, c=20 μM, in glycerol) of 3 a (A) and 3 b (B) in different solvents (black: glycerol, cyan: aq. buffer, orange: MeOH, purple: EtOH, blue: 1‐PrOH, magenta: 1‐BuOH, red: DMSO, buffer: 16 mM BPE buffer solution at pH 7). C: Photometric titration of aqueous NaOH solution (2 M) to a solution of 3 a (c=20 μM) in Britton‐Robinson buffer; arrows indicate the development of absorption bands with increasing pH. Inset: Plot of the absorption at 347 nm versus pH of the solution. The red line indicates the fit of the experimental data to the theoretical values of a weak acid. D: Emission spectra of 3 a in water‐glycerol mixtures with different viscosity (c=20 μM, λ ex=345 nm); arrows indicate the changes of the relative emission intensity with increasing glycerol content. Inset: Plot of the emission intensity versus the viscosity of the solution.
Notably, the emission intensity of the derivatives 3 a and 3 b is very weak, so that these compounds gave no meaningful emission bands. As the only exception, an emission band developed at 542 nm for derivative 3 a in glycerol solution, but still with a low emission quantum yield, Φ fl=0.04 (Figure 1D). At the same time, in basic glycerol solution, compound 3 b was essentially non‐fluorescent, whereas an increased emission intensity (Φ fl=0.11) was observed in acidic solution (Figure S1).
Spectrometric DNA titrations
The changes of the absorption and emission properties of derivatives 3 a and 3 b upon addition of double‐stranded calf thymus (ct) DNA and quadruplex‐forming oligonucleotides d[A(T2AG3)3G3] (22AG), d[AG3AG3CGCTG3AG2AG3] (c‐kit), d[TGA(G3TG3TA)2] (c‐myc), and d[(ACAG3TGT)2] (a2) were followed by photometric and fluorimetric titrations. G4‐DNA titrations were performed in K+‐containing buffer solutions, that are required to stabilize the quadruplex structures. To investigate the binding properties of the protonated derivative 3 a with DNA, titrations with 22AG and ct DNA were performed in acetate buffer at pH 5, i. e. conditions at which the DNA structure is still essentially the same as in neutral solution. [37] Except for ct DNA titrations at pH 5, a decrease of the absorption bands at 347 nm and 437 nm (3 a) or 342 nm and 432 nm (3 b) was observed during the titration, along with a significant red shift of the respective maxima (Figure 2, Figure S3). Notably, the red shift of the long‐wavelength absorption maximum of derivative 3 a in the presence of G4‐DNA 22AG (Δλ=42 nm) was significantly more pronounced than those observed during titration of DNA to ligands 3 a or 3 b (Δλ=24‐32 nm). As a result, the color change of solutions of 3 a on addition of 22AG can be followed even by the naked eye (Figure S4). In contrast, during the titration of 3 a with ct DNA at pH 5 only a very small decrease and broadening of the absorption maxima at 348 nm and 431 nm without a significant red shift were observed.
Figure 2.
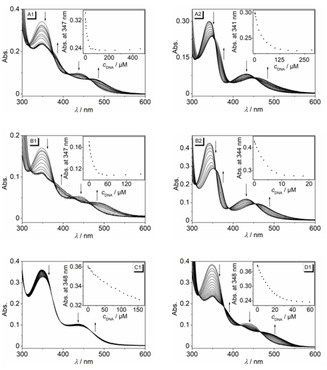
Photometric titration of 3 a (1) and 3 b (2) (c Ligand=20 μM) with ct DNA (A) in BPE buffer (c Na+=16 mM, pH 7.0, with 5 % v/v DMSO), with 22AG (B) in K‐phosphate buffer (c K+=110 mM, pH 7.0, with 5 % v/v DMSO) as well as with ct DNA (C) and with 22AG (D) in acetate buffer (c K+=110 mM, pH 5.0, with 5 % v/v DMSO). The arrows indicate the changes of absorption upon addition of DNA. Inset: Plot of absorbance versus c DNA (c ct DNA in base pairs, c G4‐DNA in oligonucleotide).
The isotherms resulting from the photometric titrations were used to calculate the corresponding binding constants K b (Table 1, Table S2 Figure S6). [38] Notably, both derivatives 3 a and 3 b have a high affinity towards G4‐DNA (3 a: K b=7.0−7.9×10⁵ M−1, 3 b: K b=7.5−11×105 M−1) that is about an order of magnitude larger than the one with ct DNA (3 a: K b=5.4×10⁴ M−1, 3 b: K b=6.9×10⁴ M−1). At the same time, the binding constant of 3 a towards 22AG was even larger at pH 5 (K b=1.2×10⁶ M−1), whereas the association with ct DNA was weaker under these conditions (K b=3.9×10³ M−1).
Table 1.
DNA‐Binding Properties K b and ΔT m of 1 a, 3 a and 3 b from Photometric DNA Titrations and Thermal DNA Denaturation Experiments.
|
|
3 a |
|
3 a |
3 b |
3 b |
1 a |
|---|---|---|---|---|---|---|
|
|
K b/M−1[b] |
ΔT m/°C[c] |
K b/M−1[b] |
ΔT m/°C[c] |
ΔT m/°C[c] |
|
|
ct DNA |
5.4×10⁴ 3.9×10³ (pH 5) |
|
6.9×10⁴ |
|
|
|
|
22AG |
6.8×10⁵ 1.2×10⁶ (pH 5) |
|
9.2×10⁵ |
|
|
|
|
F21T [a] |
|
10.8 |
|
4.0 |
2.8 |
|
|
c‐kit |
7.7×10⁵ |
|
8.5×10⁵ |
|
|
|
|
FkitT [a] |
|
6.1 |
|
4.7 |
2.5 |
|
|
a2 |
7.5×10⁵ |
|
8.2×10⁵ |
|
|
|
|
Fa2T [a] |
|
1.5 |
|
1.3 |
0.9 |
|
|
c‐myc |
7.9×10⁵ |
|
1.1×10⁶ |
|
|
|
|
FmycT [a] |
|
3.6 |
|
1.4 |
0.6 |
|
[a] G4‐DNA for the determination of ΔT m: F21T=fluo‐G3(TTAG3)3‐tamra, Fa2T=fluo‐(ACAG3TGT)2‐tamra, FmycT=fluo‐TGAG3TG3TAG3TG3TA‐tamra, FkitT=fluo‐AG3AG3CGCTG3AG2AG3‐tamra, fluo=fluorescein, tamra=tetramethylrhodamine. [b] Determined from photometric titrations (cf. Figure 2). [c] Determined from fluorimetric analysis of dye‐labeled oligonucleotides, LDR=5; c DNA=0.2 mM (in oligonucleotide); KCl‐LiCl‐cacodylate buffer cK+=10 mM, cNa+=10 mM, cLi+=90 mM, pH 7.0); λ ex=470 nm; λ em=515 nm; estimated error: ±0.5 °C.
CD and LD spectroscopy
The complexes of the ligands 3 a and 3 b with DNA were further examined with circular dichroism (CD) and flow linear dichroism (LD) spectroscopy. When bound to ct DNA, both ligands developed positive induced CD (ICD) signals at 388 nm (3 a) and 355 nm (3 b), alongside with an increase of the CD signal of the DNA at 278 nm. At the same time, the intensity of the negative LD band of DNA at 258 nm increased at a ligand‐DNA ratio (LDR) of 0–0.2 followed by a slight decrease of the intensity at LDR=0.5. Furthermore, negative LD bands were observed in the absorption range of the bound ligands with peaks at 349 nm and 472 nm (3 a) and 351 nm and 456 nm (3 b). Additionally, CD spectra were recorded at pH 5. Under these conditions, ct DNA has essentially the same CD spectrum as the one at pH 7. Upon addition of 3 a the CD signal of the DNA at 278 nm fluctuated with increasing concentration of 3 a, whereas only a very weak positive ICD band developed at 430 nm, which was significantly lower in intensity as compared to the one obtained at neutral pH under otherwise identical conditions (Figure 3).
Figure 3.
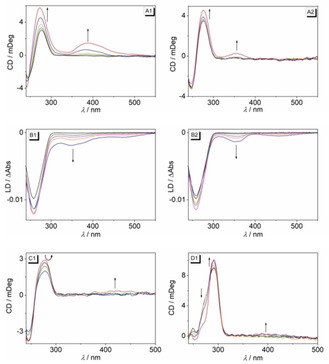
CD (A,C,D) and LD spectra (B) of ct DNA (A,B,C) or 22AG (D) in the absence and presence of 3 a (1) and 3 b (2) in BPE buffer solution (A,B; 10 mM, pH 7.0; with 5 % v/v DMSO) or in acetate buffer (C1, D1, 10 mM, pH 5.0; with 5 % v/v DMSO) [LDR=0 (black), 0.05 (green), 0.1 ( 0.2 (orange), 0.5 (blue), 1.0 (red)] The arrows indicate the changes of absorption upon addition of DNA.
After addition of compounds 3 a and 3 b to solutions of G4‐DNA 22AG an increase of the characteristic CD band of 22AG at 290 nm was observed and the shoulder at 255 nm steadily disappeared (Figure S9). The same effect was observed on titration of ligand 3 a to 22AG at pH 5 (Figure 3). On complexation of the ligands 3 a and 3 b to G4‐DNA a2 the CD band of the DNA at 265 nm fractionally increased, whereas the weaker band at 290 nm changed just slightly. The ligands 3 a and 3 b did not exhibit ICD signals in the absorption range of the ligands when bound to G4‐DNA, however, as an exception a weak ICD band of 3 a bound to 22AG was observed at pH 5.
Thermal DNA denaturation
The binding properties of derivatives 3 a, 3 b and of berberine (1 a) with G4‐DNA were further studied by thermal DNA‐denaturation experiments. For that purpose, the influence of the ligands on the thermally induced unfolding of the dye‐labeled quadruplex‐forming oligonucleotides F21T, Fa2T, FmycT, and FkitT was determined (Table 1, Figure S7, Figure S8). [39] Thus, the derivative 3 a induced a significant stabilization of the quadruplex forms of F21T and FkitT as indicated by the increased melting temperatures T m (FkitT: ΔT m=6.1, F21T: ΔT m=10.8 °C, at LDR=5), whereas the melting temperatures of Fa2T and FmycT were only marginally affected by the presence of 3 a (Fa2T: ΔT m=1.5 °C, FmycT: ΔT m=3.6 °C). At the same time, the complexation of derivatives 1 a and 3 b only induced small (F21T: 1 a: ΔT m=2.8 °C, 3 b: ΔT m=4.0 °C, FkitT: 1 a: ΔT m=2.5 °C, 3 b: ΔT m=4.7 °C) or very small shifts (FmycT: 1 a: ΔT m=0.6 °C, 3 b: ΔT m=1.0 °C, Fa2T: 1 a: ΔT m=0.9 °C, 3 b: ΔT m=1.3 °C) of the quadruplex melting temperatures.
Fluorimetric DNA titrations
The addition of G4‐DNA 22AG to 3 a and 3 b did not lead to a clear increase of the emission intensity, i. e. no meaningful fluorescence bands were detected. Nevertheless, during fluorimetric titration of ct DNA to the ligands 3 a and 3 b a slight, but significant continuous development of emission bands at 537 nm (3 a) and 530 nm (3 b) was observed at neutral conditions (Figure S5). However, the fluorescence quantum yields still remained very low (Φ fl<0.01). In contrast, a stronger light‐up effect of the emission of 3 a was observed upon addition of ct DNA and 22AG at pH 5 (Figure 4), which was more pronounced with 22AG (Φ fl=0.04) than with ct DNA (Φ fl=0.01). Most notably, these two different effects of ct DNA and 22AG on the emission intensity of 3 a at pH 5, specifically the stronger light‐up effect induced by 22AG, could be detected even in mixtures of both DNA forms (Figure 4D). Hence, it was observed that the addition of 22AG to a mixture of ct DNA and 3 a led to a clear increase of the emission intensity, which, however, was lower than the one observed upon addition of 22AG to a pure solution of 3 a. In contrast, nearly no change of emission intensity was observed on titration of ct DNA to a solution of 3 a and 22AG.
Figure 4.
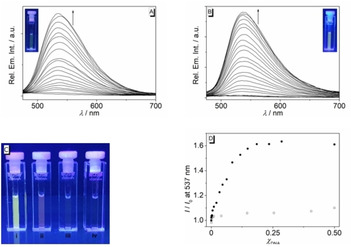
Fluorimetric titration of 3 a (c=20 μM, λ ex=370 nm) with ct DNA (A) and with 22AG (B) in acetate buffer (c K+=110 mM, pH 5.0, with 5 % v/v DMSO). The arrows indicate the development of emission bands upon addition of DNA. Inset: Pictures of the emission color after addition of DNA. C: Pictures of the emission color of ligand 3 a in the presence of 22AG at pH 5 (i), 22AG at pH 7 (ii), ct DNA at pH 7 (iii) and pH 5 (iv) (λ ex=360 nm). D: Plot of the relative fluorescence intensity versus molar fraction Х DNA of 3 a (5 μM) as obtained from the addition of 22AG to a mixture of ct DNA (50 μM) with 3 a (circles, Х 22AG), or the addition of ct DNA to a mixture of 22AG (50 μM) with 3 a (squares, Х ct‐DNA) in acetate buffer (c K+=110 mM, pH 5.0, with 5 % v/v DMSO).
Discussion
Absorption and emission properties
The absorption properties of both derivatives 3 a and 3 b resemble essentially the ones of the parent berberine (1 a) [40] and only change marginally in different solvents with no obvious relationship with the common solvent parameters, such as polarity, polarizability, H‐bonding, etc. [41] Notably, a red‐shifted absorption, that might have been expected due to a donor‐acceptor interplay [35] between the aniline and isoquinolinium unit, was not observed. Similar observations have been made in biaryl‐type donor‐substituted pyridinium derivatives, whose long‐wavelength absorption maximum is steadily blue‐shifted with increasing torsion angle between donor and acceptor. [42] Therefore, it is assumed that the biaryl axis between the aniline and berberine units has a large torsion angle close to 90° in the ground state, which leads at least to a partial decoupling of the aniline substituent from the berberine chromophore. This assumption was supported by TD‐DFT calculations of derivative 3 a (cf. Supporting Information, Figure S11).
The emission quantum yields of compounds 3 a and 3 b are very low, i. e. essentially not detectable, in organic solvents and only increase slightly in media with higher viscosity (Figure 1D, Figure S1). This increase of emission intensity in solutions with restricted free volume indicates that the fluorescence of 3 a and 3 b in less viscous solvents is quenched at least partially by conformational changes in the excited state. In contrast, the fluorescence of the parent berberine (1 a) does not show such a significant dependence on viscosity. [40] Notably, the double‐logarithmic plot of the fluorescence intensity of derivative 3 a versus the specific viscosity of the medium, as obtained in glycerol‐water mixtures with different glycerol content, is almost linearly ascending (Figure S1B), which suggests that the fluorescence is quenched by rotation of the aryl substituent (Figure 5, B). [43] Nevertheless, the slope of the linear regression curve (k=0.51) is smaller than the theoretically predicted one (k=2/3) for an almost exclusive quenching by torsional relaxation. [43] This observation indicates that additional deactivation pathways operate in the excited state of 3 b (Figure 5; A and C). Most likely, the emission is also quenched by a photoinduced electron transfer (PET) from the aniline substituent to the berberine chromophore (Figure 5, A), as has been frequently observed with resembling biaryl‐type quinolizinium derivatives.[ 35 , 44 ] This assumption was confirmed by the increased emission intensity in acidic glycerol solutions (Φ fl=0.11), because at low pH the electron‐donating aniline unit is protonated and, as a result, the PET is suppressed. In addition, the fluorescence of 3 a may be quenched also by an intramolecular charge transfer (ICT) from the benzodioxole unit to the isoquinolinium, which has been proposed for the parent berberine. [45]
Figure 5.
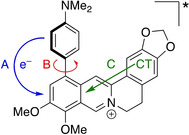
Deactivation pathways of the excited berberine derivative 3 a. A: Photoinduced electron transfer (PET). B: Torsional relaxation. C: Internal charge transfer (CT).
DNA‐binding properties
The photometric, fluorimetric and polarimetric titrations revealed that derivatives 3 a and 3 b bind with a high affinity to duplex (5−7×10⁴ M−1) and quadruplex DNA (105−106 M−1) at pH 7, as also indicated by the characteristic changes of the absorption and CD spectra upon formation of the ligand‐DNA complexes. [46] It should be noted, however, that in some cases the absence of isosbestic points during the photometric titrations indicated a more complex binding situation, namely different binding modes depending on the LDR. In addition, the affinity of 3 a towards 22AG increased slightly at pH 5 (Table 1). Under these conditions the ligand may be already mainly protonated because the pK a increases at the higher ionic strength of the acetate buffer (cf. Supporting Information, Figure S2). [47] In addition, the protonated, double cationic 3 a‐H+ has presumably a higher affinity to the G4‐DNA because of the stronger electrostatic interactions with the negative DNA phosphate backbone and the resulting additional counter ion release, [48] which in turn shifts the acid‐base equilibrium accordingly. Such a shift of pK a values of ligands in the presence of DNA due to the formation of the more favorable DNA‐binding component is well known.[ 47 , 49 ] In contrast, the affinity of 3 a towards ct DNA was lower at pH 5 (Table 1), and the photometric titrations did not even result in the characteristic strong hypochromic and bathochromic shifts of a DNA intercalator, [46] which excludes this particular binding mode. The compound 3 a also does not have the typical structural features of a groove binder, so that it possibly just forms aggregates along the DNA backbone under these particular conditions.
For the association with G4‐DNA, the binding constants of 3 a and 3 b (Table 1) are higher than the ones of the parent berberine (1 a) (K b=4.5×10⁵ M−1[22]), whereas their affinity to ct DNA is even a bit lower (1 a: K b=9.7×10⁴ M−1 [50] ). Obviously, the additional aniline unit increases the overall binding energy with the G4‐DNA, e. g. by enhanced π‐stacking overlap (see below), [51] whereas it slightly destabilizes the complex with duplex DNA, presumably due to repulsive steric interactions in the smaller intercalation binding pocket.
In general, the compounds 3 a and 3 b stabilize G4‐DNA towards unfolding as quantified by the induced shifts of the melting temperatures, ΔT m; however, the four employed quadruplex forms are stabilized to different extent by the ligands, with the strongest effect observed with 3 a and 22AG and only a marginal influence of both ligands on a2. The stabilization of 22AG by ligand 3 a was larger than the one of berberine (1 a) under the same conditions (Table 1). However, the shifts of melting temperature by compound 3 b resembled the ones of berberine (1 a), which apparently contradicts the high binding constants of ligand 3 b. By the same token, the series of ΔT m values of the respective ligand‐DNA complexes do not correlate reasonably with their binding constants (Table 1). We have observed a similar discrepancy with other berberine derivatives [21a] and proposed that this lack of correlation between K b and ΔT m values results from the different methods and the distinct physical quantities that are determined. Hence, the binding constant, Kb, describes the equilibrium between free and quadruplex‐bound ligand, whereas the melting temperature, T m, and its shift in the presence of the ligand, ΔT m, characterize the equilibrium between quadruplex and unfolded single strand along with the influence of the ligand, respectively. And as the binding constants K b are usually determined at lower temperature than T m, a missing correlation between these physical quantities likely indicates that the affinity of the ligand to the DNA is different at higher temperatures. In the case of 3 a and 3 b, the binding constants of each ligand with the four tested quadruplex forms are essentially the same (with exception of the complex of 3 b with c‐myc), whereas both ligands induce a larger ΔT m value of F21T and FkitT than with a2 and c‐myc (Table 1). Apparently, the complexes of the ligands with the latter quadruplex forms are more sensitive towards higher temperatures leading to lower affinity and less stabilization at the melting temperature.
The binding mode of 3 a and 3 b with ct DNA was identified with the CD‐ and LD‐spectroscopic analyses. [52] In particular, the negative LD bands in the absorption range of the ligands are evidence for an intercalative binding mode, as they result from a coplanar arrangement of the aromatic plane of the ligand relative to the DNA bases. [52] Furthermore, the LDr value, i. e. the wavelength‐dependent reduced LD, was calculated and used to determine the angle α between the DNA helix and the corresponding transition dipole of the ligand (cf. Supporting Information). The resulting values of α=90° (3 a) and α=73° (3 b) are in agreement with the proposed intercalation of these ligands. [52] In addition, the ICD signals in the absorption range of the ligands confirmed the binding process and may also be used to deduce the relative orientation of the ligand in the binding pocket. [52] Specifically, the positive ICD bands of 3 a and 3 b result from an almost perpendicular orientation of the transition dipole moment of the ligand to the one of the DNA base pairs, with the latter being aligned along their long molecular axis. However, the ligands 3 a and 3 b give positive ICD signals only in the range of particular absorption bands, whereas especially the long‐wavelength transition gives only a very weak or no ICD band at all. For comparison, the parent berberine (1 a) gives essentially no ICD signal in the absorption range of the ligand under similar conditions (LDR=0.8). [53] To clarify this aspect, the relevant transition dipole moments of 3 a were determined exemplarily by TD‐DFT calculations [54] and shown to be aligned parallel or slightly tilted along the long molecular axis of the isoquinolinium unit (Table S4, Figure S11) like it was already determined for the parent berberine (1 a). [45] Within this model, the positive ICD bands are likely the result of a roughly perpendicular orientation of the long molecular axis to the longitudinal axis of the DNA base pairs, with the sterically more demanding isoquinolinium unit protruding into the groove (Figure 6). To add to that, the CD‐spectroscopic analysis also confirmed the relatively weak interaction of 3 a with ct DNA at pH 5 (see above), as only a very weak positive ICD signal at 430 nm was formed even at LDR=1.
Figure 6.
Manually docked model of the complex between 3 a and DNA. The structure of the DNA was taken from the ellipticine‐DNA complex (DOI: https://www.rcsb.org/structure/1z3 f). The ellipticine ligands were removed from the intercalation sites and, in one case, substituted with 3 a (without energy minimization). The model was assembled and visualized with the UCSFChimera software (http://www.cgl.ucsf.edu/chimera/).
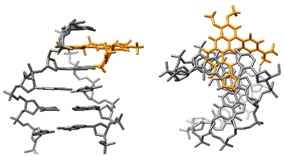
The CD‐spectroscopic analysis of complexes of G4‐DNA 22AG with ligands 3 a and 3 b revealed a distinct decrease of the shoulder around 270 nm, which is usually interpreted as the disappearance of the (3+1) conformer, to which this band is assigned. [55] In solution, the G4‐DNA 22AG exists mainly as equilibrium of the (3+1) conformer and the basket‐type antiparallel quadruplex structure, which are easily distinguished by CD spectroscopy because the latter is characterized by the strong positive band at 295 nm and a weak negative one at 260 nm. [56] Thus, the maintenance of these bands and the disappearance of the CD band of the (3+1) conformer indicate a shift of the equilibrium to the basket‐type quadruplex because of the stronger binding of 3 a to this structure. This effect was observed for derivative 3 a at both pH 7 and 5, so that a similar binding mode is assumed under these conditions. In contrast, the marginal changes of the CD spectra on complexation of the ligands 3 a and 3 b to G4‐DNA a2 revealed that the structure or mixture of conformers of this oligonucleotide [13b] was not essentially affected by the ligands. Most notably, the ligands 3 a and 3 b did not exhibit ICD signals in the absorption range of the ligands when bound to G4‐DNA, which is usually interpreted as indication of terminal π‐stacking as binding mode [57] whereas strong ICD signals indicate groove binding as main binding mode. [58] However, the cooperative association of two molecules on this binding site, that has been observed for the parent berberine (1 a), [58] is unlikely in the case of 3 a and 3 b because of the steric repulsion between the ligands in such a binding mode. In turn, the comparison with the reported binding mode of a 13‐substituted berberine derivative, [33] which has a similar spatial expansion as 3 a, suggests that the latter may be similarly centered on top of a terminal quartet (Figure 7). However, for such a binding mode the aniline substituent has to twist significantly and adapt a smaller torsion angle with the berberine unit to avoid unfavorable steric interactions.
Figure 7.
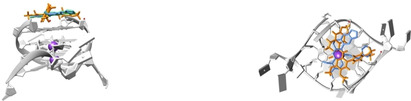
Manually docked superposition (without energy minimization) of 3 a (gold) with the authentic ligand (blue) in a known G4‐DNA‐berberine complex (ref. [33], DOI: https://www.rcsb.org/structure/5cdb). The model was assembled and visualized with the UCSFChimera software (http://www.cgl.ucsf.edu/chimera/).
In contrast to the parent berberine (1 a), [23] the aminoaryl‐substituted derivatives 3 a and 3 b do not develop a significant emission when bound to duplex or quadruplex DNA at pH 7, whereas at pH 5 the emission increases to more extent, especially in the presence of G4‐DNA 22AG; however, still resulting in low emission quantum yields. As we have demonstrated that the strongest fluorescent light‐up effect only takes place at both restricted conformational flexibility of the molecule and low pH of the medium (Figure 4), we deduce that these two conditions are only sufficiently met when the ligand 3 a binds to 22AG at pH 5. Hence, the torsional relaxation is suppressed in the constrained binding site whereas the PET is prohibited by protonation of the amino functionality (Figure 5). Presumably, the emission enhancement is further supported by the smaller torsional angle of the biaryl unit, that is required for terminal π stacking (see above). This proposal is in agreement with the properties of resembling biaryl‐type pyridinium derivatives whose fluorescence quantum yields also increase with decreasing torsion angle. [42] The observation that the ligand does not develop a clear emission band within the sterically restricted binding sites in ct DNA and 22AG at pH 7 is explained by a still operating PET under these conditions. When bound to ct DNA, however, torsional relaxation is still possible in ligand 3 a (see above) and the emission intensity remains low with this DNA form, even at lower pH. To add to that, the latter negligible effect is also caused by the lower binding affinity and different binding mode to ct DNA under these conditions (Table 1).
Overall, it was shown that three factors have a significant and interactive influence on the emission and absorption properties of compounds 3 a and 3 b, namely their basicity, the deactivation pathways in the excited state, and the different DNA‐binding modes. In turn, these properties enable the spectrometric detection and differentiation of two different DNA forms, as clearly shown by the distinctly different absorption and emission properties of ligand 3 a when associated with ct DNA and 22AG at different pH values. Specifically, this ligand can be used as an AND logic gate for the simultaneous fluorimetric detection of low pH and quadruplex DNA in the medium, even in the presence of duplex DNA. And although the relatively small differences of the emission intensity of duplex‐ and quadruplex‐bound ligand may not be useful for an unambiguous or sufficiently sensitive detection, the combination of the absorption and emission data at pH 5 significantly increases the certainty of the analysis. Thus, a 3D plot of the data from photometric and fluorimetric DNA titrations results in a “calibration” curve that is obviously distinctly different for ct DNA and G4‐DNA 22AG (Figure 8).
Figure 8.
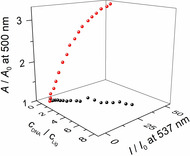
Three‐dimensional plot of the fluorescence intensity (λ ex=370 nm) and absorbance (λ=420 nm) of 3 a versus the DNA‐ligand ratio with ct DNA (squares) and 22AG (circles) at pH 5.
Conclusion
In summary, we synthesized two novel berberine derivatives 3 a and 3 b that bind with high affinity to G4‐DNA and induce a significant thermal stabilization of 22AG and c‐kit. Most notably, the ligand 3 a binds with higher affinity towards 22AG at pH 5 as compared with neutral conditions. Other than the parent berberine (1 a), the derivatives 3 a and 3 b do not show a noticeable increase of emission intensity upon association with DNA at neutral conditions, whereas at pH 5 a fluorescence light‐up effect of the DNA‐bound ligand 3 a was observed. Noteworthy, at these conditions, G4‐DNA can be detected fluorimetrically even in mixtures of both DNA forms. Equally important, the fluorimetric response of 3 a to G4‐DNA association combined with the pronounced and distinct, red‐shifted absorption under these conditions provides a simple and conclusive optical detection of G4‐DNA at lower pH, ideally even with the naked eye. Furthermore, this fluorescent probe allows the simultaneous detection of G4‐DNA and lower pH values, i. e. it only lights up when both criteria are met. This property may be applied for the selective fluorimetric detection of G4‐DNA in cancer cells, which often provide a medium with slightly lower pH than healthy cells. [30] Moreover, this chemosensor and derivatives thereof have the potential to be applied for the fluorimetric detection of pH gradients and extracellular nucleic acids in biofilms, [31] that have been suggested just recently to contain G4‐DNA as functional component. [60] Although numerous fluorescent probes for G4‐DNA are known,[ 9 , 10 , 11 , 12 , 13 , 14 , 15 , 16 , 17 , 18 , 19 ] to the best of our knowledge, no examples have been reported so far with these particular features. Namely, only a few fluorescent probes for G4‐DNA have been reported that operate at lower pH, [61] but these probes do not exhibit the dual‐mode response of compound 3 a. In conclusion, the derivatives 3 a and 3 b provide a promising starting point for the development of selective DNA‐targeting fluorescent probes that combine the favorable biological properties of berberine with tailor‐made, medium sensitive photophysical properties.
Experimental Section
Equipment: Absorption spectra: Varian Cary 100 Bio Spectrophotometer with baseline correction. Emission spectra: Varian Cary Eclipse spectrophotometer at 20 °C: Cuvettes: Quartz cells (10 mm×4 mm). NMR spectra: Jeol ECZ 500 (1H: 500 MHz, 13C: 125 MHz) at 25 °C; Varian VNMR−S 600 (1H: 600 MHz, 13C: 125 MHz) at 25 °C (DMSO‐d 6). NMR spectra were processed with the software MestReNova and referenced to the solvent DMSO‐d 6 (1H: δ=2.50, 13C: δ=39.5). Elemental analyses data: HEKAtech EUROEA combustion analyzer, by Rochus Breuer, Organische Chemie I, Universität Siegen, and HEKAtech Analysenservice, HEKAtech GmbH, Wegberg. Mass spectra (ESI): Finnigan LCQ Deca (U=6 kV; working gas: Ar; auxiliary gas: N2; temperature of the capillary: 200 °C). Circular‐dichroism (CD) and flow‐linear‐dichroism (LD) spectra: Chirascan CD spectrometer, Applied Photophysics. For LD spectra: High Shear Cuvette Cell Accessory (Applied Photophysics). The LD samples were recorded in a rotating cuvette with a shear gradient of 1200 s−1. Melting points (uncorrected): BÜCHI 545 (BÜCHI, Flawil, CH).
Materials: 4‐(N,N‐Dimethylamino)phenylboronic acid (2), [62] berberrubine, [63] and 12‐bromoberberine bromide (1 a) [33] were synthesized according to published procedures. Calf thymus DNA (ct DNA, type I; highly polymerized sodium salt; ϵ=12824 cm−1M−1) [64] was purchased from Sigma‐Aldrich (St. Louis, USA) and used without further purification. Oligodeoxyribonucleotides (HPLC purified) d[A(G3TTA)3G3] (22AG), d[(ACAG4TGTG4)2] (a2), d[TGAG3TG3TAG3TG3TA] (cmyc), d[(AG3AG3CGCTG3AG2AG3)] (ckit), d[fluo‐(GGGTAA)3G3‐tamra] (F21T), d[fluo‐(ACAG4TGTG4)2‐tamra] (Fa2T), d[fluo‐TGAG3TG3TAG3TG3TA‐tamra] (FmycT) and d[fluo‐(AG3AG3CGCTG3AG2AG3)‐tamra] (FkitT) (fluo=fluorescein, tamra=tetramethylrhodamine) were purchased from Metabion Int. AG (Planegg/Martinsried). The concentration of ct DNA is given in base pairs (bp).
The ct DNA was dissolved in BPE buffer solution. Solutions of oligonucleotides were prepared in K‐phosphate buffer, heated to 95 °C for 5 min and cooled slowly to room temperature within 4 h. K‐phosphate buffer: 25 mM K2HPO4, 70 mM KCl; adjusted with 50 mM KH2PO4 to pH 7.0; BPE (biphosphate EDTA) buffer: 6.0 mM Na2HPO4, 2.0 mM NaH2PO4, 1.0 mM Na2EDTA; pH 7.0. All buffer solutions were prepared from purified water (resistivity 18 MΩ cm) and biochemistry‐grade chemicals. The buffer solutions were filtered through a PVDF membrane filter (pore size 0.45 μm) prior to use.
Synthesis
10‐Methoxy‐9‐(((trifluoromethyl)sulfonyl)oxy)‐5,6‐dihydro‐[1,3]dioxolo[4,5‐g]isoquinolino[3,2‐a]isoquinolin‐7‐ium tetrafluoroborate (1 c): A solution of freshly prepared berberrubine (321 mg, 1.00 mmol) in CH2Cl2 (30 ml) was cooled to 0 °C, and Tf2O (210 μl, 338 mg, 1.20 mmol) was added. The reaction mixture was stirred for 2 h at r.t. and the yellow precipitate was filtered and washed with CH2Cl2 (10 ml with 3 droplets Et3N) and Et2O (2×30 ml). The product was purified by column chromatography (SiO2; CH2Cl2‐MeOH, 9 : 1 v/v) to give 1 c as yellow amorphous solid (429 mg, 70 %). To obtain an analytically pure sample, the sulfonate (1 c‐TfO) was transferred to the tetrafluoroborate (1 c‐BF4) by precipitation upon addition of aq. NaBF4 (sat., 1.0 ml) to a solution of product 1 c (60.3 mg, 100 μmol) in water/MeOH (1 : 1, 10 ml); mp 221–222 °C (1 c‐TfO), mp 250–252 °C (1 c‐BF4). – 1H NMR (500 MHz, DMSO‐d6): δ=3.23 (t, 3J=6 Hz, 2H, 5‐H), 4.18 (s, 3H, OCH3), 5.02 (t, 3J=6 Hz, 2H, 6‐H), 6.20 (s, 2H, OCH2O), 7.12 (s, 1H, 4‐H), 7.82 (s, 1H, 1‐H), 8.38 (d, 3J=9 Hz, 1H, 11‐H), 8.38 (d, 3J=9 Hz, 1H, 12‐H), 9.13 (s, 1 H, 13‐H), 9.67 (s, 1H, 8‐H). – 13C NMR (125 MHz, DMSO‐d6): δ=26.1 (C5), 55.9 (C6), 57.8 (O‐CH3), 102.3 (OCH2O), 105.6 (C1), 108.5 (C4), 118.2 (CF3) 120.0 (C13b), 120.2 (C8a), 121.2 (C13), 126.2 (C11), 129.9 (C12), 130.2 (C12a), 131.3 (C4a), 133.6 (C9), 139.5 (C13a), 142.5 (C8), 147.8 (C2), 150.4 (C3), 151.02 (C10). – MS (ESI+): m/z=454 [M+]. – El. Anal. for C20H15BF7NO6S, calc. (%): C 44.39, H 2.79, N 2.59, S 5.92 found (%): C 44.34, H 3.02, N 2.53, S 5.88.
12‐(4‐(N,N‐Dimethylamino)phenyl)‐9,10‐dimethoxy‐5,6‐dihydro‐[1,3]dioxolo[4,5‐g]‐isoquinolino[3,2‐a]isoquinolin‐7‐ium bromide (3 a): A mixture of 12‐bromoberberine (1 b) (198 mg, 400 μmol), 4‐(N,N‐dimethylaminophenyl)boronic acid (2) (90.8 mg, 550 μmol), Pd(dppf)Cl2⋅CH2Cl2 (9.8 mg) and KF (92.9 mg, 1.60 mmol) in DME/water/MeOH (2 : 1 : 1, 8 ml) was stirred for 3 h at 80 °C under argon gas atmosphere. After cooling to r.t. the mixture was diluted with water (2 ml) and concentrated in vacuo to a final volume of ca. 5 ml. The resulting precipitate was separated by filtration and washed with THF (1 ml) and EtOAc (2×20 ml). The crude product was recrystallized from MeOH/EtOAc/acetone to afford 3 a as red cubic crystals (136 mg, 64 %); mp>300 °C. – 1H NMR (600 MHz, CD3OD): δ=3.08 (s, 6H, NCH3), 3.19 (t, 3 J=6 Hz, 2H, 5‐H), 4.12 (s, 3H, OCH3), 4.22 (s, 3H, OCH3), 4.91 (t, 3 J=6 Hz, 2H, 6‐H), 6.06 (s, 2H, OCH2O), 6.93 (s, 1H, 4‐H), 7.00 (d, 3 J=7 Hz, 2 H, 2‘‐H, 6‘‐H), 7.17 (s, 1 H, 1‐H), 7.44 (d, 3 J=7 Hz, 2H, 3‘‐H, 5‘‐H), 7.91 (s, 1H, 11‐H), 8.35 (s, 1 H, 13‐H), 9.79 (s, 1H, 8‐H). – 13C NMR (150 MHz, CD3OD): δ=28.3 (C5), 40.8 (NCH3) 57.9 (C6), 57.8 (OCH3), 62.8 (OCH3), 103.9 (OCH2O), 106.1 (C1), 109.6 (C4), 114.0 (C2‘, C6‘), 120.1 (C13), 122.0 (C13b), 123.9 (C8a), 125.6 (C4’), 127.5 (C11), 132.0 (C4a), 132.0 (C3’, C5’), 133.0 (C12a), 138.6 (C12), 139.2 (C13a), 144.6 (C9), 146.7 (C8), 150.0 (C2), 151.9 (C10), 152.3 (C3), 152.6 (C1‘). – MS (ESI+): m/z=455 [M+]. – El. Anal. for C28H27N2O4Br, calc. (%): C 62.81, H 5.08, N 5.23, found (%): C 62.80, H 4.94, N 5.19.
9‐(4‐(N,N‐Dimethylamino)phenyl)‐10‐methoxy‐5,6‐dihydro‐[1,3]dioxolo[4,5‐g]‐isoquinolino[3,2‐a]isoquinolin‐7‐ium tetrafluoroborate (3 b): A mixture of 1 c (60.3 mg, 100 μmol), 2 (16.3 mg, 120 μmol), KF (29.0 mg, 500 μmol) and Pd(dppf)Cl2•CH2Cl2 (2.1 mg) in DME/water/MeOH (2 : 1 : 1, 3 ml) was stirred for 30 min at r.t. under Argon gas atmosphere. The precipitate was separated by filtration and washed with EtOAc (2×20 ml) and Et2O (30 ml). The remaining solid was dissolved in MeOH (20 ml), diluted with water (10 ml), and a solution of saturated aqueous NaBF4 (1 ml) was added. The formed precipitate was filtered off, dissolved in CH2Cl2 (40 ml) and filtered. The solvent was removed by distillation and the product was recrystallized from MeOH/EtOAc/acetone to give 3 b as amorphous orange‐colored solid (37.3 mg, 73 %); mp>300 °C. – 1H NMR (500 MHz, DMSO‐d6): δ=3.02 (s, 6H, N‐CH3), 3.13 (t, 3J=6 Hz, 2H, 5‐H), 3.94 (s, 3H, OCH3) 4.80 (t, 3J=6 Hz, 2H, 6‐H), 6.17 (s, 2H, OCH2O), 6.89 (d, 3J=9 Hz, 2 H, 3‘‐H, 5‘‐H), 7.07 (s, 1H, 4‐H), 7.30 (d, 3J=9 Hz, 2H, 2‘‐H, 6‘‐H), 7.82 (s, 1 H, 1‐H), 8.21 (d, 3J=9 Hz, 1H, 11‐H), 8.25 (d, 3J=9 Hz, 1H, 12‐H), 8.98 (s, 1 H, 13‐H), 9.11 (s, 1H, 8‐H). – 13C NMR (125 MHz, DMSO‐d6): δ=26.3 (C5), 39.7 (NCH3) 55.5 (C6), 56.8 (OCH3), 102.1 (OCH2O), 105.4 (C1), 108.4 (C4), 112.1 (C3‘, C5‘), 118.6 (C1’), 120.4 (C13b), 120.6 (C13), 124.6 (C11), 126.0 (C8a), 127.0 (C9), 128.0 (C12), 130.7 (C4a), 131.8 (C2’, C6’), 133.5 (C12a), 137.0 (C13a), 147.6 (C8), 147.7 (C3), 149.8 (C2), 150.2 (C4‘), 156.5 (C10). – MS (ESI+): m/z=425 [M+]. – El. Anal. for C27H25N2O3BF4, calc. (%): C 63.30, H 4.92, N 5.47, found (%): C 62.85, H 4.64, N 5.34.
Conflict of interest
The authors declare no conflict of interest.
Supporting information
As a service to our authors and readers, this journal provides supporting information supplied by the authors. Such materials are peer reviewed and may be re‐organized for online delivery, but are not copy‐edited or typeset. Technical support issues arising from supporting information (other than missing files) should be addressed to the authors.
Supplementary
Acknowledgements
Generous support by the Deutsche Forschungsgemeinschaft and the University of Siegen is gratefully acknowledged. We thank Ms. Jennifer Hermann and Ms. Sandra Uebach for technical assistance and Jens Wilbert and Dr. Stephan Bäurle for valuable help with the computational analysis. Open access funding enabled and organized by Projekt DEAL.
P. J. Wickhorst, H. Ihmels, Chem. Eur. J. 2021, 27, 8580.
In memoriam Professor Siegfried Hünig
References
- 1.
- 1a. Wiraja C., Yeo D. C., Lio D. C. S., Zheng M., Xu C., ChemBioChem 2019, 20, 437–450; [DOI] [PubMed] [Google Scholar]
- 1b. Smith S. J., Nemr C. R., Kelley S. O., J. Am. Chem. Soc. 2017, 139, 1020–1028. [DOI] [PubMed] [Google Scholar]
- 2.
- 2a. Tateishi-Karimata H., Sugimoto N., Chem. Commun. 2020, 56, 2379–2390; [DOI] [PubMed] [Google Scholar]
- 2b. Yuan J.-H., Shao W., Chen S.-B., Huang Z.-S., Tan J.-H., Biochem. Biophys. Res. Commun. 2020, 531, 18–24; [DOI] [PubMed] [Google Scholar]
- 2c. Suseela Y. V., Narayanaswamy N., Pratihar S., Govindaraju T., Chem. Soc. Rev. 2018, 47, 1098–1131. [DOI] [PubMed] [Google Scholar]
- 3. Juskowiak B., Anal. Bioanal. Chem. 2011, 399, 3157–3176. [DOI] [PMC free article] [PubMed] [Google Scholar]
- 4.
- 4a. Michel B. Y., Dziuba D., Benhida R., Demchenko A. P., Burger A., Front. Chem. 2020, 8, 112; [DOI] [PMC free article] [PubMed] [Google Scholar]
- 4b. Barnoy E. A., Popovtzer R., Fixler D., J. Biophot. 2020, 13, e202000158; [DOI] [PubMed] [Google Scholar]
- 4c. Wang L., Frei M. S., Salim A., Johnsson K., J. Am. Chem. Soc. 2019, 141, 2770–2781; [DOI] [PubMed] [Google Scholar]
- 4d. Alamudi S. H., Chang Y.-T., Chem. Commun. 2018, 54, 13641–13653; [DOI] [PubMed] [Google Scholar]
- 4e. Kobayashi H., Ogawa M., Alford R., Choyke P. L., Urano Y., Chem. Rev. 2010, 110, 2620–2640. [DOI] [PMC free article] [PubMed] [Google Scholar]
- 5.
- 5a.H. K. Saeed, S. Sreedharan, J. A .Thomas, Chem. Commun. 2020, 56, 1464–1480; [DOI] [PubMed]
- 5b. Ban Z., Griesbeck S., Tomic S., Nitsch J., Marder T. B., Piantanida I., Chem. Eur. J. 2020, 26, 2195–2203; [DOI] [PMC free article] [PubMed] [Google Scholar]
- 5c. Gao Y., He Z., He X., Zhang H., Weng J., Yang X., Meng F., Luo L., Tang B. Z., J. Am. Chem. Soc. 2019, 141, 20097–20106; [DOI] [PubMed] [Google Scholar]
- 5d. Chyan W., Raines R. T., ACS Chem. Biol. 2018, 13, 1810–1823; [DOI] [PMC free article] [PubMed] [Google Scholar]
- 5e. Peveler W. J., Algar W. R., ACS Chem. Biol. 2018, 13, 1752–1766; [DOI] [PubMed] [Google Scholar]
- 5f. Schwechheimer C., Rönicke F., Schepers U., Wagenknecht H.-A., Chem. Sci. 2018, 9, 6557–6563; [DOI] [PMC free article] [PubMed] [Google Scholar]
- 5g. Schulte L. N., Heinrich B., Janga H., Schmeck B. T., Vázquez O., Angew. Chem. 2018, 130, 11738–11742; [DOI] [PubMed] [Google Scholar]; Angew. Chem. Int. Ed. 2018, 57, 11564–11568; [DOI] [PubMed] [Google Scholar]
- 5h. Walter H.-K., Olshausen B., Schepers U., Wagenknecht H.-A., Beilstein J. Org. Chem. 2017, 13, 127–137; [DOI] [PMC free article] [PubMed] [Google Scholar]
- 5i. Ehrenschwender T., Varga B. R., Kele P., Wagenknecht H.-A., Chem. Asian J. 2010, 5, 1761–1764. [DOI] [PubMed] [Google Scholar]
- 6.
- 6a. Wang W., Hu S., Gu Y., Yan Y., Stovall D. B., Li D., Sui G., Biochim. Biophys. Acta Rev. Cancer 2020, 1874, 188410; [DOI] [PubMed] [Google Scholar]
- 6b. Gatto B., Palumbo M., Sissi C., Curr. Med. Chem. 2009, 16, 1248–1265; [DOI] [PubMed] [Google Scholar]
- 6c. Rankin S., Reszka A. P., Huppert J., Zloh M., Parkinson G. N., Todd A. K., Ladame S., Balasubramanian S., Neidle S., J. Am. Chem. Soc. 2005, 127, 10584–10589. [DOI] [PMC free article] [PubMed] [Google Scholar]
- 7.
- 7a. Neidle S., J. Med. Chem. 2016, 59, 5987–6011; [DOI] [PubMed] [Google Scholar]
- 7b. Rhodes D., Lipps H. J., Nucleic Acids Res. 2015, 43, 8627–8637. [DOI] [PMC free article] [PubMed] [Google Scholar]
- 8. Paeschke K., Simonsson T., Postberg J., Rhodes D., Lipps H. J., Nat. Struct. Mol. Biol. 2005, 12, 847–854. [DOI] [PubMed] [Google Scholar]
- 9.
- 9a. Wu S., Wang L., Zhang N., Liu Y., Zheng W., Chang A., Wang F., Li S., Shangguan D., Chem. Eur. J. 2016, 22, 6037–6047; [DOI] [PubMed] [Google Scholar]
- 9b. Hu M.-H., Chen S.-B., Guo R.-J., Ou T.-M., Huang Z.-S., Tan J.-H., Analyst 2015, 140, 4616–4625; [DOI] [PubMed] [Google Scholar]
- 9c. Wei Y., Zhang X., Wang L., Liu Y., Bing T., Liu X., Shangguan D., RSC Adv. 2015, 5, 75911–75917. [Google Scholar]
- 10. Lin D., Fei X., Gu Y., Wang C., Tang Y., Li R., Zhou J., Analyst 2015, 140, 5772–5780. [DOI] [PubMed] [Google Scholar]
- 11. Zhai Q., Gao C., Ding J., Zhang Y., Islam B., Lan W., Hou H., Deng H., Li J., Hu Z., Mohamed H. I., Xu S., Cao C., Haider S. M., Wei D., Nucleic Acids Res. 2019, 47, 2190–2204. [DOI] [PMC free article] [PubMed] [Google Scholar]
- 12.
- 12a. Yan J.-w., Tian Y.-g., Tan J.-H., Huang Z.-S., Analyst 2015, 140, 7146–7149; [DOI] [PubMed] [Google Scholar]
- 12b. Zuffo M., Doria F., Spalluto V., Ladame S., Freccero M., Chem. Eur. J. 2015, 21, 17596–17600. [DOI] [PubMed] [Google Scholar]
- 13.
- 13a. Ihmels H., Jiang S., Mahmoud M. M. A., Schönherr H., Wesner D., Zamrik I., Langmuir 2018, 34, 11866–11877; [DOI] [PubMed] [Google Scholar]
- 13b. Ihmels H., Mahmoud M. M. A., Patrick B. O., J. Phys. Org. Chem. 2017, 30, e3736; [Google Scholar]
- 13c. Chen X., Wang J., Jiang G., Zu G., Liu M., Zhou L., Pei R., RSC Adv. 2016, 6, 70117–70123; [Google Scholar]
- 13d. Karg B., Funke A., Ficht A., Sievers-Engler A., Laemmerhofer M., Weisz K., Chem. Eur. J. 2015, 21, 13802–13811. [DOI] [PubMed] [Google Scholar]
- 14.
- 14a. Kumari B., Yadav A., Pany S. P., Pradeepkumar P. I., Kanvah S., J. Photochem. Photobiol. B 2019, 190, 128–136; [DOI] [PubMed] [Google Scholar]
- 14b. Xie X., Choi B., Largy E., Guillot R., Granzhan A., Teulade-Fichou M.-P., Chem. Eur. J. 2013, 19, 1214–1226. [DOI] [PubMed] [Google Scholar]
- 15. Xie X., Zuffo M., Teulade-Fichou M.-P., Granzhan A., Beilstein J. Org. Chem. 2019, 15, 1872–1889. [DOI] [PMC free article] [PubMed] [Google Scholar]
- 16.
- 16a. Summers P. A., Lewis B. W., Gonzalez-Garcia J., Porreca R. M., Lim A. H. M., Cadinu P., Martin-Pintado N., Mann D. J., Edel J. B., Vannier J. B., Kuimova M. K., Vilar R., Nat. Commun. 2021, 12, 162; [DOI] [PMC free article] [PubMed] [Google Scholar]
- 16b. Chaudhuri R., Bhattacharya S., Dash J., Bhattacharya S., J. Med. Chem. 2021, 64, 42–70; [DOI] [PubMed] [Google Scholar]
- 16c. Reznichenko O., Cucchiarini A., Gabelica V., Granzhan A., Org. Biomol. Chem. 2021, 19, 379–386; [DOI] [PubMed] [Google Scholar]
- 16d. O′Hagan M. P., Haldar S., Morales J. C., Mulholland A. J., Galan M. C., Chem. Sci. 2021, 12, 1415–1426; [DOI] [PMC free article] [PubMed] [Google Scholar]
- 16e. Zhao, Yang Z., Zhai Q., Wei D., Anal. Chim. Acta 2020, 1132, 93–100; [DOI] [PubMed] [Google Scholar]
- 16f. Funke A., Weisz K., Biochimie 2019, 157, 142–148; [DOI] [PubMed] [Google Scholar]
- 16g. Xie X., Reznichenko O., Chaput L., Martin P., Teulade-Fichou M.-P., Granzhan A., Chem. Eur. J. 2018, 24, 12638–12651; [DOI] [PubMed] [Google Scholar]
- 16h. Riechert-Krause F., Weisz K., Heterocycl. Commun. 2013, 19, 145–166. [Google Scholar]
- 17.
- 17a. Das A. K., Ihmels H., Kölsch S., Photochem. Photobiol. Sci. 2019, 18, 1373–1381; [DOI] [PubMed] [Google Scholar]
- 17b. Das A. K., Druzhinin S. I., Ihmels H., Müller M., Schönherr H., Chem. Eur. J. 2019, 25, 12703–12707; [DOI] [PMC free article] [PubMed] [Google Scholar]
- 17c. Bortolozzi R., Ihmels H., Thomas L., Tian M., Viola G., Chem. Eur. J. 2013, 19, 8736–8741. [DOI] [PubMed] [Google Scholar]
- 18. Lewis B. W., Bisballe N., Santella M., Summers P. A., Vannier J.-B., Kuimova M. K., Laursen B. W., Vilar R., Chem. Eur. J. 2021, 27, 2523–2536. [DOI] [PubMed] [Google Scholar]
- 19.
- 19a. Guan L., Zhao J., Sun W., Deng W., Wang L., ACS Omega 2020, 5, 26056–26062; [DOI] [PMC free article] [PubMed] [Google Scholar]
- 19b. Zhang L., Liu X., Lu S., Liu J., Zhong S., Wei Y., Bing T., Zhang N., Shangguan D., ACS Appl. Bio Mater. 2020, 3, 2643–2650; [DOI] [PubMed] [Google Scholar]
- 19c. Grande V., Shen C.-A., Deiana M., Dudek M., Olesiak-Banska J., Matczyszyn K., Würthner F., Chem. Sci. 2018, 9, 8375–8381. [DOI] [PMC free article] [PubMed] [Google Scholar]
- 20.
- 20a. Xiong Y.-X., Huang Z.-S., Tan J.-H., Eur. J. Med. Chem. 2015, 97, 538–551; [DOI] [PubMed] [Google Scholar]
- 20b. Ji X., Sun H., Zhou H., Xiang J., Tang Y., Zhao C., Nucleic Acid Ther. 2012, 22, 127–136; [DOI] [PMC free article] [PubMed] [Google Scholar]
- 20c. Franceschin M., Rossetti L., D'Ambrosio A., Schirripa S., Bianco A., Ortaggi G., Savino M., Schultes C., Neidle S., Bioorg. Med. Chem. Lett. 2006, 16, 1707–1711. [DOI] [PubMed] [Google Scholar]
- 21.
- 21a. Becher J., Berdnikova D. V., Ihmels H., Stremmel C., Beilstein J. Org. Chem. 2020, 16, 2795–2806; [DOI] [PMC free article] [PubMed] [Google Scholar]
- 21b. Liao T.-C., Ma T.-Z., Chen S.-B., Cilibrizzi A., Zhang M.-J., Li J.-H., Zhou C.-Q., Int. J. Biol. Macromol. 2020, 158, 1299–1309; [Google Scholar]
- 21c. Pithan P. M., Decker D., Druzhinin S. I., Ihmels H., Schönherr H., Voß Y., RSC Adv. 2017, 7, 10660–10667; [DOI] [PMC free article] [PubMed] [Google Scholar]
- 21d. Zhang L., Liu H., Shao Y., Lin C., Jia H., Chen G., Yang D., Wang Y., Anal. Chem. 2015, 87, 730–737; [DOI] [PMC free article] [PubMed] [Google Scholar]
- 21e. Wu F., Shao Y., Ma K., Cui Q., Liu G., Xu S., Org. Biomol. Chem. 2012, 10, 3300–3307. [DOI] [PubMed] [Google Scholar]
- 22. Bhadra K., Kumar G. S., Biochim. Biophys. Acta. 2011, 1810, 485–496. [DOI] [PubMed] [Google Scholar]
- 23. Zhang W.-J., Ou T.-M., Lu Y.-J., Huang Y.-Y., Wu W.-B., Huang Z.-S., Zhou J.-L., Wong K.-Y., Gu L.-Q., Bioorg. Med. Chem. 2007, 15, 5493–5501. [DOI] [PubMed] [Google Scholar]
- 24.
- 24a. Xu L., Hong S., Sun N., Wang K., Zhou L., Ji L., Pei R., Chem. Commun. 2016, 52, 179–182; [DOI] [PubMed] [Google Scholar]
- 24b. Zhou C.-Q., Yang J.-W., Dong C., Wang Y.-M., Sun B., Chen J.-X., Xu Y.-S., Chen W.-H., Org. Biomol. Chem. 2016, 14, 191–197. [DOI] [PubMed] [Google Scholar]
- 25. Tillhon M., Guamán O. L. M., Lombardi P., Scovassi A. I., Biochem. Pharmacol. 2012, 84, 1260–1267. [DOI] [PubMed] [Google Scholar]
- 26. Warowicka A., Nawrot R., Goździcka-Józefiak A., Arch. Virol. 2020, 165, 1935–1945. [DOI] [PMC free article] [PubMed] [Google Scholar]
- 27. Mohammadinejad R., Ahmadi Z., Tavakol S., Ashrafizadeh M., J. Cell. Physiol. 2019, 234, 14914–14926. [DOI] [PubMed] [Google Scholar]
- 28. Ferraroni M., Bazzicalupi C., Papi F., Fiorillo G., Guamán-Ortiz L. M., Nocentini A., Scovassi A. I., Lombardi P., Gratteri P., Chem. Asian J. 2016, 11, 1107–1115. [DOI] [PubMed] [Google Scholar]
- 29. de Silva A. P., Moody T. S., Wright G. D., Analyst 2009, 134, 2385–2393. [DOI] [PubMed] [Google Scholar]
- 30.
- 30a. Fulaz S., Hiebner D., Barros C. H. N., Devlin H., Vitale S., Quinn L., Casey E., ACS Appl. Mater. Interfaces 2019, 11, 32679–32688; [DOI] [PubMed] [Google Scholar]
- 30b. Kato Y., Ozawa S., Miyamoto C., Maehata Y., Suzuki A., Maeda T., Baba Y., Cancer Cell Int. 2013, 13, 89. [DOI] [PMC free article] [PubMed] [Google Scholar]
- 31. Fulaz S., Hiebner D., Barros C. H. N., Devlin H., Vitale S., Quinn L., Casey E., ACS Appl. Mater. Interfaces 2019, 11, 32679–32688. [DOI] [PubMed] [Google Scholar]
- 32.
- 32a. Zhou X., Chen M., Zheng Z., Zhu G.-Y., Jiang Z.-H., Bai L.-P., RSC Adv. 2017, 7, 26921–26926; [Google Scholar]
- 32b.Y. Wu, L. Hai, R. Li, Y. Wang, Y. Zhou, CN 106866652, 2016.
- 33. Nechepurenko I. V., Boyarskikh U. A., Komarova N. I., Polovinka M. P., Filipenko M. L., Lifshits G. I., Salakhutdinov N. F., Tolstikov G. A., Dokl. Chem. 2011, 439, 204–208. [Google Scholar]
- 34. Jin X., Yan L., Li H.-j., Wang R.-L., Hu Z.-L., Jiang Y.-Y., Cao Y.-B., Yan T.-H., Sun Q.-Y., Anti-Cancer Agents Med. Chem. 2014, 15, 89–98. [PubMed] [Google Scholar]
- 35. Tian M., Ihmels H., Synthesis 2009, 24, 4226–4234. [Google Scholar]
- 36. Elias H., Ber. Bunsenges. Phys. Chem. 1990, 94, 537–538. [Google Scholar]
- 37.
- 37a. Yan Y.-Y., Tan J.-H., Lu Y.-J., Yan S.-C., Wong K.-Y., Li D., Gu L.-Q., Huang Z.-S., Biochim. Biophys. Acta 2013, 1830, 4935–4942; [DOI] [PubMed] [Google Scholar]
- 37b. O'Connor T., Mansy S., Bina M., McMillin D. R., Bruck M. A., Tobias R. S., Biophys. Chem. 1982, 15, 53–64. [DOI] [PubMed] [Google Scholar]
- 38. Stootman F. H., Fisher D. M., Rodger A., Aldrich-Wright J. R., Analyst 2006, 131, 1145–1151. [DOI] [PubMed] [Google Scholar]
- 39. de Cian A., Guittat L., Kaiser M., Saccà B., Amrane S., Bourdoncle A., Alberti P., Teulade-Fichou M.-P., Lacroix L., Mergny J.-L., Methods 2007, 42, 183–195. [DOI] [PubMed] [Google Scholar]
- 40. Díaz M. S., Freile M. L., Gutiérrez M. I., Photochem. Photobiol. Sci. 2009, 8, 970–974. [DOI] [PubMed] [Google Scholar]
- 41. Jessop P. G., Jessop D. A., Fu D., Phan L., Green Chem. 2012, 14, 1245–1259. [Google Scholar]
- 42.
- 42a. Fortage J., Tuyèras F., Peltier C., Dupeyre G., Calboréan A., Bedioui F., Ochsenbein P., Puntoriero F., Campagna S., Ciofini I., Lainé P. P., J. Phys. Chem. A. 2012, 116, 7880–7891; [DOI] [PubMed] [Google Scholar]
- 42b. Malval J.-P., Diemer V., Morlet-Savary F., Jacques P., Chaumeil H., Defoin A., Carré C., Poizat O., J. Phys. Chem. A. 2010, 114, 2401–2411. [DOI] [PubMed] [Google Scholar]
- 43.
- 43a. Gautam P., Harriman A., J. Chem. Soc. Faraday Trans. 1994, 90, 697–701; [Google Scholar]
- 43b. Vogel M., Rettig W., Ber. Bunsenges. Phys. Chem. 1985, 89, 962–968; [Google Scholar]
- 43c. Oster G., Nishijima Y., J. Am. Chem. Soc. 1956, 78, 1581–1584. [Google Scholar]
- 44. Granzhan A., Ihmels H., Viola G., J. Am. Chem. Soc. 2007, 129, 1254–1267. [DOI] [PubMed] [Google Scholar]
- 45. Kostjukova L. O., Kostjukov V. V., Int. J. Quantum Chem. 2020, e26537. [Google Scholar]
- 46.
- 46a. Aleksić M., Kapetanović V., Acta Chim. Solv. 2014, 61, 555–573; [PubMed] [Google Scholar]
- 46b. Sirajuddin M., Ali S., Badshah A., J. Photochem. Photobiol. B 2013, 124, 1–19. [DOI] [PubMed] [Google Scholar]
- 47.
- 47a. Misra V. K., Honig B., Proc. Natl. Acad. Sci. USA 1995, 92, 4691–4695; [DOI] [PMC free article] [PubMed] [Google Scholar]
- 47b. Jones R. L., Wilson W. D., Biopolymers 1981, 20, 141–154. [DOI] [PubMed] [Google Scholar]
- 48. Friedman R. A., Manning G. S., Biopolymers 1984, 23, 2671–2714. [DOI] [PubMed] [Google Scholar]
- 49.
- 49a. Saha M., Nandy P., Chakraborty M., Das P., Das S., Biophys. Chem. 2018, 236, 15–21; [DOI] [PubMed] [Google Scholar]
- 49b. Kashida H., Sano K., Hara Y., Asanuma H., Bioconjugate Chem. 2009, 20, 258–265. [DOI] [PubMed] [Google Scholar]
- 50. Islam M. M., Basu A., Hossain M., Sureshkumar G., Hotha S., Kumar G. S., DNA Cell Biol. 2011, 30, 123–133. [DOI] [PubMed] [Google Scholar]
- 51. Murat P., Singh Y., Defrancq E., Chem. Soc. Rev. 2011, 40, 5293–5307. [DOI] [PubMed] [Google Scholar]
- 52.
- 52a. Šmidlehner T., Piantanida I., Pescitelli G., Beilstein J. Org. Chem. 2018, 14, 84–105; [DOI] [PMC free article] [PubMed] [Google Scholar]
- 52b. Nordén B., Rodger A., Dafforn T., Linear Dichroism and Circular Dichroism. A Textbook on Polarized-Light Spectroscopy, RSC, Cambridge, 2010. [Google Scholar]
- 53. Nandi R., Debnath D., Maiti M., Biochim. Biophys. Acta Gene Struct. Expression 1990, 1049, 339–342. [DOI] [PubMed] [Google Scholar]
- 54.
- 54a. Neese F., Wiley Interdiscip. Rev.: Comput. Mol. Sci. 2018, 8, e1327; [Google Scholar]
- 54b. Neese F., WIREs Comput. Mol. Sci. 2012, 2, 73–78. [Google Scholar]
- 55. Vorlíčková M., Kejnovská I., Sagi J., Renčiuk D., Bednářová K., Motlová J., Kypr J., Methods 2012, 57, 64–75. [DOI] [PubMed] [Google Scholar]
- 56.
- 56a. Renciuk D., Kejnovská I., Skoláková P., Bednárová K., Motlová J., Vorlícková M., Nucleic Acids Res. 2009, 37, 6625–6634; [DOI] [PMC free article] [PubMed] [Google Scholar]
- 56b. Ambrus A., Chen D., Dai J., Bialis T., Jones R. A., Yang D., Nucleic Acids Res. 2006, 34, 2723–2735. [DOI] [PMC free article] [PubMed] [Google Scholar]
- 57.
- 57a. Sun H., Tang Y., Xiang J., Xu G., Zhang Y., Zhang H., Xu L., Bioorg. Med. Chem. Lett. 2006, 16, 3586–3589; [DOI] [PubMed] [Google Scholar]
- 57b. Yamashita, Uno T., Ishikawa Y., Bioorg. Med. Chem. 2005, 13, 2423–2430. [DOI] [PubMed] [Google Scholar]
- 58. Jain A. K., Bhattacharya S., Bioconjugate Chem. 2011, 22, 2355–2368. [DOI] [PubMed] [Google Scholar]
- 59. Bazzicalupi C., Ferraroni M., Bilia A. R., Scheggi F., Gratteri P., Nucleic Acids Res. 2012, 41, 632–638. [DOI] [PMC free article] [PubMed] [Google Scholar]
- 60.
- 60a. Zhang R., Cheng M., Zhang L.-M., Zhu L.-N., Kong D.-M., ACS Appl. Mater. Interfaces 2018, 10, 13350–13360; [DOI] [PubMed] [Google Scholar]
- 60b. Huo Y.-F., Zhu L.-N., Li X.-Y., Han G.-M., Kong D.-M., Sens. Actuator. B 2016, 237, 179–189. [Google Scholar]
- 61. Seviour T., Winnerdy F. R., Wong L. L., Shi X., Mugunthan S., Castaing R., Adav S. S., Kohli G. S., Shewan H. M., Stokes J. R., Rice S. A., Phan A. T., Kjelleberg S., bioRxiv 2019, 527267. [Google Scholar]
- 62. Oesch D., Luedtke N. W., Chem. Commun. 2015, 51, 12641–12644. [DOI] [PubMed] [Google Scholar]
- 63. Jin X., Yan L., Li H.-j., Wang R.-L., Hu Z.-L., Jiang Y.-Y., Cao Y.-B., Yan T.-H., Sun Q.-Y., Anti-Cancer Agents Med. Chem. 2014, 15, 89–98. [PubMed] [Google Scholar]
- 64. Ren J., Chaires J. B., Biochemistry 1999, 38, 16067–16075. [DOI] [PubMed] [Google Scholar]
Associated Data
This section collects any data citations, data availability statements, or supplementary materials included in this article.
Supplementary Materials
As a service to our authors and readers, this journal provides supporting information supplied by the authors. Such materials are peer reviewed and may be re‐organized for online delivery, but are not copy‐edited or typeset. Technical support issues arising from supporting information (other than missing files) should be addressed to the authors.
Supplementary