Abstract
Lewis acids have recently been recognized as catalysts enabling enantioselective photochemical transformations. Mechanistic studies on these systems are however rare, either due to their absorption at wavelengths shorter than 260 nm, or due to the limitations of theoretical dynamic studies for larger complexes. In this work, we overcome these challenges and employ sub‐30‐fs transient absorption in the UV, in combination with a highly accurate theoretical treatment on the XMS‐CASPT2 level. We investigate 2‐cyclohexenone and its complex to boron trifluoride and analyze the observed dynamics based on trajectory calculations including non‐adiabatic coupling and intersystem crossing. This approach explains all ultrafast decay pathways observed in the complex. We show that the Lewis acid remains attached to the substrate in the triplet state, which in turn explains why chiral boron‐based Lewis acids induce a high enantioselectivity in photocycloaddition reactions.
Keywords: calculations, enones, lewis acids, photochemistry, time-resolved spectroscopy
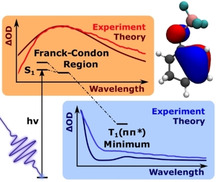
The Lewis acid complex of 2‐cyclohexenone and BF3 relaxes to the active triplet state after photoexcitation in less than a picosecond. This process can be followed by XMS‐CASPT2 dynamics and transient absorption spectroscopy.
Introduction
Lewis acids modulate the photochemical behavior of carbonyl compounds by coordination to the Lewis‐basic oxygen atom. Although the fact that Lewis acids can have a beneficial impact on the course of photochemical reactions has been known for more than a century, [1] systematic studies of the interaction between a Lewis acid and a carbonyl chromophore were first undertaken in the 1980s and 1990s. Among several notable contributions, [2] the topic was most comprehensively investigated by the groups of Lewis and Fukuzumi. Lewis and co‐workers explored the photochemistry of coumarins, quinolones, cinnamates and related compounds in a series of papers entitled “Lewis Acid Catalysis of Photochemical Reactions”. [3] The group of Fukuzumi interrogated the influence of a Lewis acid on the photoredox properties of carbonyl compounds [4] in the context of their general interest in the effect of Lewis acids on photoredox catalysis. [5] In more recent years, the interest in Lewis acids and carbonyl compounds has been largely triggered by the desire to exploit chiral Lewis acids for the enantioselective catalysis of photochemical reactions. [6] The [2+2] photocycloaddition attracted the most attention and several modes of action were shown to be operative, including (a) a stabilization of the excited state, [7] (b) a more facile photoredox event, [8] (c) a bathochromic absorption shift, [9] (d) a lowering of the energy of the triplet state [10] or combinations thereof. [11] Apart from the enantioselectivity issue, Lewis acids have also been found to be useful to activate aromatic carbonyl compounds towards a reaction at the aromatic or heteroaromatic core. [12] They may also allow for new reaction pathways, such that reactions can take place in a different spin state. [13]
Several experimental studies were accompanied[ 10 , 11 , 12a , 13 , 14 ] or supported [15] in separate papers by calculations which aided to understand the course of the reaction. However, despite the increasing number of synthetic studies, very little attention has been paid to the immediate influence of the Lewis acid on a carbonyl chromophore upon excitation. Despite early laser flash photolysis studies on relevant carbonyl compounds, e.g. cyclic α,β‐unsaturated ketones (enones), [16] an elemental picture of the fate of a typical photochemical substrate in the presence of a Lewis acid does not exist. Previous theoretical studies already addressed the nature of the excited states and reaction paths of simple enones[ 17 , 18 , 19 ] and semiclassical dynamics gave insight into the singlet‐triplet crossing mechanisms. [20] The reaction paths in Lewis acid complexes have also been investigated computationally, but these studies were focused on different classes of enones (coumarines and 5,6‐dihydro‐4‐pyridones), for which the order of the excited states is different. [15]
Here we present a detailed mechanistic study on the effects of the addition of the Lewis acid BF3 to the paradigmatic 2‐cyclohexenone (1), to form the photocatalytic complex (2), (Scheme 1). The combination of state‐of‐the‐art femtosecond transient absorption (TA) in the UV and high‐level quantum dynamical and quantum chemical methods on the XMS‐CASPT2 level of theory allows us to (a) highlight the effects of Lewis acid addition on both static and dynamic system properties, (b) identify and describe not only the reaction pathway towards the photocatalytically active low‐lying triplet state T1, but also an important loss channel, namely radiationless S1→S0 internal conversion via a conical intersection.
Scheme 1.

2‐Cyclohexenone (1) as a model substrate to explore the photophysical properties of its Lewis acid complex 2 to boron trifluoride (Isomer 2′ with BF3 coordinated away from the double bond).
Results and Discussion
Vertical Excitation Energies and Calculated Absorption Spectra. The 2‐cyclohexenone‐BF3 complex (2) was generated by treatment of 2‐cyclohexenone (1) with an excess of BF3⋅OEt2 in dichloromethane solution. In previous work by Childs et al., complex 2 had been studied by NMR spectroscopy and was identified as a 1:1 complex. [21] Addition of BF3⋅OEt2 to 2‐cyclohexenone led to a bathochromic shift of the strong absorption band at λ=224 nm (ϵ=12.6×10⁻³ L mol−1 cm−1) to a new signal with a maximum at λ=250 nm. Beyond 5.0 equiv. of BF3⋅OEt2, the absorbance did not increase further (Figure 1 b), indicating complete formation of complex 2 at this concentration. The isosbestic point at λ=236 nm revealed that no other species was formed but the 1:1 complex. The weak absorption at λ=330 nm observed in 1 (ϵ=34 L mol−1 cm−1, see Figure 1 a) disappeared completely. Instead, a shoulder developed at λ=266 nm (Figure 1 b).
Figure 1.
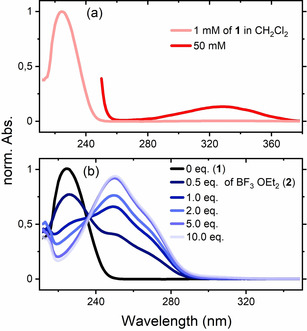
(a) UV/Vis absorption spectrum of 2‐cyclohexenone (1, CH2Cl2, c=1.0 mM, rose; c=50 mM, red) and (b) its variation (c=1.0 mM) upon addition of 0 equiv. (black), 0.5 equiv., 1.0 equiv., 2.0 equiv., 5.0 equiv. and 10.0 equiv. of BF3⋅OEt2 (formation of 2, blue).
The large red shift in the absorption spectra of the complex 2 compared to 2‐cyclohexenone (1) can be explained by inspection of the calculated vertical excitation energies. Starting from the optimized ground state geometry, the excited state energies were calculated on XMS‐CASPT2(6,5)/cc‐pvtz level of theory for the singlets S1, S2 and the triplets T1 and T2. In both cases the agreement between theory and experiment is excellent (Table 1).
Table 1.
Calculated absorption maxima and transition dipole moments for the lowest two singlet transitions in 1 and 2. The two values for 2/ 2′ are for the two different conformers (see Scheme 1 and Figure S7). The absorption maxima of the experimental absorption bands and the shoulder observed in the complex 2 are given in parentheses.
|
|
Excited State |
Transition Energy in eV |
Transition Wave‐length in nm |
Transition Dipole in D |
|---|---|---|---|---|
|
1 |
S1(nπ*) |
3.73 (3.76) |
333 (335) |
0.0695 |
|
S2(ππ*) |
5.74 (5.54) |
216 (224) |
4.53 |
|
|
2/ 2′ |
S1(nπ*) |
4.87/ 4.87 (4.66) |
255/ 255 (266) |
0.126/ 0.594 |
|
S2(ππ*) |
5.08/ 5.15 (4.96) |
244/ 241 (250) |
4.93/ 5.06 |
In the enone 1, the S1(nπ*) state is almost dark, only the S2(ππ*) state exhibits a significant transition dipole moment of 4.53 D (Table 1). Complex 2 exists in two conformers (see Scheme 1 and Figure S7), in which the boron atom resides in the plane of the conjugated π‐system and the BF3 group is oriented either towards or away from the C=C double bond (structure 2, respectively, 2′ in Scheme 1). Both conformers exhibit very similar energies and nearly identical absorption spectra. All frontier orbitals of 2 involved in the excitation process, π, n, and π*, shown in Figure 2 for one of the conformers, are stabilized with respect to 1. The n‐orbital representing a lone pair orbital of oxygen is most strongly affected as it participates in the σ‐bond formation with the Lewis acid BF3. The partial transfer of electron density from the oxygen to the boron atom lends some oscillator strength to the nπ* transition and causes a strong blue shift of the S1(nπ*) absorption band from 333 nm to 255 nm. The π*‐orbital is subject to an intermediate level of stabilization as it is not directly involved in the O−B bond but is localized close to the oxygen atom. The π‐orbital is the least stabilized by complex formation, leading to an overall red shift of the S2(ππ*) state in the complex.
Figure 2.

(a) Calculated relative energies of the three lowest singlet and two lowest triplet states at the Franck‐Condon point of 1 and 2. Excitation wavelengths corresponding to the transitions from the ground to the singlet excited states are indicated to allow a direct comparison with the experimental spectra. Orbitals with major contributions to the excitations of 1 and 2 are shown to the right in (b) and (c), respectively.
The absorption spectra are computed as described in the Computational Methods section of the supporting information and are compared to the experimental spectra in Figure 3 a for 1 and Figure 3 b for 2. In complex 2, the S2 and S1 bands partly overlap such that the S1 contribution can be assigned to the shoulder in the experimental spectrum (Figure 3 b). Complex formation affects singlet and triplet states in a similar manner. As the two triplet states lie very close in 1, complexation leads to a change of character of the T1 and T2 states. In both isomers of the complex (2/2′) T1 has now 3(ππ*) character, while T2 assumes 3(nπ*) character. In 1, the S1 state is sandwiched between T1(nπ*) and T2(ππ*) while in the complex both triplets are located energetically below the S1 state (see Figure 2 a). Significant spin‐orbit coupling only occurs between ππ* and nπ* configurations in accordance with El Sayed's rule. [22]
Figure 3.
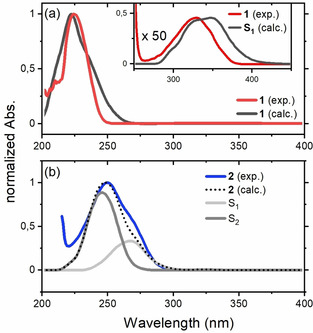
Comparison of the theoretical and experimental UV/Vis spectra. (a) Experimental spectrum of 1 (CH2Cl2, c=1.0 mM, c=50 mM in the inset, red), calculated absorption (black) of the S1(nπ*) state (in the inset, multiplied by a factor of 50) and the S2(ππ*) state of 1. (b) Experimental spectrum of 2 (CH2Cl2, c=1.0 mM, blue), calculated absorption of the S1(nπ*) state (light grey), the S2(ππ*) state (dark grey) and total absorption (black, dotted) of 2.
Reaction Path and Trajectory Calculations for Enone 1. Starting from the Franck‐Condon (FC) geometry, the 1(nπ*) electronic configuration is preserved along the reaction path in the S1 state. A planar S1(nπ*) minimum could be located as well as two conical intersections (CoIn) with the ground state S0. At CoIn 1, the ring structure is twisted along the HC=CH dihedral and CoIn 2 is an open ring structure (Figure 4). CoIn 1 lies energetically at the same level as the FC geometry whereas CoIn 2 lies energetically above the FC point (Figure 4, see also Table S5). Hence, no significant transfer through these intersections is expected, instead relaxation might occur via the triplet states. Two minima are found in the adiabatic T1 potential: the first is planar and of nπ* configuration and lies in the FC region, while the second lower one is twisted and of ππ* configuration (Figure 4). Both minima are connected via a CoIn (T1T2 CoIn) and a barrier in its close vicinity. Thus, along the reaction coordinate the T2(ππ*) state crosses the S1(nπ*) state. Between these states the spin orbit coupling of 37.96 cm−1 is large enough and the energy gap small enough to expect significant intersystem crossing (ISC) from S1(nπ*) to T2(ππ*). Thereafter, the T2(ππ*) population passes the T1T2 CoIn diabatically and becomes T1(ππ*), which is long‐lived as its spin‐orbit coupling to the ground state is small (5.73 cm−1) and the energy gap is large (1.06 eV).
Figure 4.
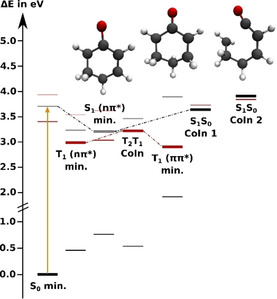
Energy levels of the adiabatic states of 1 at critical points relevant to the relaxation process evaluated on XMS‐CASPT2(8,7)/cc‐pvdz level of theory. S0 is shown in black, S1 in grey; T1 is shown in red and T2 in faint red. The thick horizontal lines indicate the energies of the optimized states, while the thin lines indicate the energies of all other states at the optimized geometries (see Tables S5–S10). The dotted lines suggest possible relaxation pathways. The molecular structures are the planar S1(nπ*) minimum (left, slightly elongated C−O bond), the twisted T1(ππ*) minimum (middle, torsion around the C−C double bond) and the ring‐opening CoIn between S1 and S0 (right).
The expectations from the static calculations were verified by trajectory calculations at the XMS‐CASPT2(8,7)/cc‐pvdz level of theory including non‐adiabatic and also spin‐orbit coupling. For the dynamics, a smaller double‐zeta basis set was employed, which leaves the energetic order of the involved states unaffected at critical points of the potential energy surface (see Tables S6 and S9).
13 Trajectories were started from the S1 state, ten of which reached the final simulation time of 2 ps. For details see section 6.4 of the supporting information. This small sample size at a high level of electronic structure theory should give a good picture of the major reaction pathways as all the surviving trajectories show a similar behavior. Only reaction channels of minor importance might be missed. No re‐population of the ground state via either S1S0 CoIn 1 or S1S0 CoIn 2 was observed, instead, the S1 state decayed completely to the triplet states with a time constant of approximately 750 fs (Figure 5).
Figure 5.
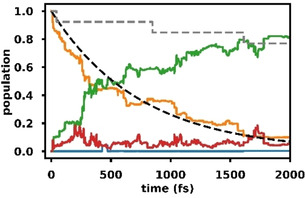
Adiabatic state populations based on quantum amplitudes for XMS‐CASPT2(8,7)/cc‐pvdz surface hopping trajectories started in the S1 state of 1; S1 (orange), S0 (blue), T1 (green), T2 (red), exponential fit of the singlet triplet population transfer with a time constant of 746 fs (black, dashed), fraction of active trajectories (grey, dashed).
This is in good agreement with previous experiments in which a triplet quantum yield close to unity was reported after excitation of 2‐cyclohexenone (1) to the S1 state. [16] After subtraction of the backwards crossings, there were in total eleven hops from S1 to T2 and eleven hops from T2 to T1. All transitions between S1 and T2 occurred at nearly planar geometries close to the S1 minimum. These transitions were associated with a change in the character of the electronic wavefunction from 1(nπ*) to 3(ππ*). Since the T2T1 CoIn is also close to the planar geometry, the crossings from S1(nπ*) to T2(ππ*) were generally followed immediately by a hop from T2(ππ*) to T1(ππ*). Accordingly, Figure 5 does not show a significant build‐up of population in T2. The T1 state can subsequently relax to the T1(ππ*) minimum via a twist in the HC=CH dihedral angle. All trajectories that reached the final 2 ps showed some amount of twisting. As no cooling mechanisms were included, they can oscillate quite far away from the triplet minimum due to the large amount of kinetic energy gained along the relaxation path from the FC region which leads to occasional crossings back into T2.
Reaction Path and Trajectory Calculations for Complex 2. The two conformers 2 and 2′ are energetically very similar with equivalent local and global minima on the potential energy surface. In the following, we will limit our discussion to conformer 2. In 2, the FC geometry (Figure 6) is close to a CoIn between S2 and S1 (S2S1 CoIn). Even an excitation to S2 will relax very fast to S1 via the S2S1 CoIn, which simultaneously acts as a branching point towards two different pathways.
Figure 6.
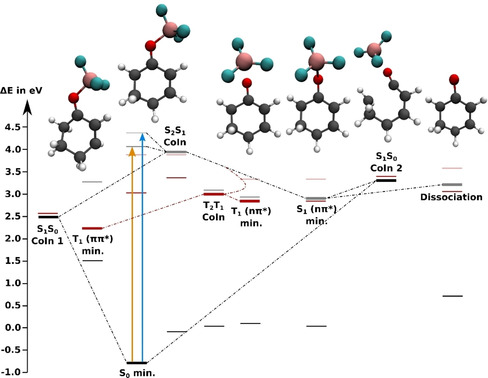
Energy levels of the adiabatic states of 2 at critical points relevant to the relaxation process evaluated at XMS‐CASPT2(8,7)/cc‐pvdz level of theory. S0 is shown in black, S1 in grey and S2 in faint grey; T1 is shown in red and T2 in faint red. The thick horizontal lines indicate the energies of the optimized states, while the thin lines indicate the energies of all other states at the optimized geometries (see Tables S15–S20). The dotted lines suggest possible relaxation pathways. The molecular structures are (from left to right): The twisted T1(ππ*) minimum (torsion around the C−C double bond), the FC geometry, the T1(nπ*) and S1(ππ*) minima with the torsion around the C−O double bond and the elongated O−B bond, the ring opening CoIn between S1 and S0 and the S1 minimum of free 2‐cyclohexenone (1) that is reached by dissociation in the S1 state.
Preserving the ππ* character the system reaches a CoIn with the ground state (S1S0 CoIn 1) at a twisted geometry. Preserving the nπ* character, the system can reach the S1(nπ*) minimum. At this geometry the BF3 group is rotated out of the molecular plane and the oxygen‐boron bond is elongated. This path can lead to heterolytic dissociation of the complex in the gas phase. In this direction another CoIn with the ground state (S1S0 CoIn 2) was found with an open ring structure. Thus, in contrast to enone 1 there are two energetically accessible CoIns, and internal conversion can act as a competing channel to ISC. During relaxation into the S1(nπ*) minimum the T2(ππ*) state crosses the S1 state allowing for significant ISC with spin‐orbit couplings around 25 cm−1. As in 1, the T1 state of 2 displays two minima, one local of nπ*‐ and one global of ππ*‐character, which are connected by the T1T2 CoIn. The T1(nπ*) minimum is geometrically close to the S1 minimum with the BF3 group rotated out of plane, while the T1(ππ*) minimum is geometrically close to the S1S0 CoIn 1 with a twist along the C=C double bond. Compared to the enone reaction path we observe two main differences: close lying and optically addressable S1 and S2 states and energetically accessible CoIns with the ground state.
To verify whether the proposed relaxation pathways actually take place in the excited complex 2, we performed surface hopping calculations at the XMS‐CASPT2(8,7)/cc‐pvdz level of theory. Due to computational costs, triplet states and spin‐orbit coupling could not be included. In addition, a smaller basis set was employed, which only had minor effects on the relative energies of the involved states at critical points of the potential energy surface (see Tables S16 and S19). While dynamics in the singlet states can only provide a part of the picture, it was possible to investigate a larger number of trajectories. In total 50 trajectories per conformer and initial state were run. The results differed depending on whether the trajectories were started in the S1(nπ*) state or the S2(ππ*) state. Starting from S1, most trajectories led to dissociation, since by removing an electron from the n‐orbital the oxygen‐boron bond is weakened so that the energy gained by relaxation from the FC region is enough to break it. Eleven trajectories did not dissociate. All of them showed a hop from S1 to S0 early in the propagation. In total, we observed thirteen hops from S1 to S0, of which eleven happened at a twisted structure (S1S0 CoIn 1) while two occurred at an open ring structure (S1S0 CoIn 2). Interestingly, there was a significant difference between the two conformers of the complex. When the BF3 was on the same side as the double bond (2), the relaxation mainly proceeded through S1S0 CoIn 1. When the BF3 pointed away from the double bond (2′), dissociation was more likely, and relaxation mainly proceeded through S1S0 CoIn 2. The population dynamics of the trajectories starting in S2 is shown in Figure 7. In this case, the difference between the two conformers was small. All trajectories quickly relaxed to S1, but from there, different pathways were taken. 34 Trajectories relaxed to the S0 state, 30 of them hopped at a twisted structure similar to the S1S0 CoIn 1. In general, these trajectories did not show dissociation. They followed the electronic ππ* character diabatically. The other four hops occurred at an open‐ring structure similar to S1S0 CoIn 2 and contained a broken or very elongated oxygen‐boron bond. Due to these accessible relaxation channels we see a re‐population of the S0 ground state on a time scale below 150 fs. The remaining 66 trajectories stayed in the S1. These trajectories follow the nπ* character diabatically and mainly show dissociative behavior in the gas phase. In solution, caging effects could decelerate or even prevent the dissociation. [23]
Figure 7.
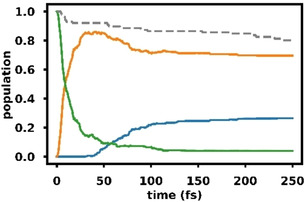
Adiabatic state populations based on Boltzmann averaged quantum amplitudes for XMS‐CASPT2(8,7)/cc‐pvdz surface hopping trajectories started in the S2 state of 2 and 2′; S2 (green), S1 (orange), S0 (blue); Boltzmann weighted fraction of active trajectories of 2 and 2′ (grey, dashed).
Transient Absorption Spectra. We experimentally addressed the photoinduced dynamics of compound 2 on timescales commensurate with intra‐molecular electronic relaxation using femtosecond TA spectroscopy. We initiated excited‐state dynamics by pulses centered at 285 nm, to predominantly excite the S0→S1 transition, and followed the time‐evolution by UV and UV/Vis probe pulses. A representative selection of TA spectra is shown in Figure 8, where the spectral evolution over the first several picoseconds after excitation is clearly illustrated.
Figure 8.
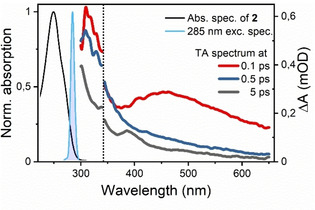
Normalized absorption (black line), excitation spectra (blue shaded area) and TA spectra of 2 at several time‐delays (colored lines). TA spectra in the UV (λ<340 nm) and Visible (λ>340 nm) range were recorded in separate experiments.
Over the time‐range displayed here, substantial changes were observed in particular in the visible: immediately on excitation, a broad visible excited‐state absorption (ESA) band covering 400–600 nm was formed. This band subsequently decayed on a timescale of a few hundred femtoseconds, revealing rapid population transfer out of the initially excited FC region. Following this initial process, subtler changes, as well as an overall loss of signal intensity, took place across the UV/Vis spectral range over the next several picoseconds. Figure 9 displays the (normalized) TA maps in two‐dimensional detection wavelength vs. time‐delay plots.
Figure 9.

(a) Transient absorption maps for 2 DUV (bottom) and UV/Visible (top) probe range spectra after 285 nm excitation. Spectra are normalized to the signal maximum in the DUV experiment. Time‐scale changed to logarithmic at 1 picosecond. (b) Transients at indicated detection wavelengths (dark grey) in comparison to fit results from global analysis (red). Spectra at each detection wavelength are normalized to their respective maximum.
The initial ≈100 fs of the dynamics are dominated by the coherent artifact (CA), inhibiting detailed analysis within this range. After the CA, however, the spectra were well behaved and revealed the relaxation dynamics on the excited state surface. Again, we saw a broad ESA feature characterizing the excited state at the FC point. This band rapidly decayed, leaving only a weak featureless ESA in the visible range as well as a more intense band in the UV. These bands decayed much more slowly, reaching a quasi‐equilibrium state after a few picoseconds as demonstrated by the transients at UV and visible detection wavelengths in Figure 9 b. TA spectra from experiments recorded using 260 nm excitation, displaying similar behavior, are shown in Figures S1 and S2. Note that long‐lived oscillatory features were observed across the spectrum regardless of detection wavelength, but with highest amplitude at 340 nm as shown in Figure 9 b. These oscillations are not related to intra‐molecular dynamics of the studied complex but are rather impulsive stimulated Raman scattering features originating from the solvent (see Figure S4 for pure solvent spectra).
Kinetic Model and Data Analysis. We can extract quantitative information about the excited‐state relaxation dynamics by simultaneously fitting the time‐evolution of the signal at all detection wavelengths to a sum‐of‐exponentials decay model (sequential model, see below), using the time constants as global parameters. A purely sequential model (A→B→C…) is one of the simplest deactivation schemes, which is however also supported by the theoretical model in Figure 6. From a physical perspective, we expect a bifurcation of the S1 population via S1→S0 and S1→T1. We do not expect to observe the former channel directly, that is, the formation of a vibrationally hot ground state, as the TA probing range does not cover the ground state bleach region (see Figure 9 in comparison to the absorption spectrum in Figure 8). For the remaining and spectrally observable reaction pathway, S1→T1, theory predicts a uni‐directional relaxation, for which a purely sequential model is a good approximation. Singular value decomposition and inspection of the resulting fit residuals reveals that four time constants suffice to explain the photodynamics after 285 nm excitation. All time constants are collected in Table 2.
Table 2.
Collected time constants extracted from global kinetic analysis of the transient absorption experiments. The longest living component (corresponding to the ground‐state recovery) has a decay‐time longer than the measurement time window.
|
|
Component |
Lifetime in ps |
|---|---|---|
|
DUV probe |
τ1 |
0.10 |
|
τ2 |
0.45 |
|
|
τ3 |
4.8 |
|
|
|
τ4 |
>50 |
|
VIS probe |
τ1 |
0.16 |
|
τ2 |
0.30 |
|
|
τ3 |
4.4 |
|
|
τ4 |
>50 |
The fastest component in the TA data decays on a 100–150 fs timescale and is readily attributed to rapid decay of the initially excited FC state, while the ground‐state recovery at long times proceeds on timescales longer than our probe window (i.e. >50 ps). At intermediate times, the picture is less clear, at least before a comparison with the theoretical studies was made as given in the next section. We observe two components with sub‐ps and few ps dynamics.
In addition to the time constants of the components in a multi‐exponential decay fit, it is useful to represent also their amplitudes. A spectral representation of these reveals detailed information about the probe wavelengths at which a given process contributes. While a number of spectral representations are possible, we here show the Evolution Associated Decay Spectra (EADS) [24] in Figure 10 (time constants and EADS from 260 nm excitation experiment shown in Figure S3). The physical model imposed on the data in this representation is a strictly sequential transfer between a set of “compartments”, where the EADS can be interpreted as the transient spectra of the individual compartments. As such, the population is initially found in “compartment 1”, whereafter it transfers to “compartment 2”, and so on.
Figure 10.

Evolution associated decay spectra extracted from global kinetic analysis of TA data after excitation at 285 nm. The time constants noted are approximate representations of parameters extracted from both UV and visible experiments—the actual time constants from a given dataset can be found in Table 2.
The EADS in Figure 10 renders our qualitative observations quantitative regarding the raw data in Figure 9. The initially excited state displays a broad ESA across the visible spectrum. As it decays on a ≈130 fs time‐scale, a spectrally distinct state—characterized largely by strong UV absorption—is formed. Subsequently, on timescales from several hundred fs to a few ps, we observe signal loss and small‐scale spectral changes largely in the UV range between 300 and 400 nm.
Overall, these spectral dynamics are consistent with initial excitation, followed by rapid transfer into a manifold of states, where the electronic structure is substantially different. In the following section, these assignments are substantiated significantly by a theoretical analysis of excited state spectra.
Excited State Spectra—Experiment vs. Theory. The theoretical approaches discussed so far describe processes connected to the optical excitation (Figures 2 and 3), and the subsequent population relaxation processes including non‐adiabatic coupling and ISC (Figures 4–7). As XMS‐CASPT2 can also accurately capture higher lying excited states, it further provides a direct connection between populations and spectral observables through calculated ESA spectra (the calculation of the ESA spectra is described in the Computational Methods section of the supporting information). This in turn greatly facilitates the discussion of the experimental results, as the EADS in Figure 10 can now be assigned to specific excited states and molecular geometries by comparison with calculated ESA features. In Figure 11 we compare the calculated ESA spectra of S1 in the FC region and T1 in the T1(ππ*) minimum to relevant EADS. Based on the fact that S1 may deactivate both towards S0 (see Figure 7 for population dynamics of 2) and to the triplet states T1 and T2, we expect its overall lifetime to be short. Accordingly, comparison of the fastest decaying EADS component with a 0.13 ps lifetime (red curve in Figure 11 (a)) with the calculated ESA spectrum of S1 in the FC region (faint red curve) gives qualitatively excellent agreement. The calculated spectrum is the sum of three transitions, that is, S1→S2,3,4, where we depict their relative weights and the analogous decomposition of the T1 ESA spectrum in Figures S11 and S10, respectively. The minor deviation between experiment and theory in Figure 11 (a) in the spectral regions below 400 nm is readily explained by the pump pulse‐related CA, still contributing significantly at such early delay times. [25] Thus we can assign the fastest decay component to the relaxation of S1 out of the FC region either to the ground‐state S0 through conical intersections or to the S1(nπ*) minimum.
Figure 11.
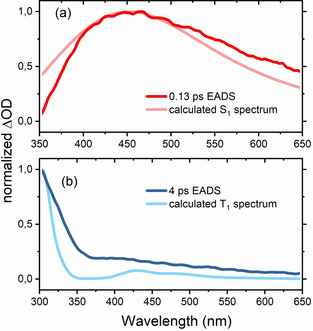
Comparison between selected EADS (full colors) and calculated ESA spectra (faint colors) of singlet state S1 of 2/2′ in the FC region (a) and triplet state T1 thermalized in the T1(ππ*) minimum (b).
The triplet state T1 is the lowest lying excited state of 2 (see Figure 6). Hence, we compare the calculated ESA spectrum in the T1(ππ*) minimum (blue faint line in Figure 11 (b)) to the component with a long lifetime—specifically the 4 ps EADS (blue line). Even though we retrieved a component with an even longer lifetime (see Figure 9), we chose to compare to the 4 ps EADS, as this component's lifetime is still reliable within the 50 ps delay window of the experiment. As for the S1 case, the qualitative agreement between experiment and theory is remarkable (Figure 11 (b)). We note that the results of global analysis, that is, EADS, relate to the entire TA‐signal, while the theoretical predictions were made for ESA spectra only. The direct comparison of the calculated ESA‐spectra to the retrieved EADS is only feasible thanks to the lack of ground state bleach contributions in the employed probing range of Figure 11 and to the weak stimulated signal for both S1 and T1. Comparison to theory hence allows us to assign the retrieved spectral species of Figure 9 to relaxation out of the FC region of S1 (0.13 ps EADS), ISC to triplet states (0.4 ps), relaxation of hot triplet states (4 ps) and a long‐lived residual (>50 ps), which is attributable to the lowest lying triplet state T1 and its relaxation back to the ground state. The excellent agreement of the calculated triplet spectrum and the 4 ps EADS strongly suggests that the dissociation that is predicted by surface hopping calculations in the gas phase is not a large contributor to the dynamics of 2 in solution. The triplet spectra of 1 which would result from dissociation, were also calculated and do not match the observed EADS but are instead much more red‐shifted (see Figure S12).
Preliminary studies on photoreactivity. Our results indicate that it should be possible to involve enones in a photochemical Lewis acid‐catalyzed reaction upon proper selection of the irradiation wavelength. While complexation opens up additional relaxation pathways which avoid the photochemically relevant triplet state, these additional decay routes are non‐critical, as they lead back to the electronic ground state. Hence, there are no chemical by‐products and the complex remains in solution for further photocatalytic cycles. By appropriate choice of the excitation wavelength, it should therefore be possible to compensate for the loss of reactive excited state species by an increased absorption cross section.
In a preliminary study, we investigated whether the BF3 complex 2 is productive in photocatalysis. 2‐Cyclohexenone (1) was irradiated together with isobutene at a wavelength (λ=272 nm) at which the compound is transparent (see Figure 1). There was no detectable conversion after six hours (see section 7 of the SI for details). When the same reaction was performed in the presence of BF3⋅OEt2 (50 mol %) a steady conversion could be detected (see Figure S13). In the absence of light there was no reaction. This preliminary work supports the fact that the triplet state of 2 is productive in photocatalysis and suggests Lewis acid catalyzed photochemical reactions to be possible upon judicious choice of the irradiation wavelength.
Conclusion
In summary, we have investigated the small enone Lewis acid complex 2 by highly accurate quantum chemical methods and by state‐of‐the art ultrafast transient absorption spectroscopy in the UV‐range. The complex serves as a prototype to understand the influence of Lewis acid catalysts on the photochemistry of cyclic enones. The changes due to complexation were evaluated by comparison with the free enone 1. Regarding absorption in the UV/Vis spectrum, the Lewis acid induces a significant blue shift of the S1 state and increases its oscillator strength. The S1 state is almost dark for enone 1 but becomes bright for complex 2. The bright S2 state of the enone is red‐shifted by the Lewis acid and overlaps energetically with S1. While the enone decays from S1 completely to the triplet (nπ*) and (ππ*) states, the enone complex 2 passes conical intersections at which a decay to the ground state S0 is feasible. An alternative pathway allows the enone complex to populate the triplet T1(ππ*) state. Both the S1 and T1 state of complex 2 could be detected by transient absorption spectroscopy and it was shown that coordination to the Lewis acid is retained in T1. The latter observation is in line with the fact that chiral boron‐based Lewis acids induce a high enantioselectivity in the [2+2] photocycloaddition reaction of 2‐cyclohexenone. [26] Population of T1 occurs on a picosecond time scale which in turn suggests that this state is solely responsible for the photochemistry of the Lewis acid‐enone complex. Further synthetic studies are warranted to identify novel reaction pathways for Lewis acid‐enone complexes as compared to the known transformations of enones.
Conflict of interest
The authors declare no conflict of interest.
Supporting information
As a service to our authors and readers, this journal provides supporting information supplied by the authors. Such materials are peer reviewed and may be re‐organized for online delivery, but are not copy‐edited or typeset. Technical support issues arising from supporting information (other than missing files) should be addressed to the authors.
Supplementary
Acknowledgements
Financial support by the European Research Council under the European Union's Horizon 2020 research and innovation programme (grant agreement No 665951—ELICOS) is gratefully acknowledged. R.dVR and J.H. acknowledge funding by DFG under Germany's ExcellenceStrategy‐EXC 2089/1–390776260. D.P.S. thanks Studienstiftung des deutschen Volkes for a Ph.D. fellowship, S. Breitenlechner (TUM) for fruitful discussions and J. Kudermann (TUM) for his help with GLC analyses. Open access funding enabled and organized by Projekt DEAL.
M. T. Peschel, P. Kabaciński, D. P. Schwinger, E. Thyrhaug, G. Cerullo, T. Bach, J. Hauer, R. de Vivie-Riedle, Angew. Chem. Int. Ed. 2021, 60, 10155.
Contributor Information
Jürgen Hauer, Email: juergen.hauer@tum.de.
Regina de Vivie‐Riedle, Email: regina.de_vivie@cup.uni-muenchen.de.
References
- 1.
- 1a. Praetorius P., Korn F., Ber. Dtsch. Chem. Ges. 1910, 43, 2744–2746; [Google Scholar]
- 1b. Stobbe F. H., Färber E., Ber. Dtsch. Chem. Ges. 1925, 58, 1548–1553. [Google Scholar]
- 2.
- 2a. Shim S. C., Kim E. I., Lee K. T., Bull. Korean Chem. Soc. 1987, 8, 140–144; [Google Scholar]
- 2b. Ogawa T., Masui Y., Ojima S., Suzuki H., Bull. Chem. Soc. Jpn. 1987, 60, 423–425; [Google Scholar]
- 2c. Shim S. C., Lee S. S., Bull. Korean Chem. Soc. 1989, 10, 324–326. [Google Scholar]
- 3.Most recent contributions from the series:
- 3a. Lewis F. D., Barancyk S. V., Burch E. L., J. Am. Chem. Soc. 1992, 114, 3866–3870; [Google Scholar]
- 3b. Lewis F. D., Reddy G. D., Elbert J. E., Tillberg B. E., Meltzer J. A., Kojima M., J. Org. Chem. 1991, 56, 5311–5318. [Google Scholar]
- 4.
- 4a. Fukuzumi S., Okamoto T., Otera J., J. Am. Chem. Soc. 1994, 116, 5503–5504; [Google Scholar]
- 4b. Fukuzumi S., Satoh N., Okamoto T., Yasui K., Suenobu T., Seko Y., Fujitsuka M., Ito O., J. Am. Chem. Soc. 2001, 123, 7756–7766. [DOI] [PubMed] [Google Scholar]
- 5.For a recent review, see: Fukuzumi S., Jung J., Lee Y.-M., Nam W., Asian J. Org. Chem. 2017, 6, 397–409. [Google Scholar]
- 6.Recent reviews:
- 6a. Prentice C., Morrisson J., Smith A. D., Zysman-Colman E., Beilstein J. Org. Chem. 2020, 16, 2363–2441; [DOI] [PMC free article] [PubMed] [Google Scholar]
- 6b. Rigotti T., Alemán J., Chem. Commun. 2020, 56, 11169–11190; [DOI] [PubMed] [Google Scholar]
- 6c. Brenninger C., Jolliffe J., Bach T., Angew. Chem. Int. Ed. 2018, 57, 14338–14349; [DOI] [PMC free article] [PubMed] [Google Scholar]; Angew. Chem. 2018, 130, 14536–14547. [Google Scholar]
- 7. Guo H., Herdtweck E., Bach T., Angew. Chem. Int. Ed. 2010, 49, 7782–7785; [DOI] [PubMed] [Google Scholar]; Angew. Chem. 2010, 122, 7948–7951. [Google Scholar]
- 8. Du J., Skubi K. L., Schultz D. M., Yoon T. P., Science 2014, 344, 392–396. [DOI] [PMC free article] [PubMed] [Google Scholar]
- 9. Brimioulle R., Bach T., Science 2013, 342, 840–843. [DOI] [PubMed] [Google Scholar]
- 10. Blum T. R., Miller Z. D., Bates D. M., Guzei I. A., Yoon T. P., Science 2016, 354, 1391–1395. [DOI] [PMC free article] [PubMed] [Google Scholar]
- 11. Huang X., Quinn T. R., Harms K., Webster R. D., Zhang L., Wiest O., Meggers E., J. Am. Chem. Soc. 2017, 139, 9120–9123. [DOI] [PubMed] [Google Scholar]
- 12.
- 12a. Hu N., Jung H., Zheng Y., Lee J., Zhang L., Ullah Z., Xie X., Harms K., Baik M.-H., Meggers E., Angew. Chem. Int. Ed. 2018, 57, 6242–6246; [DOI] [PubMed] [Google Scholar]; Angew. Chem. 2018, 130, 6350–6354; [Google Scholar]
- 12b. Stegbauer S., Jandl C., Bach T., Angew. Chem. Int. Ed. 2018, 57, 14593–14596; [DOI] [PMC free article] [PubMed] [Google Scholar]; Angew. Chem. 2018, 130, 14801–14805; [Google Scholar]
- 12c. Stegbauer S., Jeremias N., Jandl C., Bach T., Chem. Sci. 2019, 10, 8566–8570; [DOI] [PMC free article] [PubMed] [Google Scholar]
- 12d. Ma J., Schäfers F., Daniliuc C., Bergander K., Strassert C. A., Glorius F., Angew. Chem. Int. Ed. 2020, 59, 9639–9645; [DOI] [PubMed] [Google Scholar]; Angew. Chem. 2020, 132, 9726–9732. [Google Scholar]
- 13. Leverenz M., Merten C., Dreuw A., Bach T., J. Am. Chem. Soc. 2019, 141, 20053–20057. [DOI] [PMC free article] [PubMed] [Google Scholar]
- 14. Poplata S., Bauer A., Storch G., Bach T., Chem. Eur. J. 2019, 25, 8135–8148. [DOI] [PMC free article] [PubMed] [Google Scholar]
- 15.
- 15a. Wang H., Cao X., Chen X., Fang W., Dolg M., Angew. Chem. Int. Ed. 2015, 54, 14295–14298; [DOI] [PubMed] [Google Scholar]; Angew. Chem. 2015, 127, 14503–14506; [Google Scholar]
- 15b. Wang H., Fang W.-H., Chen X., J. Org. Chem. 2016, 81, 7093–7101. [DOI] [PubMed] [Google Scholar]
- 16. Schuster D. I., Dunn D. A., Heibel G. E., Brown P. B., Rao J. M., Woning J., Bonneau R., J. Am. Chem. Soc. 1991, 113, 6245–6255. [Google Scholar]
- 17.
- 17a. García-Expósito E., Bearpark M. J., Ortuño R. M., Branchadell V., Robb M. A., Wilsey S., J. Org. Chem. 2001, 66, 8811–8814; [DOI] [PubMed] [Google Scholar]
- 17b. García-Expósito E., Bearpark M. J., Ortuño R. M., Robb M. A., Branchadell V., J. Org. Chem. 2002, 67, 6070–6077. [DOI] [PubMed] [Google Scholar]
- 18. Lee A. M. D., Coe J. D., Ullrich S., Ho M.-L., Lee S.-J., Cheng R.-M., Zgierski M. Z., Chen I.-C., Martinez T. J., Stolow A., J. Phys. Chem. A 2007, 111, 11948–11960. [DOI] [PubMed] [Google Scholar]
- 19. Schalk O., Schuurman M. S., Wu G., Lang P., Mucke M., Feifel R., Stolow A., J. Phys. Chem. A 2014, 118, 2279–2287. [DOI] [PubMed] [Google Scholar]
- 20. Cao J., Xie Z.-Z., Phys. Chem. Chem. Phys. 2016, 18, 6931–6945. [DOI] [PubMed] [Google Scholar]
- 21. Childs R. F., Mulholland D. L., Nixon A., Can. J. Chem. 1982, 60, 801–808. [Google Scholar]
- 22. El-Sayed M. A., Acc. Chem. Res. 1968, 1, 8–16. [Google Scholar]
- 23. Thallmair S., Kowalewski M., Zauleck J. P. P., Roos M. K., de Vivie-Riedle R., J. Phys. Chem. Lett. 2014, 5, 3480–3485. [DOI] [PubMed] [Google Scholar]
- 24. van Stokkum I. H. M., Larsen D. S., van Grondelle R., Biochim. Biophys. Acta Bioenerg. 2004, 1657, 82–104. [DOI] [PubMed] [Google Scholar]
- 25. Perlík V., Hauer J., Šanda F., J. Opt. Soc. Am. B 2017, 34, 430–439. [Google Scholar]
- 26. Poplata S., Bach T., J. Am. Chem. Soc. 2018, 140, 3228–3231. [DOI] [PMC free article] [PubMed] [Google Scholar]
Associated Data
This section collects any data citations, data availability statements, or supplementary materials included in this article.
Supplementary Materials
As a service to our authors and readers, this journal provides supporting information supplied by the authors. Such materials are peer reviewed and may be re‐organized for online delivery, but are not copy‐edited or typeset. Technical support issues arising from supporting information (other than missing files) should be addressed to the authors.
Supplementary


