

Abstract
Improved nitrogen (N) use is key to future food security and environmental sustainability. While many regions still experience N shortages, agriculture is the leading global emitter of N2O due to losses exacerbated by N surpluses in other regions. In order to sustainably maintain or increase food production, farmers and their advisors need a comprehensive and actionable understanding of how nutrient management affects both yield and N2O emissions, particularly in tropical and subtropical agroecosystems. We performed a meta‐analysis to determine the effect of N management and other factors on N2O emissions, plant N uptake, and yield. Our analysis demonstrates that performance indicators—partial N balance and partial factor productivity—predicted N2O emissions as well as or better than N rate. While we observed consistent production and environmental benefits with enhanced‐efficiency fertilizers, we noted potential trade‐offs between yield and N2O emissions for fertilizer placement. Furthermore, we observed confounding effects due to management dynamics that co‐vary with nutrient application practices, thus challenging the interpretation of the effect of specific practices such as fertilization frequency. Therefore, rather than providing universally prescriptive management for N2O emission reduction, our evidence supports mitigation strategies based upon tailored nutrient management approaches that keep N balances within safe limits, so as to minimize N2O emissions while still achieving high crop yields. The limited evidence available suggests that these relationships hold for temperate, tropical, and subtropical regions, but given the potential for expansion of N use in crop production, further N2O data collection should be prioritized in under‐represented regions such as Sub‐Saharan Africa.
Keywords: 4R, agriculture, balance, emissions, management, N2O, rice, subtropical, yield
Our findings show that, unlike many soil and climate variables, fertilizer management had consistent impacts on crop yields and N2O emissions with potential synergies and trade‐offs. Our evidence supports mitigation strategies based upon tailored nutrient management approaches that keep N balances within safe limits, so as to minimize N2O emissions while still achieving high crop yields. Practices that enhance partial factor productivity of N can result in lower N2O emissions for a given level of productivity and “shift” the exponential increase in N2O emissions as productivity increases.
1. INTRODUCTION
Nitrogen (N) is an essential nutrient in crop production that supports current and future human population. With the advent of the “Green Revolution” in the 1960s, crop yields—especially for cereals—increased substantially to support rising global food demand. This increased production was made possible through the introduction of high yielding crop varieties, accompanied by the availability and use of inorganic fertilizer, irrigation, and advanced mechanization (Zhang et al., 2015). For example, the world's population increased from 3 to 7.5 billion during 1960–2016, and fertilizer N consumption during this period increased by almost 10‐fold to an annual average of approximately 110 Tg N year−1 (Battye et al., 2017; Benbi, 2017). By 2008, inorganic N fertilizers fed up to 50% of the world's population (Erisman et al., 2008). Although N fertilizers have immensely contributed to human dietary needs, large areas of global cropland still lack sufficient available N for food and nutrition security (Ciceri & Allanore, 2019). Furthermore, with limited land available for agricultural expansion, more than 90% of future production growth is expected to come from higher yields and increased cropping intensity (FAO, 2009). With population pressure and increasing demand for animal‐based protein, future demand for N is expected to grow substantially to ensure sufficient food for more than 9.7 billion people by the middle of the 21st century (FAO, 2017).
This large addition of reactive N to the global ecosystem comes, however, with unintended environmental consequences since only about half of the global N fertilizer inputs are recovered in harvested yield (Lassaletta et al., 2014; Martinez‐Feria et al., 2018). The other half of the fertilizer N applied to crops remains in the environment, where it can contribute to climate change and water quality issues along with other environmental and human health externalities (Lassaletta et al., 2016). Surplus N may be lost from the soil‐plant system by denitrification in the form of dinitrogen (N2), nitrous oxide (N2O), and nitric oxide (NO), by ammonia (NH3) volatilization, or via nitrate () leaching and runoff (Bouwman et al., 2013). Of these, N2O emissions are of particular concern as it is an important greenhouse gas with global warming potential 265–298 times higher than that of CO2 in a 100 year‐time horizon, and it also influences stratospheric chemistry, depleting the ozone layer (IPCC, 2013; Yue et al., 2018). Agriculture is responsible for approximately 78% of global anthropogenic N2O emissions (Mbow et al., 2017), corresponding to 5%–6% of global greenhouse emissions (Smith et al., 2007). Projections of growing population and food demand, particularly in regions with current N shortages that will require greater N supply, suggest that without significant changes in the agriculture and the food system, agricultural emissions of N2O will continue to increase (FAO, 2017). A world kept within livable limits thus depends on scientists, farmers, and their partners to solve this challenge.
Numerous studies have shown that N2O emissions from agricultural soils increase with the application of N (Bouwman et al., 2002; Halvorson et al., 2011; Hoben et al., 2011). Excessive N fertilization reduces nitrogen use efficiency (NUE), as defined by N removed per unit of N applied, where the increase in surplus N is one of the most important causal factors for increased N losses (Billen et al., 2013; Bouwman et al., 2013). Fertilizer management practices such as the “right” source, timing, and placement (referred to collectively with the “right” rate as the “4Rs”) play a varied role in improving NUE—and reducing fertilizer‐induced N2O emissions (Fixen, 2020). Meta‐analyses of multiple field studies find that optimizing fertilizer N rate, source, and timing can reduce N2O emissions in maize (Zea mays) systems by up to 50% (Eagle et al., 2017). However, weather, soil, and other factors affect complex N cycling dynamics—which limit the evidence for consistent functional relationships among management practices, NUE, and N2O. For this reason, incentive programs and protocols for N2O emission reductions have generally focused on rate adjustments alone (Casellas et al., 2009; Eve et al., 2014; Millar et al., 2010; Niles et al., 2019). Prescriptive fertilizer rate reductions may not, however, maintain or improve productivity for field crops of high yield potential; acknowledge individual field and farm differences in climate, soil, equipment, and other resources; or encourage creative nutrient management problem‐solving by producers and their advisors.
Assuming steady‐state conditions in soil organic matter, a partial N balance (PNB) has been proposed as a robust proxy for the amount of N at risk of loss to the environment (McLellan et al., 2018). This PNB can be calculated from the same components as NUE (i.e., N outputs and N inputs), using basic yield and fertilizer data well known to producers. Reductions in excessive N balances can be achieved by rate adjustments or yield improvements that depend on good nutrient management. For example, Omonode et al. (2017) reported that optimal rate and timing of N fertilizer applications reduced N2O emissions most consistently under management that led to lower N balances through an increase in plant N uptake and grain N removal in North American maize‐based systems. Therefore, gains in plant N uptake or recovery efficiency will reduce the N balance, increase NUE, and contribute to reduced N2O emission during crop production (Omonode et al., 2017). On the other hand, the global increase in N inputs in crop production has been mostly coupled with a decrease in NUE, and a growing population and food demand in Asian and African regions with historically low input use and crop yields provide impetus to ensuring that future production gains simultaneously minimize negative environmental impacts (Zhang et al., 2015). While individual studies have observed improved yield, N recovery efficiency, and NUE with optimized N placement and timing in subtropical wheat (Triticum aestivum) and rice (Oryza sativa) cropping systems (Bijay‐Singh et al., 2015; Singh et al., 2014; Yadvinder‐Singh et al., 2015), evidence for optimal 4R management is particularly scanty and scattered for tropical and subtropical agroecosystems of Asia and Africa. Therefore, research efforts are needed to synthesize data on N management, metrics, and environmental outcomes to inform intervention for the cropping systems of these regions.
Our research objectives were to (i) relate changes in fertilizer management practices to yield and plant N uptake and (ii) then link these outcomes to N2O emissions from cereal and vegetable crop systems. Using up‐to‐date peer‐reviewed research evidence for Asia and Sub‐Saharan Africa, we examined the relationships among N management strategies, crop yields, and N2O emissions. We used a multilevel regression approach to model yield and N2O observations coming from different cropping systems, soil regimes, 4R management, and climates (Eagle et al., 2017). From these functional relationships, we calculated increases in yields as well as reductions in seasonal N2O emissions due to adjustments in fertilizer management and/or enhanced NUE. The results establish that performance indicators such as PNB and partial factor productivity (PFP) are robust, integrative, and relevant to management of N2O emission in programs of crop yield improvements in under‐represented regions such as Sub‐Saharan Africa, South Asia, and Southeast Asia.
2. METHODS
We based our analysis on two databases. The first was a publicly available N2O database (https://samples.ccafs.cgiar.org/n2o‐dashboard/) that underpins other previous analyses (Albanito et al., 2017; Yue et al., 2018). This first dataset is primarily focused on N2O emissions and has a global geographic extent, but it is limited in (i) yield and plant or grain N data and (ii) its representation in tropical and subtropical Asia and Africa. To fill these research gaps concurrently, we conducted a systematic review for this region prioritizing fertilizer management, yield, and N uptake data with and without measured N2O emissions. We then utilized the global dataset as a reference to assess the generalizability of our interpretations of climate, edaphic, and management impacts on N2O emissions which was important considering not all N management studies measure emissions (e.g., the degree to which the results of our study can be applied to a broader sample assembled independently).
2.1. Data compilation
Following the approach outlined by previous meta‐analyses (Eagle et al., 2017; 2020), we conducted advanced literature searches in the Web of Science database to identify soil science and agricultural articles related to N fertilization (using search terms for “agricult*,” “nitrogen,” and “fertili*). Specifically, we aimed to identify articles summarizing the findings from studies conducted in Asia and Sub‐Saharan Africa published from 2000 until August 2019. In this broad search, we retrieved 2895 publications. We then refined our search function to narrow down the list of papers using three approaches. In the first approach, we filtered sub‐searches for studies with “nitrous oxide” and “yield” topics from papers published from an exhaustive list of countries falling within Asia and Sub‐Saharan Africa. Second, not restricting studies to those reporting N2O emissions, we refined the search results to fertilizer management factors, including the “rate,” “time,” “place,” “source,” “form,” “4R,” “split application,” “basal,” “timing,” “top‐dress,” “side‐dress,” “subsurface,” “surface,” “broadcast,” “injected,” “fertilizer pattern,” “incorporation,” “fertilizer schedule,” “fall application,” “spring application”, and “NUE.” In our final approach, we refined the search to “N2O” and agronomic terms but did not restrict the search results to the exhaustive list of countries, and instead inspected the abstracts individually. In total, we imported 757 unique papers into an EndNote (Clarivate, Philadelphia, PA) library, from which we assessed the titles and abstracts. We discarded 394 papers that (i) did not contain original research (e.g., literature review); (ii) were not field‐based (e.g., greenhouse experiments, model simulations); (iii) did not pertain to N fertilizer management (e.g., no comparisons of rate, source, timing, or placement of fertilizer); or (iv) were not conducted in Asia or Africa. We then further examined the experimental design and the data for the remaining 363 papers. We compiled data from 160 studies that met the following criteria: (i) reported seasonal crop yield, crop N uptake, or cumulative direct N2O‐N emissions; (ii) included at least one comparison across treatments; (iii) reported application rates of inorganic and/or organic N; (iv) did not average across years unless the statistics indicated a lack of treatment and time interaction; and (v) did not sum multiple crops. Nitrogen input from biological N fixation was omitted due to being beyond the scope of the study. Additionally, N deposition was excluded as an input due to its lack of data reporting. Finally, we manually transcribed the data from tables or digitally retrieved values from graphs using the WebPlotDigitizer 4.0.0 software (Rohangi, 2020).
2.2. Database description
In total, we gathered 2661 data points/observations from 160 publications. We refer to this data from Asia and Sub‐Saharan Africa as the “Asia‐Africa” dataset (Table S1). The Asia‐Africa dataset has 133 unique locations (Figure 1), where a single location may serve as the site for more than one publication as indicated by the reported location or latitudinal and longitudinal coordinates. Certain publications also reported these data from more than one geographic location. In total, our final Asia‐Africa dataset contained 181 unique publication–location combinations, and 224 unique publication–location–crop “clusters”. Of these, the majority (67.4%) of the clusters were located in China. The rest were located in South Asia (22.3%), Sub‐Saharan Africa (6.3%), Southeast Asia (2.7%), and remainder in Japan, Iran, or Syria (1.3%). The majority of the clusters were located in the subtropics (54%), followed by those in the tropics (13%) and temperate regions (32%). Experimental years, if reported, ranged from 1998 to 2017, and more than half of the observations were collected between 2009 and 2014.
FIGURE 1.
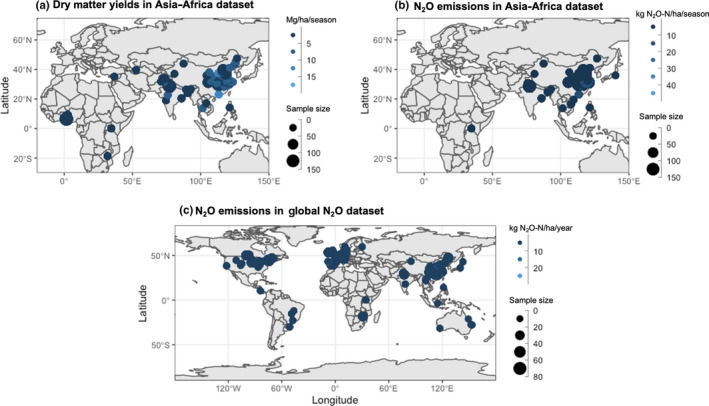
Crop yield (a) and N2O emissions (b) across specific study locations in the Asia‐Africa dataset and the Global N2O dataset (c)
In all, 31 studies (41 clusters, 350 observations) reported dry matter yield, plant N uptake (above‐ground), and cumulative N2O emissions. The remaining 129 studies did not report one or more of these three variables. Almost all studies reported yields (155 publications, 217 clusters, and 2462 observations). Of these studies, nine publications only reported fresh vegetable yields but not dry matter equivalents (nine clusters, 133 observations). In all, 100 studies reported cumulative seasonal N2O emissions (138 clusters and 1380 observations—not including six observations that only reported annual losses for dual crops), with the vast majority also reporting yield (95 studies, 125 clusters, and 1212 observations). Fewer studies reported plant N uptake (69 publications, 96 clusters, and 1052 observations), of which only 31 studies (42 clusters and 362 observations) also reported both plant N uptake and N2O emissions. Fewer reported data for harvested N (26 publications, 34 clusters, and 291 observations), with only 15 clusters including both harvested N and N2O. Nitrous oxide emission data were concentrated in China (>76% of clusters) and very limited outside of China (<24% of the clusters). It is also important to note that only one of the 31 studies reporting all three variables (i.e., N2O, dry matter yield, and N uptake) was conducted in Sub‐Saharan Africa, representing a large regional data gap.
We recorded additional metadata (when available) pertaining to crop, edaphic, climatic, management, and methodological factors. The crop factors included crop type, previous crop, residue management, and rotation. Edaphic factors (typically sampled within a 30 cm depth) included soil texture, soil pH, soil organic carbon (SOC) concentration, and total soil N concentration. Climatic factors included mean annual temperature (MAT), mean annual precipitation (MAP), seasonal experimental mean temperature, and seasonal experimental precipitation. Management factors included irrigation, tillage practices, and fertilizer management. For fertilizer management, we transcribed the N source (e.g., inorganic and/or organic; microbial inhibitors), timing (e.g., number and timing of applications), and placement (e.g., method of application). Urea was the primary source of synthetic fertilizer for more than 86% of observations, and so inorganic fertilizer categories were not disaggregated further. We also recorded the application rates of N fertilizer from synthetic sources as well as N rates associated with organic sources. Finally, we also noted methodological factors, such as replication, plot size, as well as N2O measurement method, duration, frequency, placement, and area.
2.3. Data gap filling and categorization
We only included studies in the database in which researchers explicitly defined and observed all data with the following exceptions: First, we estimated missing longitudinal and latitudinal coordinates based on location descriptions. Second, we extracted long‐term MAP and MAT and other bioclim data for specific location coordinates from the WorldClim database (Fick & Hijmans, 2017) using the Raster and sp packages in R (R Core Team, 2020). Third, we converted soil organic matter concentrations to SOC by dividing the former by the conversion factor of 1.72 (Van Bemmelen, 1890) and added 0.75 to adjust pH values measured in CaCl2 instead of water (Sanchez, 2019; Weil & Brady, 2017). Finally, we assumed yields were reported on a dry matter basis if the moisture content was not specified.
After filling in missing data, we grouped the observational‐level data into categories of crop, edaphic, climatic, management, and methodological factors (Supporting Information 1 part A, S1‐A). After categorization, we undertook data cleaning steps. First, we categorized one banana (Musa acuminata) study with “other row crops” because it did not fall within cereal or vegetable categories. We also removed two studies that reported the average of maize and wheat yields. In addition, we removed four unusual outliers with negative cumulative N2O emissions reported in a single study, considering that negative emissions were extremely rare in the dataset and likely attributable to instrumental noise rather than microbial processes (Cowan et al., 2014). Finally, we removed one study after geographic coordinates revealed that the study was conducted in Australia, which was outside our regional scope.
2.4. Generalizability and global reference dataset
One limitation to the generalizability of the Asia‐Africa database compiled from peer‐reviewed literature is a bias toward cropping systems in China and the subtropics. To overcome such a limitation, we accessed a publicly available global N2O database (https://samples.ccafs.cgiar.org/n2o‐dashboard/) to compare and contrast our model results, which draws from multiple sources and may help to reduce this bias. We call this data the “Global N2O” dataset (Table S2). We did not perform the systematic review of the literature nor data entry, and search criteria and filtering protocol are found elsewhere (Albanito et al., 2017; Yue et al., 2018). First, we filtered this dataset to select only row‐crops, cereals (including rice), and vegetable crops grown in mineral soils with additions of fertilizer not exceeding 1200 kg N ha−1 year−1. Next, we performed the same data categorization and cleaning steps as previously discussed for Asia‐Africa dataset. In total, the Global N2O dataset contained 2247 annual (rather than seasonal) N2O observations from 259 studies (296 unique publication–crop–location clusters). More than half of the clusters (55%) were located within Asia and Africa, predominantly in China (42% vs. 13% from Africa and other Asian countries). The rest were located in Europe (22%), North America (18%), South America (2.7%), and remainder in Australia (2%). The majority of the study sites were located in temperate regions (58%), followed by those in the subtropics (32%) and tropics (8%). Papers reported yield for less than 37% of clusters, and plant N uptake in even fewer clusters (7%). Experimental years, if reported, ranged from 1974 to 2015, and more than half of the observations were collected between 2007 and 2015. The Global N2O dataset included 37 studies in the Asia‐Africa dataset (Table S2), which resulted in an overlap for 39% of the clusters reporting N2O emissions in the Asia‐Africa dataset and an overlap for 23% of the clusters in the Global N2O dataset. Notably, our systematic review did not capture two suitable studies (both conducted in China) resulting in a 95% recovery rate.
2.5. Statistical analysis
We utilized a multilevel regression modeling approach to assess the impact of crop, edaphic, and management variables on the observed biological responses (e.g., N2O emissions, plant N uptake, or yield). Multilevel regressions are mixed‐effect models, which enable researchers to examine observations derived from different cropping systems, soil regimes, management, and climates (Eagle et al., 2017; Qian et al., 2010). At the observational level (i.e., level 1), the model can analyze the biological response to multiple continuous and/or categorical independent variables (i.e., predictors). Multilevel models also allow for random effects, permitting practitioners to cluster observations (i.e., level 2) for a given study that would otherwise violate the assumption of independence (Qian, 2017). Simply, we used a multilevel regression to allow for varying y‐intercepts among clusters, and then to quantify the coefficients for each predictor assuming a constant slope among clusters based on similar response functions at individual sites (Supporting Information 1‐B). Multilevel models can also handle unbalanced data (e.g., varying observations among clusters) by adjusting the the weight of clusters to account for variance or sample size.
A multilevel model can also include predictors at the observational level (level 1) and cluster level (level 2). The crop, soil, and climatic data generally vary among rather than within sites and studies (i.e., clusters, level 2). This distinction is important for management factors, which can vary both within and among studies. Therefore, we undertook additional categorization steps to distinguish between fertilizer management factors within a cluster (level 1, i.e., “treatments” or “within subject”) and among clusters (level 2, i.e., “fixed experimental elements” or “between subject”) to properly interpret the model coefficients. In all of the analyses, we confirmed with the intraclass correlation statistic that multilevel modeling is a valid and appropriate approach (Supporting Information 2‐1).
We designed our statistical procedure to address three main objectives, detailed in an analytical flowchart (Supporting Information 1‐C). Our first objective was to identify important climate, soil, and management factors to predict N2O. We performed all analyses on natural‐log transformed N2O data to satisfy the assumptions of a linear regression, which was evidenced by the large difference between the mean and median values. We did not mean center predictors given that we were not interpreting y‐intercepts in our analysis. We performed a backwards selection procedure using the step function in the lmerTest package (R Core Team, 2020) to identify significant level 1 or level 2 predictors for N2O emissions, yield, and plant N uptake. Predictors included crop type, latitude, MAT, MAP, irrigation, tillage, soil texture, clay percentage, soil pH, SOC content, measurement period (i.e., timeframe over which measurements were collected), and frequency of N2O measurements. We selected MAP as the predictor for precipitation because our preliminary indicated the other bioclim variables such as precipitation in the driest month, wettest month, coefficient of variation, wettest quarter, driest quarter, warmest quarter, and coldest quarter did not provide additional clarity to the model (Supporting Information 2‐1). We visually inspected each significant predictor in the final model always controlling for N rate (Supporting Information 2‐1).
When we evaluated the model, we observed non‐normal residuals and heteroscedasticity that violate the assumptions of a regression analysis. Therefore, we present data modeled with the rlmer function in the robustlmm package in R (R Core Team, 2020). This function is similar to the lmer function (lme4 package), but provides less biased estimates for skewed variables in order to overcome observed issues in our response variables such as long‐tailedness (Tanadini & Mehrabi, 2017). For robustness testing, we compared the rlmer modeling results with an lme (nlme package) function that allows for unequal variance across clusters to account for potential issues related to heteroscedasticity, but we settled on the rlmer approach because of the long‐tailedness of the residuals. We reran the final backwards‐selected model (Supporting Information 2‐1) to confirm that all selected predictors were significant in the robust model (i.e., rlmer).
Once we developed our base model, our second objective was to assess the response of seasonal N2O emissions (kg N ha−1 season−1) to inorganic and/or organic N application rate (kg N ha−1 season−1), PNB (kg N ha−1 season−1), or PFP of N (kg yield kg N−1 season−1). PNB can be expressed as a difference (Eagle et al., 2020) or index (Fixen et al., 2015) of crop N output from or to fertilizer inputs, which may or may not include straw N (EU Nitrogen Expert Panel, 2015; Omonode et al., 2017). In this study, we defined PNB as Equation (1), which has been used to estimate N surplus (van Groenigen et al., 2010) and factors in plant N uptake at harvest (as either reported by authors or calculated from stated above‐ground biomass and N concentration). We defined PFP by Equation (2) (Fixen et al., 2015). We compared the models by assessing marginal pseudo‐R 2 (mR 2), or variance explained by fixed effects; and conditional pseudo‐R 2 (cR 2), or the variance explained by both the fixed and random effects (Nakagawa & Schielzeth, 2013). Because the robust model does not correspond to likelihood, criteria to compare models such as Akaike information criterion are unavailable (Supporting Information 2‐2).
| (1) |
| (2) |
We further tested the effect of fertilizer management factors on N2O emission and crop productivity (Supporting Information 2‐3). Due to the diversity of experimental designs, and therefore missing data, we assessed fertilizer management factors individually on data subsets. Specifically, we tested the effects of fertilizer additives (i.e., enhanced efficiency fertilizer or EEF), the addition of organic fertilizers (i.e., animal manure or compost) with or without synthetic fertilizers, fertilizer placement (broadcasted or incorporated), and fertilization frequency (number of applications) on natural log transformed N2O emissions, crop yield, and plant N uptake. We then utilized the robust linear mixed model (rlmer) to assess the interactive effect of crop yield, N rate, and crop type on the natural log transformed N2O emissions. Finally, we regressed the predicted yield against the predicted N2O emissions controlling for N rate. However, we interpreted this last relationship as conceptual given missing N2O data in some studies.
For ease of interpretation, N2O emissions and modeled parameters were back‐transformed for the Figures (Supporting Information 1‐D). Because the raw data did not follow a normal distribution, we used the Smearing estimate formula provided by Tanadini and Mehrabi (2017). Accurately back‐transforming is critical given the large size of the datasets yet small number of large emission events that are nonetheless very important to identify and control. All analyses were performed in R (version 3.6.2) utilizing the R Studio interface (version 1.0.153).
3. RESULTS
3.1. Few soil, crop, or climatic factors consistently predicted N2O
Predictors such as site‐level factors (i.e., soil, crop, or climate characteristics) and N rate (or its derivatives of PNB and PFP) failed to explain the majority of the variance in N2O emissions, with mR 2 values of 46% or less (Figure 2). In contrast, experimental clusters (i.e., our random effect) explained 43%–58% of the variance due to unquantified or random differences between studies and sites, resulting in cR 2 ranging from 88% to 95%. Of the 11 site‐level predictors, only crop system type (i.e., paddy rice) and SOC were consistently significant in increasing N2O emissions while controlling for N rate, in the Asia‐Africa dataset (Figure 2a) and the Global N2O dataset (Figure 2b). In the Asia‐Africa dataset, rice systems had 71% lower N2O emissions than maize systems while emissions increased by almost 5% per unit increase in SOC (%) for a given N rate. Comparatively, rice systems had 57% lower emissions than other cereals in the Global N2O dataset while emissions increased by 19% per unit increase in SOC (%). Each dataset also had factors that were significant but not generalizable. MAT and MAP were significant in the Asia‐Africa dataset but were positively and negatively correlated with emissions, respectively (Figure 2a). In contrast, absolute latitude and study duration (e.g., N2O measurement period) were significant predictors for the Global N2O emissions that were also positively and negatively correlated with emissions, respectively (Figure 2b).
FIGURE 2.
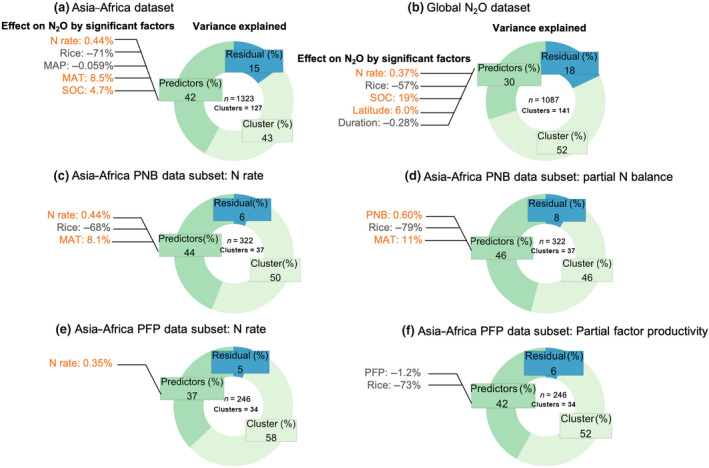
Donut charts illustrating the percentage of variance explained by fixed factors (predictors, mR2) and random effects (clusters, cR2 minus mR2) for (a) Asia‐Africa dataset (ASSA), (b) global N2O dataset; partial N balance (PNB) subset predicted by (c) N rate or (d) PNB; and partial factor productivity (PFP) subset predicted by (e) N rate or (f) PFP. Sample size (n) and cluster numbers are specified for each underlying analysis. The effect of significant factors is presented to the left of each chart, where percentages represent the change in N2O emissions per unit increase in each factor (e.g., % change in N2O emissions per 1 kg per ha, per °C of mean annual temperature [MAT], per mm of mean annual precipitation [MAP], per % of soil organic carbon [SOC], per day of the duration of N2O measurement period, per absolute degree latitude, or for rice cropping instead of maize). Factors in orange increase N2O emissions, whereas those in gray decrease emissions. Fertilizer N rate, rice cropping, and SOC were the only generalizable factors, and the effect of MAP and N2O measurement period were counter to theory
3.2. PNB predicted N2O emissions as well as or better than N rate
Fertilizer N rate was a significant predictor of N2O emissions, which had similar impacts on N2O emissions in both the Asia‐Africa and Global N2O datasets (Figure 2a,b). Our analysis estimated that N2O emissions increased by approximately 0.4% for each additional 1 kg of N ha−1. Our comparisons between N rate versus PNB (Figure 2c,d) and N rate versus PFP metrics (Figure 2e,f) in the Asia‐Africa dataset indicated that these metrics were also significant factors and performed as well or better as N rate at predicting N2O emissions. Specifically, N2O emissions increased with increasing PNB but decreasing PFP. More N2O variance was explained by models that included PNB (mR 2 = 46%) or PFP (mR 2 = 42%) as fixed factors rather than N rate (mR 2 = 44% and 37%, respectively). However, this advantage did not persist when including random effects (cR 2). Of particular interest, the predicted regression models for PNB and N2O emissions were more similar among vegetables, maize, and wheat crops (Figure 3b) than estimates based on N rate (Figure 3a), which may provide an opportunity to apply a common equation relating the PNB and N2O losses across multiple crop types. In contrast, PFP was a performance indicator that differentiated among crop types (Figure 3c).
FIGURE 3.
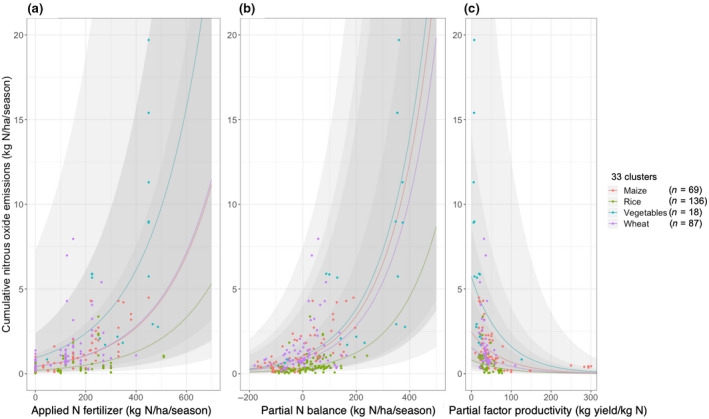
Cumulative N2O emissions predicted by crop type and (a) fertilizer N rate, (b) partial N balance, and (c) partial factor productivity of N. Lines represent predicted values from fixed effects in multilevel regression models (ignoring random effects), and shaded gray areas represent 95% confidence intervals in observational level predictions also considering the uncertainty in the variance parameters. Data points represent observed values in Asia‐Africa dataset
3.3. Fertilizer management affects N2O emissions
Predictors such as fertilizer management significantly impacted N2O emissions when controlling for N rate and other significant factors. We examined fertilizer management on the observational‐level (level 1, i.e., management varied within clusters) and site‐level factors (level 2, i.e., management varied between clusters). Fertilizer management was only consistently significant on the observational level (Supporting Information 2‐3), and so we present data for our level 1 analysis. EEFs decreased N2O emissions by 24% for a given N rate in the Asia‐Africa (Figure 4a) across maize, rice, vegetable, and wheat season (Figure 4b). These results were also observed in the Global N2O dataset (Figure 4c) for annual cropping of rice, other cereals, row crops, and vegetables (Figure 4d). The addition of organic or integration of organic/mineral fertilizers (largely through the application of manure) resulted in a significant 7.5% increase in N2O emissions in the Asia‐Africa dataset (Figure 5a) compared to mineral fertilizers alone, but this effect was small in magnitude (Figure 5b) with no differences detected in Global N2O emissions (Figure 5c) across the various cropping systems (Figure 5d). Non‐surface placement did not have a significant effect in the Asia‐Africa dataset but increased N2O emissions in the Global N2O dataset (data not shown, Supporting Information 2‐5).
FIGURE 4.
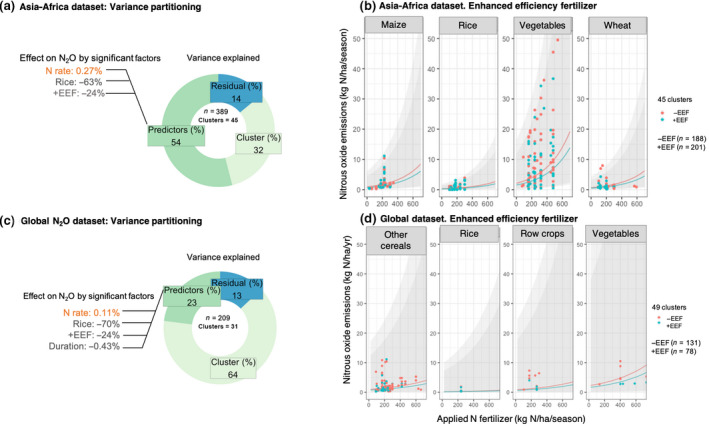
The effect of soil and climatic factors and various fertilizer management with (+EFF) and without enhanced efficiency fertilizers (−EFF) on (a) the percentage of variance explained by fixed factors (predictors) and random effects (clusters) in the Asia‐Africa dataset, (b) across maize, rice, vegetable, and wheat cropping seasons in the Asia‐Africa dataset, (c) the percentage of variance explained by fixed factors (predictors) and random effects (clusters) in the global dataset, and (d) across other cereals, rice, row crops, and vegetables in the global dataset. Sample size (n) and cluster numbers are specified for each underlying analysis. The effect of significant factors are presented to the left of each chart, where percentages represent the change in N2O emissions per unit increase in each factor (e.g., % change in N2O emissions per kg of N applied, for rice crops instead of maize, application of an EEF, and day of the experimental duration). Factors in orange increase N2O emissions, whereas those in gray decrease emissions. Data points represent observed values in bothdatasets, and shaded gray areas represent 95% confidence intervals in observational level predictions also considering the uncertainty in the variance parameters. The effect of N2O measurement period was counter to theory
FIGURE 5.
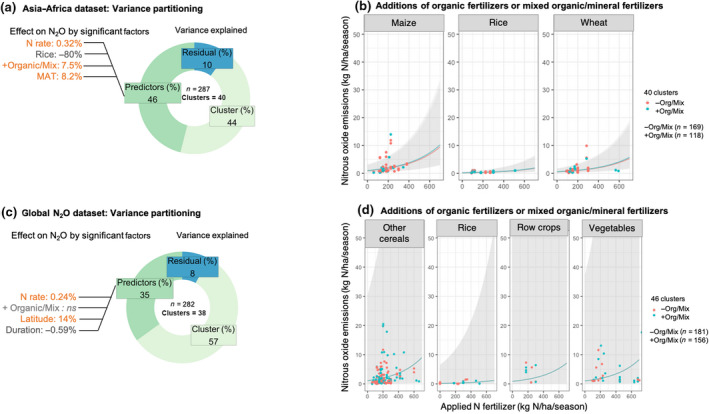
The effect of soil and climatic factors and various fertilizer management with organic N sources or mixture of organic and synthetic sources (+Org/Mix) or synthetic sources (−Org/Mix) on (a) the percentage of variance explained by fixed factors (predictors) and random effects (clusters) in the Asia‐Africa dataset, (b) across maize, rice, vegetable, and wheat cropping seasons in the Asia‐Africa dataset, (c) the percentage of variance explained by fixed factors (predictors) and random effects (clusters) in the Global N2O dataset, and (d) across other cereals, rice, row crops, and vegetable cropping years in the global dataset. Sample size (n) and cluster numbers are specified for each underlying analysis. The effect of significant factors is presented to the left of each chart, where percentages represent the change in N2O emissions per unit increase in each factor (e.g., % change in N2O emissions per kg of N applied, for rice crops instead of maize, application of an Org/Mix, and day of the experimental duration, per °C of mean annual temperature [MAT], and per degree latitude). Factors in orange increase N2O emissions, whereas those in gray decrease emissions. Data points represent observed values in the datasets, and shaded gray areas represent 95% confidence intervals in observational level predictions also considering the uncertainty in the variance parameters. The effect of N2O measurement period was counter to theory
3.4. Fertilizer management is dynamic and potentially confounded
Nitrous oxide emissions increased with increasing number of fertilizer applications in the Asia‐Africa dataset (Figure 6a). Upon further inspection of the experimental data, we noted that the fertilizer source and number of applications were often confounded (i.e., fewer number of applications of fertilizer treated with EEFs or organic amendments; Figure 6b). Fertilization frequency had little to no effect on emissions when the same type of fertilizer was added more frequently in both datasets (Figure 6c). Thus, only when the frequency of applications and type of fertilizer were confounded, N2O emissions significantly increased with more frequent applications of largely untreated N fertilizers or synthetic fertilizers alone (Figure 6d). We observed the same patterns in the global dataset (Figure 7a–d). These findings are particularly salient in our efforts to isolate the impact of 4R management and highlight the need for meta‐analyses to specify whether (i) management comparisons co‐varied rate, timing, source, and/or placement; and (ii) 4R management differed within studies or among studies when assessing impact of management on N2O emissions (i.e., observational level or site level).
FIGURE 6.
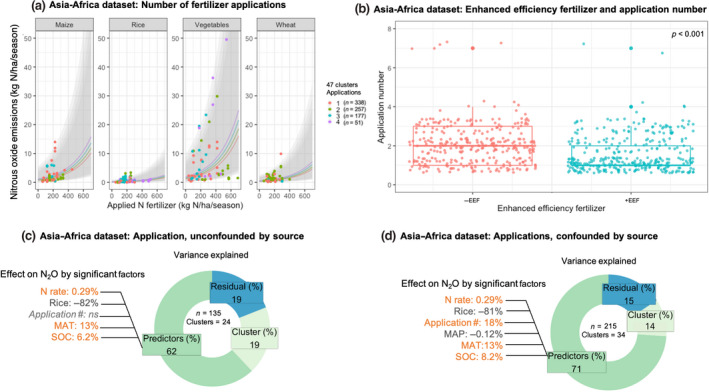
The effect of soil and climatic factors and various number of fertilizer application in the Asia‐Africa dataset on (a) N2O emissions in maize, rice, vegetable, and wheat cropping seasons, (b) boxplots for differences in the number of fertilizer additions between non‐enhanced efficiency fertilizer (EEF) fertilizer and EEF‐treated fertilizers (p < 0.001), (c) the percentage of variance explained by fixed factors (predictors) and random effects (clusters) with number of applications unfounded by source, (d) the percentage of variance explained by fixed factors (predictors) and random effects (clusters) with number of application confounded by source. Sample size (n) and cluster numbers are specified for each underlying analysis. The effect of significant factors is presented to the left of each chart, where percentages represent the change in N2O emissions per unit increase in each factor (e.g., % change in N2O emissions per kg of N applied, for rice crops instead of maize, number of applications, per °C of mean annual temperature [MAT], per mm of mean annual precipitation [MAP], and per % soil organic carbon [SOC]). Factors in orange increase N2O emissions, whereas those in gray decrease emissions. Data points represent observed values in the Global N2O dataset, and shaded gray areas represent 95% confidence intervals in observational level predictions also considering the uncertainty in the variance parameters. The effect of MAP was counter to theory
FIGURE 7.
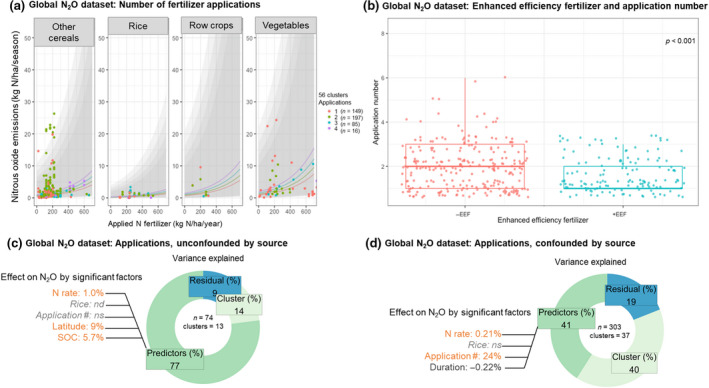
The effect of soil and climatic factors and various number of fertilizer application in the global dataset on (a) N2O emissions in other cereal, rice, row crop, and vegetable cropping years, (b) boxplots for differences in the number of fertilizer additions between non‐enhanced efficiency fertilizer (−EEF) fertilizer and EEF‐treated fertilizers (+EEF) (p < 0.001), (c) the percentage of variance explained by fixed factors (predictors) and random effects (clusters) with number of applications unconfounded by source, (d) the percentage of variance explained by fixed factors (predictors) and random effects (clusters) with number of application confounded by source. Sample size (n) and cluster numbers are specified for each underlying analysis. The effect of significant factors is presented to the left of each chart, where percentages represent the change in N2O emissions per unit increase in each factor (e.g., % change in N2O emissions per kg of N applied, for rice crops instead of other cereals, number of applications, per % soil organic carbon [SOC], per day of the experimental duration, and per degree latitude). Factors in orange increase N2O emissions, whereas those in gray decrease emissions. Data points represent observed values in the Global N2O dataset, and shaded gray areas represent 95% confidence intervals in observational level predictions also considering the uncertainty in the variance parameters. The effect of N2O measurement period was counter to theory
3.5. Fertilizer management affects crop productivity sometimes differently than N2O
Due to data limitations in the Global N2O dataset, our productivity analysis was restricted to the Asia‐Africa dataset. Based on the nonlinear relationship between N rate and productivity (Supporting Information 2‐4), we selected a quadratic function to fit the data. We found that crop yields and plant N uptake increased with EEFs, N rate, and more frequent fertilization (Figure 8) as well as non‐surface placement (data not shown) until reaching a maximum prior to a potential decline. Thus, our analysis highlights potential synergies and trade‐offs between N2O emissions and crop productivity. We observed co‐benefits for the use of EEFs, where N2O emissions decreased (Figure 4) while increasing yields (Figure 8a) and N uptake (Figure 8c), thereby reducing PNB. In contrast, we observed little co‐benefits—or even potential trade‐offs—for the number of applications (Figure 8b,d). Specifically, more frequent applications of fertilizer had a very small but significantly positive effect on yields and plant N uptake, which did not correspond with reductions in N2O emissions (Figures 6 and 7). Furthermore, non‐surface placement of fertilizer also increased yields and plant N uptake (Supporting Information 2‐4) despite having inconsistent and largely insignificant effect on N2O emissions (Supporting Information 2‐3). These findings highlight the challenges to teasing out overarching impacts of narrowly focused fertilizer management decisions (i.e., focus only on a single “R”) and may even expose potential trade‐offs related to pollution swapping if reductions in N2O emissions are not coupled with an increase in N uptake by plants through a holistic, adaptive 4R management approach that target multiple loss pathways.
FIGURE 8.
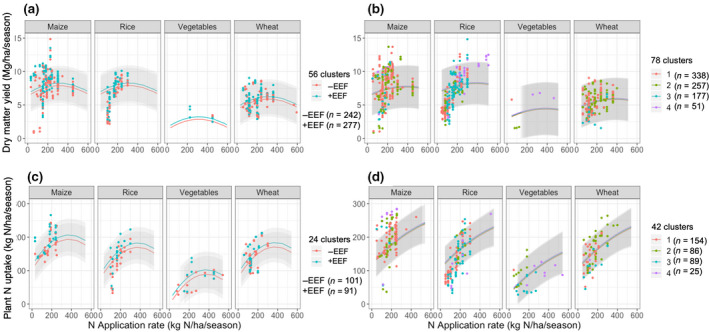
Effect of fertilizer management on yield (a, b) and plant N uptake (c, d) in the Asia‐Africa dataset. Fertilizer management strategies included increasing N rate with the use of enhanced efficiency fertilizers, or EEFs (a, c), or more frequent application (b, d). Lines represent predicted values from fixed effects in multilevel regression models (ignoring random effects). Data points represent observed values, and shaded gray areas represent 95% confidence intervals in observational level predictions also considering the uncertainty in the variance parameters.
3.6. Crop productivity and N2O emissions interact
We observed a significant interaction between N rate and productivity on N2O emissions in the Asia‐Africa dataset (Supporting Information 2‐4). In the model that allowed for the interaction between crop and N rate, higher yields were associated with a lesser N2O losses for a given rate of fertilizer, as N2O emissions increased with N rate (Figure 9, n = 967, 96 clusters). This is particularly apparent at higher N rates (>200 kg N ha−1 season−1), which for lower yielding cereal crops likely represent excessive fertilization. The tension between N management and productivity on N2O emissions is conceptually illustrated in Figure 10, where we regress predicted yields and predicted emissions using the model coefficients from the N2O (Figure 4) and yield (Figure 8) models based on significant predictors (allowing for missing N2O emission data). The predicted N2O emissions increased exponentially as yields approach their maxima. With regard to N rate, this relationship implies that emissions increased as yield gains declined with each incremental increase in N input due to growing inefficiencies of N use. However, in this range, EEFs appear to “shift” the curve to achieve greater yields and lower emissions than crops fertilized with non‐EEFs (Figure 10 insets). Importantly, the exponential increase in N2O emissions is driven by excessive N rates; however, better efficiencies may lead to greater yield gains under lower N2O emissions for crops fertilized with EEFs.
FIGURE 9.
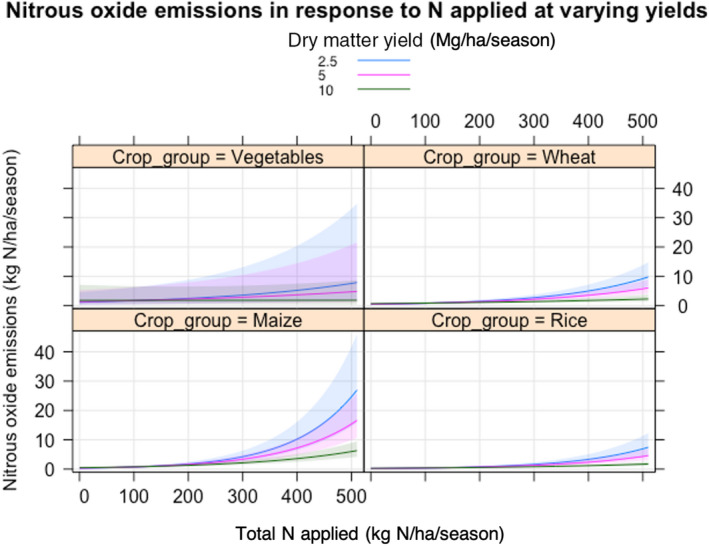
Examining the impact of improved agronomic performance (e.g., higher yields) on N2O emissions for a given level of N application (n = 967, 96 clusters). Lines represent predicted values from fixed effects in multilevel regression models (ignoring random effects) for the Asia‐Africa dataset, and shaded area represents 95% confidence bands
FIGURE 10.
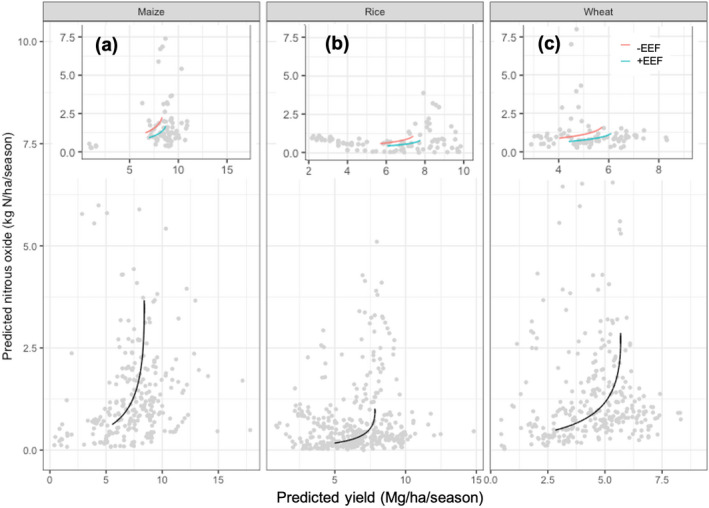
Conceptual productivity thresholds for N2O emissions with effects of enhanced efficiency fertilizers, or EEFs (insets) for maize (a), rice (b), and wheat (c). Lines represent predicted values (0–350 kg N applied ha−1 season−1) from fixed effects in multilevel regression models (ignoring random effects). Light gray data points represent observed values
4. DISCUSSION
4.1. Lack of consistency among site‐level N2O predictors
A wealth of literature indicates that N2O emissions vary widely depending on edaphic factors such as texture, pH, water filled pore space, soil ammonium or nitrate levels, SOC; environmental conditions such as climate type, temperature, and precipitation; as well as management and experimental factors such as crop type, irrigation, and timeframe of N2O observations (Albanito et al., 2017; Cayuela et al., 2017; Eagle et al., 2020; van Lent et al., 2015; Liu et al., 2017; Rochette et al., 2018; Sapkota et al., 2020; Stehfest & Bouwman, 2006). Other than N rate, some of these previous studies identified that fertilizer source also influences N2O emissions. In our analysis, N rate (and its derivatives), crop type, and SOC were the only generalizable factors to consistently explain the variance in N2O emissions. These findings were expected (Eagle et al., 2020). For instance, NH3 (and methane) emissions are a greater concern in flooded systems given that urea or manure (or another ammonium‐based nutrient source) is the preferred for plant uptake (Wang et al., 1993) in environments with slow rates of nitrification and higher risk of denitrification losses in anaerobic zones.
Although additional factors were important in other studies (Eagle et al., 2020; Liu et al., 2017; Stehfast & Bouwman, 2006), the effects of other factors were at times not significant, not generalizable, or even unexpected according to theory. Furthermore, we also found no clear agreement on other minimal parameters needed to explain the majority of variance in N2O emissions. Instead, we attributed the majority of the variation in emissions to undetermined randomness associated with experimental‐location differences. This lack of consistency among predictors is common in the literature, highlighting the difficulties to adequately account for variability of N2O emissions across contrasting locations and systems in our models (Albanito et al., 2017).
Given that climate and soil factors impact N2O emissions, such discrepancies expose the limitations of global and inter‐continental datasets based on hundreds of studies to develop localized estimates. First, it is possible that the quality of the predictor data, as well as differences across studies, may impact the variance explained by these predictors. For instance, we used MAP in the analysis to fill missing data and standardize across sites. However, predictors that incorporate seasonal precipitation quantities and intensity relative to N2O measurements, or even an indicator for nitrate intensity coupled with the duration of anaerobic conditions, would likely explain more variance. Furthermore, the negative correlation between MAP and N2O in the Asia‐Africa dataset is theoretically unexpected, and we were unable to tease out any interactions with other factors such as irrigation or crop (Supporting Information 2‐1).
Second, databases may include differences in the length of measurement periods for cumulative flux estimates within a season or even a year. For instance, we collected seasonal data in the Asia‐Africa dataset, whereas the data in the Global N2O dataset were annualized. This may have important implications for double‐cropped systems or those with prolonged fallow. Furthermore, both datasets included studies that collected N2O data only partly within a crop season and studies that continued data collection during fallow periods. However, also contrary to theory, the length of N2O measurement periods was negatively correlated with emissions in the Global N2O dataset. While we were unable to explain this unexpected relationship, it seems to be possibly driven by interactions with cropping systems (Supporting Information 2‐5).
Third, because of the large geographic scale of the datasets, we may have inconsistent interactions between the measured parameters and the true parameters of interest, which limits our ability to explain variance. In other words, correlations among variables may not be consistent across contrasting environments. Management may confound environmental variables, where the high use of irrigation in the Asia‐Africa studies may mask or confound effects of climate variables such as rainfall. Therefore, to be meaningful, our study supports broader effort to incorporate soil and climate factors in regionally focused Intergovernmental Panel on Climate Change (IPCC) Tier 3 protocols with efforts to thoroughly record meta‐data and key factors.
4.2. An integrative approach is needed
Many countries within tropical and subtropical regions rely on the IPCC Tier I protocol for N2O inventory which assumes that N2O emissions increase by 0.01 kg N2O‐N per kg of N fertilizer applied. While this is the dominant paradigm, our findings demonstrate that a PNB indicator performs as well or better than N rate when predicting N2O emissions in a wide assemblage of agroecosystems. Importantly, the N balance approach incorporates productivity, and our analysis provides new evidence that increasing N uptake is associated with reducing N2O emissions for a given N rate. This is likely because greater plant N recovery decreases the amounts of inorganic N available to nitrifying and denitrifying bacteria. The N balance approach may act as an integrating metric to evaluate suites of adaptive 4R practices that work together to tighten the N cycle in a cropping system—certainly including but not exclusive to N rate adjustments. We recommend the broader use of this metric beyond North America and in other production systems of other regions. However, we acknowledge one caveat to this approach is the availability of the information with which farmers have to calculate their application rates, yields, and N concentration. Despite PNB being the predictor of N2O emissions, only 31 of the 100 N2O studies provided enough data to calculate PNB based on N uptake (and even less for harvested N). In the absence of plant or grain N data, PFP may be a more widely measurable indicator. Second, while a relatively lower PNB or higher PFP is indicative of better agronomic performance, a negative N balance is undesirable to prevent soil nutrient mining. Thus, PNB and PFP must be interpreted within the context of inputs and yield.
4.3. 4R fertilizer management considers potential trade‐offs or confounding effects
An alternative approach may be to assign N2O emission reduction coefficients to specific 4R nutrient management practices. Aside from N rate, fertilizer source is often considered an important predictor of N2O emissions (Albanito et al., 2017). However, a clear understanding of other fertilizer management considerations, such as timing and placement, has yet to emerge from the literature. Given that urea was the predominant fertilizer source in the Asia‐Africa dataset, we examined the effects of EEFs and organic inputs. In confirmation with previous reports in the literature, we found the use of EEFs (e.g., urease inhibitors, nitrification inhibitors, neem, or polymer coated urea) reduced N2O emissions. The current finding of a reduction of 24% falls within the range reported by other meta‐analyses, where nitrification inhibitors alone or combined with urease inhibitors reduced N2O emissions by 8%–100% (Eagle et al., 2017; Lam et al., 2017; Li et al., 2018; Qiao et al., 2015; Snyder et al., 2009; Thapa et al., 2016; Xia et al., 2017). Unlike other predictors, EEFs appear to have a consistent effect under a range of conditions and thus generalizable. For example, Li et al. (2018) reported that EEFs consistently decreased emissions across different land uses, climatic conditions, and for a range of soil texture and pH; while Thapa et al. (2016) found reductions in corn and wheat systems across a range of soil pH and texture, under rainfed or irrigated conditions; when broadcasted or banded; and under tilled and no‐tilled conditions. However, we must acknowledge that urease inhibitors alone may not be always effective at reducing N2O emissions (Akiyama et al., 2010; Li et al., 2018; Thapa et al., 2016).
With regard to organic fertilizer inputs, we found that the inclusion of organic sources (mostly from manure) with or without synthetic fertilizers slightly increased N2O emissions relative to mineral fertilizers when controlling for N rate in the Asia‐Africa dataset but not in the Global N2O analysis. While Decock (2014) also found higher emissions associated with manure additions, the most recent IPCC (2019) refinements assigned similar emission factors to synthetic and mixed fertilizers but lower emission factors to organic amendments alone (IPCC, 2019). Another meta‐analysis determined that substituting manure for synthetic fertilizer had no impact on N2O emissions (Xia et al., 2017), while a third study measured no impact of manure on emissions at the same N balance (defined as N fertilizer minus grain N offtake) when controlling for SOC (Eagle et al., 2020). Therefore, our analysis adds more complexity to the literature, and questions the generalizability of specific emission factors based on organic versus synthetic sources.
The impacts of fertilizer timing and placement on N2O emissions remain inconclusive in our analysis, and thus we cannot recommend universally prescriptive timing and placement for N2O emission reduction. This finding underscores that 4R management is an adaptive management framework that considers the site‐specific efficacy of the selected practices for a range of relevant sustainability outcomes, and thus should not be reduced to specific timing and placement options (Fixen, 2020). While we found that increasing the number of fertilizer applications (controlling for N rate) did not necessarily reduce N2O emissions despite small but significant improvements in yield, we also identified a major caveat in 4R meta‐analyses. Many of the experiments in both datasets were not designed to isolate the impacts of timing, and treatment designs often confounded source and timing. For instance, researchers often apply polymer coated urea once versus a split application of urea. We found that more frequent applications of mineral fertilizers (i.e., removing observations confounded by EEF or integrated with organic N additions mostly from animal manure) had little to no significant effect on N2O emissions both within and across locations. Conceivably, from a crop management perspective, frequent applications are more feasible on sandier soils to reduce leaching losses in fields that are accessible by equipment (i.e., less saturated soils). While texture was not an important factor in our analysis, studies in Canada indicate very strong effects of soil texture on N2O emission (Liang et al., 2020; Rochette et al., 2018). Alternatively, Huang et al. (2016) reported increases in yield and reductions in NH3 volatilization with split applications, which may contribute to pollution swapping if crop recovery is low. In their meta‐analysis, Fernandez et al. (2020) reported that later applications of fertilizer in maize improved yields only for plants with heightened N uptake during the reproductive stages. While Eagle et al. (2017) determined that a side‐dress application in corn systems decreased N2O emissions, Omonode et al. (2017) found that emissions were higher with later side‐dress applications. Thus, rather than focus on specific fertilizer management strategies, we can instead select from a suite of practices that reduce high N balances (Omonode et al., 2017).
Our results highlight the need to consider potential trade‐offs among N loss pathways. In our analysis, subsurface placement of fertilizer did not mitigate N2O emissions in agreement with observations in North American maize‐based systems (Eagle et al., 2017). This finding may be surprising because subsurface application increased yields and is generally considered a best management practice (Nkebiwe et al., 2016). Thus, this further highlights the need to acknowledge that the isolated fertilizer management impacts on N2O emissions and yield are not always necessarily negatively correlated and thus an integrated approach is needed. While the mechanism for this trade‐off has not been systematically explored, it is possible that pollution swapping between NH3 volatilization and N2O emissions may also be driving these observed relationships (Drury et al., 2017), especially considering that a previous meta‐analysis reported that deep placement of fertilizer reduced NH3 volatilization (Huang et al., 2016). This pathway may be particularly important in the Asia‐Africa dataset given that urea was the primary fertilizer source. Furthermore, trade‐offs between these two loss pathways have also been observed with the use of nitrification inhibitors despite consistent yield improvements (Li et al., 2018; Pan et al., 2016; Qiao et al., 2015). Presumably, a reduction of NH3 volatilization could lead to greater N2O emissions (or other downstream losses if the inorganic N is not immobilized by microbes or plants), particularly if rates are not adjusted in response to increased N use efficiencies.
4.4. Improved productivity plays an important role in high input systems
A novel aspect of our study is that we explored the relationships between N2O emissions and yield with increasing N rate, which is largely lacking in the literature. Our findings support the development of locally adapted suites of 4R practices that reduce PNB (and reduce losses). We found that (i) N rate reduction and (ii) the use of EEFs are both critical 4R strategies to optimize PNB. This is because any N applied in excess of crop removal is at risk of loss, with greater risk associated with high N balances. While we provide clear evidence supporting optimal N inputs and the use of EEFs, we recommend that any N rate reduction strategy also factors in yields. In regions already characterized by excessive N use without likely yield improvements through better agronomy, reducing N rate is clearly the best option to mitigate N2O losses assuming other yield limiting factors must be resolved (e.g., non‐nitrogen‐related growth limitations). While a high N balance—with high N2O emissions—is mitigated by reducing N application rates, doing so without sacrificing yield may be only possible with other management changes that better synchronize N availability with plant demand. On‐farm data from the USA Corn Belt have shown that neighboring fields in the same soil‐climate zone, at the same N rate, experience wide yield variability in a given year (McLellan et al., 2018). Therefore, understanding the management differences could help growers identify changes that may improve productivity and fine‐tune N rates on a field or sub‐field scale while also reducing N balances. In other words, we should aim for reducing N balance either by reducing N rate with the same yield level or by increasing the yield with the same N rate.
In regions with low N use, negative N balances, and high yield gaps due to imbalanced fertilization, we recommend holistic strategies that improve yields but prevent high N balances (and N2O losses) with system improvements that must include increasing N inputs. The avoidance of excess N is critical given that increasing fertilizer N rates from 50 to 150 kg ha−1 season−1 is projected to increase N2O emissions in the tropics by 30% (Huddell et al., 2020) and by as much as 55% in our regional assessment of Asia and Sub‐Saharan Africa. Ultimately, in the N‐limited scenario, optimization of N rate relative to yield and fertilizer management is critical. Conceptually, N2O emissions increase exponentially once some productivity threshold is attained (Figure 11). This finding is in accordance with the law of diminishing returns, where N2O emissions increased as yield gains declined with each incremental increase in N inputs. In this conceptual model, the application of EEFs increased yields (and N uptake, data not shown) but decreased N2O emissions. In lower yielding systems, EEFs resulted in lower N2O emissions for a given level of productivity. As productivity increased, yield gains continued under lower N2O emissions for crops fertilized with EEFs, thus “shifting” the exponential increase in N2O emissions to higher yield levels. Further yield gains through crop selection and irrigation can continue to “shift” and improve NUE in higher yielding systems via concomitant increases in both yields and NUE (Zhang et al., 2015). Therefore, we conclude that fertilizer management strategies that increase NUE, and thus optimize N balance, will be particularly critical to abate or even avoid the exponential increases in N2O emissions as yields approach optimization with adequate N supply. This concept may even extend to agronomic practices with potential trade‐offs, such as increased frequency of fertilizer applications, where more rapid plant growth may partially reduce excessive levels of inorganic N in soil available for microbial transformation to N2O in higher‐producing systems. Therefore, we recommend adopting an N balance approach toward selecting a combination of fertilizer management practice and technology packages (e.g., breeding, fertilizer, irrigation, etc.) to increase food production while minimizing pollution (Pingali, 2012) such as N2O emissions.
FIGURE 11.
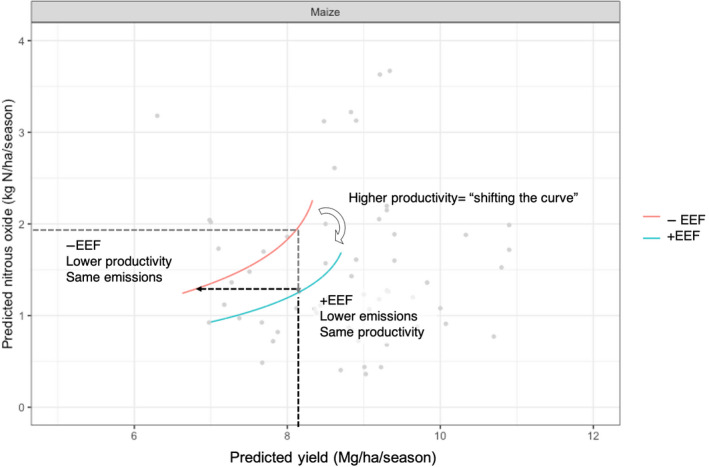
“Shifting” the productivity–pollution curve through the use of enhanced efficiency fertilizers (EEFs). Lines represent predicted values (0–350 kg N ha−1 season−1) from fixed effects in multilevel regression models (ignoring random effects). Light gray data points represent observed values
5. CONCLUSIONS
Across a range of fertilizer management factors in different soils, climates, and cropping systems, we observed a significant relationship between N2O emissions and PNB or PFP—a function of both N rate and productivity. Not only does a performance indicator approach explain a significant amount of variation in N2O emissions, it also integrates the productivity that we link to further emission mitigation. This approach is preferable over assigning N2O reduction coefficients to isolated 4R management practices that may have inconsistent effects on emissions and productivity. For instance, while we observed co‐benefits for EEFs, we found trade‐offs between N2O emissions and yield for N rate and placement. Furthermore, suites of 4R practices often co‐vary with management practices, thereby confounding our interpretation of singular effects such as fertilization frequency. Thus, we recommend tailoring suites of 4R practices to reduce PNB or increase PFP, where better agronomic performance—particularly in systems closing yield gaps—can mitigate emissions for a given N rate. Given that most soil and climate factors were not consistently significant global predictors of N2O emissions, the incorporation of soil and climate factors may need to be regionally focused. To safely feed the projected 9.7 billion people by 2100, balancing 4R fertilizer management to achieve multiple, and at times divergent, goals is essential to sustainable intensification. Adoption of technological packages that couple best management practices for increasing crop yields with proper monitoring to mitigate emissions is expected to create opportunities for win–win scenarios.
Supporting information
Supplementary Material
Supplementary Material
Table S1‐S2
Funding information
This work was carried out by International Maize and Wheat Improvement Center (CIMMYT) and funded by the CGIAR research programs (CRPs) on Climate Change, Agriculture and Food Security (CCAFS). CCAFS' work is supported by CGIAR Fund Donors and through bilateral funding agreements. For details please visit https://ccafs.cgiar.org/donors. The conclusions and recommendations out of this paper are of authors and cannot be taken to reflect the official opinions of these organizations.
DATA AVAILABILITY STATEMENT
The data will be made publicly available via a website.
REFERENCES
- Akiyama, H. , Yan, X. , & Yagi, K. (2010). Evaluation of effectiveness of enhanced‐efficiency fertilizers as mitigation options for N2O and NO emissions from agricultural soils: Meta‐analysis. Global Change Biology, 16(6), 1837–1846. 10.1111/j.1365-2486.2009.02031.x [DOI] [Google Scholar]
- Albanito, F. , Lebender, U. , Cornulier, T. , Sapkota, T. B. , Brentrup, F. , Stirling, C. , & Hillier, J. (2017). Direct nitrous oxide emissions from tropical and sub‐tropical agricultural systems – A review and modelling of emission factors. Scientific Reports, 7, 12. 10.1038/srep44235 [DOI] [PMC free article] [PubMed] [Google Scholar]
- Battye, W. , Aneja, V. P. , & Schlesinger, W. H. (2017). Is nitrogen the next carbon? Earth's Future, 5(9), 894–904. 10.1002/2017EF000592 [DOI] [Google Scholar]
- Benbi, D. K. (2017). Nitrogen balances of intensively cultivated rice–wheat cropping systems in original green revolution states of India. In Abrol Y. P., Adhya T. K., Aneja V. P., Raghuram N., Pathak H., Kulshrestha U., Sharma C., & Bijay‐Singh (Eds.), The Indian nitrogen assessment: Sources of reactive nitrogen, environmental and climate effects, management options and policies (pp. 77–93). Woodhead Publishing. [Google Scholar]
- Bijay‐Singh , Varinderpal‐Singh , Purba, J. , Sharma, R. K. , Jat, M. L. , Yadvinder‐Singh , Thind, H. S. , Gupta, R. K. , Chaudhary, O. P. , Chandna, P. , Khurana, H. S. , Kumar, A. , Jagmohan‐Singh , Uppal, H. S. , Uppal, R. K. , Vashistha, M. , & Gupta, R. (2015). Site‐specific fertilizer nitrogen management in irrigated transplanted rice (Oryza sativa) using an optical sensor. Precision Agriculture, 16(4), 455–475. 10.1007/s11119-015-9389-6. [DOI] [Google Scholar]
- Billen, G. , Garnier, J. , & Lassaletta, L. (2013). The nitrogen cascade from agricultural soils to the sea: Modelling nitrogen transfers at regional watershed and global scales. Philosophical Transactions of the Royal Society B: Biological Sciences, 368(1621), 20130123. 10.1098/rstb.2013.0123 [DOI] [PMC free article] [PubMed] [Google Scholar]
- Bouwman, A. F. , Boumans, L. J. M. , & Batjes, N. H. (2002). Modeling global annual N2O and NO emissions from fertilized fields. Global Biogeochemical Cycles, 16(4), 1080. 10.1029/2001GB001812 [DOI] [Google Scholar]
- Bouwman, L. , Goldewijk, K. K. , Van Der Hoek, K. W. , Beusen, A. H. W. , Van Vuuren, D. P. , Willems, J. , Rufino, M. C. , & Stehfest, E. (2013). Exploring global changes in nitrogen and phosphorus cycles in agriculture induced by livestock production over the 1900–2050 period. Proceedings of the National Academy of Sciences of the United States of America, 110(52), 20882–20887. 10.1073/pnas.1012878108 [DOI] [PMC free article] [PubMed] [Google Scholar]
- Casellas, T. O. , Belhouchette, H. , Wallach, D. , Oomen, R. , Russell, G. , Ewert, F. , Hengsdijk, H. , van Ittersum, M. K. , & Adam, M. (2009). Integrated assessment of agriculture and sustainable development: Setting the agenda for science and policy (AgSAP 2009): 10‐12 March 2009, Hotel Zuiderduin, Egmond aan Zee, the Netherlands: Proceedings. AgSAP Conference. [Google Scholar]
- Cayuela, M. L. , Aguilera, E. , Sanz‐Cobena, A. , Adams, D. C. , Abalos, D. , Barton, L. , Ryals, R. , Silver, W. L. , Alfaro, M. A. , Pappa, V. A. , Smith, P. , Garnier, J. , Billen, G. , Bouwman, L. , Bondeau, A. , & Lassaletta, L. (2017). Direct nitrous oxide emissions in Mediterranean climate cropping systems: Emission factors based on a meta‐analysis of available measurement data. Agriculture Ecosystems & Environment, 238, 25–35. 10.1016/j.agee.2016.10.006 [DOI] [Google Scholar]
- Ciceri, D. , & Allanore, A. (2019). Local fertilizers to achieve food self‐sufficiency in Africa. Science of the Total Environment, 648, 669–680. 10.1016/j.scitotenv.2018.08.154 [DOI] [PubMed] [Google Scholar]
- Cowan, N. J. , Famulari, D. , Levy, P. E. , Anderson, M. , Reay, D. S. , & Skiba, U. M. (2014). Investigating uptake of N2O in agricultural soils using a high‐precision dynamic chamber method. Atmospheric Measurement Techniques, 7(12), 4455–4462. 10.5194/amt-7-4455-2014 [DOI] [Google Scholar]
- Decock, C. (2014). Mitigating nitrous oxide emissions from corn cropping systems in the midwestern U.S.: Potential and data gaps. Environmental Science & Technology, 48(8), 4247–4256. 10.1021/es4055324 [DOI] [PubMed] [Google Scholar]
- Drury, C. F. , Yang, X. , Reynolds, W. D. , Calder, W. , Oloya, T. O. , & Woodley, A. L. (2017). Combining urease and nitrification inhibitors with incorporation reduces ammonia and nitrous oxide emissions and increases corn yields. Journal of Environmental Quality, 46(5), 939–949. 10.2134/jeq2017.03.0106 [DOI] [PubMed] [Google Scholar]
- Eagle, A. J. , McLellan, E. L. , Brawner, E. M. , Chantigny, M. H. , Davidson, E. A. , Dickey, J. B. , Linquist, B. A. , Maaz, T. M. , Pelster, D. E. , Pittelkow, C. M. , van Kessel, C. , Vyn, T. J. , & Cassman, K. G. (2020). Quantifying on‐farm nitrous oxide emission reductions in food supply chains. Earth's Future, 8(10), e2020EF001504. 10.1029/2020EF001504 [DOI] [Google Scholar]
- Eagle, A. , Olander, L. , Locklier, L. K. , Heffernan, J. , & Bernhardt, E. (2017). Fertilizer management and environmental factors drive N2O and NO3 losses in corn: A meta‐analysis. Soil Science Society of America Journal, 81, 1191. 10.2136/sssaj2016.09.0281 [DOI] [Google Scholar]
- Erisman, J. W. , Sutton, M. A. , Galloway, J. , Klimont, Z. , & Winiwarter, W. (2008). How a century of ammonia synthesis changed the world. Nature Geoscience, 1(10), 636–639. 10.1038/ngeo325 [DOI] [Google Scholar]
- EU Nitrogen Expert Panel . (2015). Nitrogen use efficiency (NUE): An indicator for the utilization of nitrogen in agriculture and food systems. Wageningen University. http://www.Inms.International/inms‐meeting‐lisbon/nexpertpanelnuesession1.Pdf [Google Scholar]
- Eve, M. , Pape, D. , Flugge, M. , Steele, R. , Man, D. , Gilbert, M. , & Biggar, S. (2014). Quantifying greenhouse gas fluxes in agriculture and forestry: Methods for entity‐scale inventory (no. technical bulletin number 1939). US Department of Agriculture, Office of the Chief Economist. [Google Scholar]
- FAO . (2009). Director‐general on how to feed the world in 2050. Population and Development Review, 35(4), 837–839. [Google Scholar]
- FAO . (2017). The future of food and agriculture: Trends and challenges. http://www.fao.org/3/i6583e/i6583e.pdf [Google Scholar]
- Fernandez, J. A. , DeBruin, J. , Messina, C. D. , & Ciampitti, I. A. (2020). Late‐season nitrogen fertilization on maize yield: A meta‐analysis. Field Crops Research, 247, 107586. 10.1016/j.fcr.2019.107586 [DOI] [Google Scholar]
- Fick, S. E. , & Hijmans, R. J. (2017). WorldClim 2: New 1‐km spatial resolution climate surfaces for global land areas. International Journal of Climatology, 37(12), 4302–4315. 10.1002/joc.5086 [DOI] [Google Scholar]
- Fixen, P. E. (2020). A brief account of the genesis of 4R nutrient stewardship. Agronomy Journal, 112(5), 4511–4518. 10.1002/agj2.20315 [DOI] [Google Scholar]
- Fixen, P. , Brentrup, F. , Bruulsema, T. , Garcia, F. , Norton, R. , & Zingore, S. (2015). Nutrient/fertilizer use efficiency: Measurement, current situation and trends (pp. 8–38). International Fertilizer Industry Association (IFA). [Google Scholar]
- Groenigen, J. W. V. , Velthof, G. L. , Oenema, O. , Groenigen, K. J. V. , & Kessel, C. V. (2010). Towards an agronomic assessment of N2O emissions: A case study for arable crops. European Journal of Soil Science, 61(6), 903–913. 10.1111/j.1365-2389.2009.01217.x [DOI] [Google Scholar]
- Halvorson, A. D. , Del Grosso, S. J. , & Jantalia, C. P. (2011). Nitrogen source effects on soil nitrous oxide emissions from strip‐till corn. Journal of Environment Quality, 40(June), 1775–1786. 10.2134/jeq2011.0194 [DOI] [PubMed] [Google Scholar]
- Hoben, J. P. , Gehl, R. J. , Millar, N. , Grace, P. R. , & Robertson, G. P. (2011). Nonlinear nitrous oxide (N2O) response to nitrogen fertilizer in on‐farm corn crops of the US Midwest. Global Change Biology, 17(2), 1140–1152. 10.1111/j.1365-2486.2010.02349.x [DOI] [Google Scholar]
- Huang, S. , Lv, W. , Bloszies, S. , Shi, Q. , Pan, X. , & Zeng, Y. (2016). Effects of fertilizer management practices on yield‐scaled ammonia emissions from croplands in China: A meta‐analysis. Field Crops Research, 192, 118–125. 10.1016/j.fcr.2016.04.023 [DOI] [Google Scholar]
- Huddell, A. M. , Galford, G. L. , Tully, K. L. , Crowley, C. , Palm, C. A. , Neill, C. , Hickman, J. E. , & Menge, D. N. L. (2020). Meta‐analysis on the potential for increasing nitrogen losses from intensifying tropical agriculture. Global Change Biology, 26(3), 1668–1680. 10.1111/gcb.14951 [DOI] [PubMed] [Google Scholar]
- IPCC . (2013). Climate change 2013. The physical science basis. Working group I contribuiton to the fifth assessment report of the Intergovernmental Panel on Climate Change. Chapter 8: Anthropogenic and natural radiative forcing. Intergovernmental Panel on Climate Change. [Google Scholar]
- IPCC . (2019). 2019 Refinement to the 2006 IPCC guidelines for National Greenhouse Gas Inventories, chapter 11 (Calvo‐Buendia E., Tanabe K., Kranjc A., Baasansuren J., Fukuda M., Ngarize S., Osako A., Pyrozhenko Y., Shermanau P., & Federici S., Eds.; Vol. 4). IPCC. [Google Scholar]
- Lam, S. K. , Suter, H. , Mosier, A. R. , & Chen, D. (2017). Using nitrification inhibitors to mitigate agricultural N2O emission: A double‐edged sword? Global Change Biology, 23(2), 485–489. 10.1111/gcb.13338 [DOI] [PubMed] [Google Scholar]
- Lassaletta, L. , Billen, G. , Garnier, J. , Bouwman, L. , Velazquez, E. , Mueller, N. D. , & Gerber, J. S. (2016). Nitrogen use in the global food system: Past trends and future trajectories of agronomic performance, pollution, trade, and dietary demand. Environmental Research Letters, 11(9), 095007. 10.1088/1748-9326/11/9/095007 [DOI] [Google Scholar]
- Lassaletta, L. , Billen, G. , Grizzetti, B. , Anglade, J. , & Garnier, J. (2014). 50 year trends in nitrogen use efficiency of world cropping systems: The relationship between yield and nitrogen input to cropland. Environmental Research Letters, 9(10), 105011. 10.1088/1748-9326/9/10/105011 [DOI] [Google Scholar]
- Li, T. , Zhang, W. , Yin, J. , Chadwick, D. , Norse, D. , Lu, Y. , Liu, X. , Chen, X. , Zhang, F. , Powlson, D. , & Dou, Z. (2018). Enhanced‐efficiency fertilizers are not a panacea for resolving the nitrogen problem. Global Change Biology, 24(2), e511–e521. 10.1111/gcb.13918 [DOI] [PubMed] [Google Scholar]
- Liang, C. , MacDonald, D. , Thiagarajan, A. , Flemming, C. , Cerkowniak, D. , & Desjardins, R. (2020). Developing a country specific method for estimating nitrous oxide emissions from agricultural soils in Canada. Nutrient Cycling in Agroecosystems, 117(2), 145–167. 10.1007/s10705-020-10058-w [DOI] [Google Scholar]
- Liu, S. , Lin, F. , Wu, S. , Ji, C. , Sun, Y. , Jin, Y. , Li, S. , Li, Z. , & Zou, J. (2017). A meta‐analysis of fertilizer‐induced soil NO and combined NO+N2O emissions. Global Change Biology, 23(6), 2520–2532. 10.1111/gcb.13485 [DOI] [PubMed] [Google Scholar]
- Martinez‐Feria, R. A. , Castellano, M. J. , Dietzel, R. N. , Helmers, M. J. , Liebman, M. , Huber, I. , & Archontoulis, S. V. (2018). Linking crop‐ and soil‐based approaches to evaluate system nitrogen‐use efficiency and tradeoffs. Agriculture, Ecosystems & Environment, 256, 131–143. 10.1016/j.agee.2018.01.002 [DOI] [Google Scholar]
- Mbow, H.‐O.‐P. , Reisinger, A. , Canadell, J. , & O’Brien, P. (2017). Special report on climate change, desertification, land degradation, sustainable land management, food security, and greenhouse gas fluxes in terrestrial ecosystems (SR2). IPCC. [Google Scholar]
- McLellan, E. L. , Cassman, K. G. , Eagle, A. J. , Woodbury, P. B. , Sela, S. , Tonitto, C. , Marjerison, R. D. , & Van Es, H. M. (2018). The nitrogen balancing act: Tracking the environmental performance of food production. BioScience, 68(3), 194–203. 10.1093/biosci/bix164 [DOI] [PMC free article] [PubMed] [Google Scholar]
- Millar, N. , Robertson, G. P. , Grace, P. R. , Gehl, R. J. , & Hoben, J. P. (2010). Nitrogen fertilizer management for nitrous oxide (N2O) mitigation in intensive corn (Maize) production: An emissions reduction protocol for US Midwest agriculture. Mitigation and Adaptation Strategies for Global Change, 15(2), 185–204. 10.1007/s11027-010-9212-7 [DOI] [Google Scholar]
- Nakagawa, S. , & Schielzeth, H. (2013). A general and simple method for obtaining R2 from generalized linear mixed‐effects models. Methods in Ecology and Evolution, 4(2), 133–142. 10.1111/j.2041-210x.2012.00261.x [DOI] [Google Scholar]
- Niles, M. T. , Waterhouse, H. , Parkhurst, R. , McLellan, E. L. , & Kroopf, S. (2019). Policy options to streamline the carbon market for agricultural nitrous oxide emissions. Climate Policy, 19(7), 893–907. 10.1080/14693062.2019.1599802 [DOI] [Google Scholar]
- Nkebiwe, P. M. , Weinmann, M. , Bar‐Tal, A. , & Müller, T. (2016). Fertilizer placement to improve crop nutrient acquisition and yield: A review and meta‐analysis. Field Crops Research, 196, 389–401. 10.1016/j.fcr.2016.07.018 [DOI] [Google Scholar]
- Omonode, R. A. , Halvorson, A. D. , Gagnon, B. , & Vyn, T. J. (2017). Achieving lower nitrogen balance and higher nitrogen recovery efficiency reduces nitrous oxide emissions in North America's maize cropping systems. Frontiers in Plant Science, 8. 10.3389/fpls.2017.01080 [DOI] [PMC free article] [PubMed] [Google Scholar]
- Pan, B. , Lam, S. K. , Mosier, A. , Luo, Y. , & Chen, D. (2016). Ammonia volatilization from synthetic fertilizers and its mitigation strategies: A global synthesis. Agriculture, Ecosystems & Environment, 232, 283–289. 10.1016/j.agee.2016.08.019 [DOI] [Google Scholar]
- Pingali, P. L. (2012). Green Revolution: Impacts, limits, and the path ahead. Proceedings of the National Academy of Sciences of the United States of America, 109(31), 12302–12308. 10.1073/pnas.0912953109 [DOI] [PMC free article] [PubMed] [Google Scholar]
- Qian, S. S. (2017). Environmental and ecological statistics with R (2nd ed.). Taylor & Francis Group. [Google Scholar]
- Qian, S. S. , Cuffney, T. F. , Alameddine, I. , McMahon, G. , & Reckhow, K. H. (2010). On the application of multilevel modeling in environmental and ecological studies. Ecology, 91(2), 355–361. 10.1890/09-1043.1 [DOI] [PubMed] [Google Scholar]
- Qiao, C. , Liu, L. , Hu, S. , Compton, J. E. , Greaver, T. L. , & Li, Q. (2015). How inhibiting nitrification affects nitrogen cycle and reduces environmental impacts of anthropogenic nitrogen input. Global Change Biology, 21(3), 1249–1257. 10.1111/gcb.12802 [DOI] [PubMed] [Google Scholar]
- R Core Team . (2020). R: A language and environment for statistical computing. R Foundation for Statistical Computing. https://www.R‐project.org/ [Google Scholar]
- Rochette, P. , Liang, C. , Pelster, D. , Bergeron, O. , Lemke, R. , Kroebel, R. , MacDonald, D. , Yan, W. , & Flemming, C. (2018). Soil nitrous oxide emissions from agricultural soils in Canada: Exploring relationships with soil, crop and climatic variables. Agriculture, Ecosystems & Environment, 254(Supplement C), 69–81. 10.1016/j.agee.2017.10.021 [DOI] [Google Scholar]
- Rohangi, A. (2020). WebPlotDigitizer version (4.0.0) [Computer software]. https://automeris.io/WebPlotDigitizer [Google Scholar]
- Sanchez, P. A. (2019). Properties and management of soils in the tropics (2nd ed.). Cambridge University Press. 10.1017/9781316809785 [DOI] [Google Scholar]
- Sapkota, T. B. , Singh, L. K. , Yadav, A. K. , Khatri‐Chhetri, A. , Jat, H. S. , Sharma, P. C. , Jat, M. L. , & Stirling, C. M. (2020). Identifying optimum rates of fertilizer nitrogen application to maximize economic return and minimize nitrous oxide emission from rice–wheat systems in the Indo‐Gangetic Plains of India. Archives of Agronomy and Soil Science, 66(14), 2039–2054. 10.1080/03650340.2019.1708332 [DOI] [Google Scholar]
- Singh, V. K. , Dwivedi, B. S. , Tiwari, K. N. , Majumdar, K. , Rani, M. , Singh, S. K. , & Timsina, J. (2014). Optimizing nutrient management strategies for rice–wheat system in the Indo‐Gangetic Plains of India and adjacent region for higher productivity, nutrient use efficiency and profits. Field Crops Research, 164, 30–44. 10.1016/j.fcr.2014.05.007 [DOI] [Google Scholar]
- Smith, P. , Martino, D. , Cai, Z. , Gwary, D. , Janzen, H. , Kumar, P. , McCarl, B. , Ogle, S. , O’Mara, F. , Rice, C. , Scholes, B. , & Sirotenko, O. (2007). Agriculture. In Metz B., Davidson O. R., Bosch P. R. P. R., Dave R., & Meyer L. A. (Eds.), Climate change 2007: Mitigation. Contribution of working group III to the fourth assessment report of the Intergovernmental Panel on Climate Change. Cambridge University Press. [Google Scholar]
- Snyder, C. S. , Bruulsema, T. W. , Jensen, T. L. , & Fixen, P. E. (2009). Review of greenhouse gas emissions from crop production systems and fertilizer management effects. Agriculture, Ecosystems & Environment, 133(3), 247–266. 10.1016/j.agee.2009.04.021 [DOI] [Google Scholar]
- Stehfest, E. , & Bouwman, L. (2006). N2O and NO emission from agricultural fields and soils under natural vegetation: Summarizing available measurement data and modeling of global annual emissions. Nutrient Cycling in Agroecosystems, 74(3), 207–228. 10.1007/s10705-006-9000-7 [DOI] [Google Scholar]
- Tanadini, M. , & Mehrabi, Z. (2017). Does no‐till agriculture limit crop yields? BioRxiv, 179358. 10.1101/179358 [DOI] [Google Scholar]
- Thapa, R. , Chatterjee, A. , Awale, R. , McGranahan, D. A. , & Daigh, A. (2016). Effect of enhanced efficiency fertilizers on nitrous oxide emissions and crop yields: A meta‐analysis. Soil Science Society of America Journal, 80(5), 1121–1134. 10.2136/sssaj2016.06.0179 [DOI] [Google Scholar]
- Van Bemmelen, J. M. (1890). Über die Bestimmung des Wassers, des Humus, des Schwefels, der in den colloïdalen Silikaten gebundenen Kieselsäure, des Mangans usw im Ackerboden. Die Landwirthschaftlichen Versuchs‐Stationen, 37, 279–290. [Google Scholar]
- van Lent, J. , Hergoualc'h, K. , & Verchot, L. V. (2015). Reviews and syntheses: Soil N2O and NO emissions from land use and land‐use change in the tropics and subtropics: A meta‐analysis. Biogeosciences, 12(23), 7299–7313. 10.5194/bg-12-7299-2015 [DOI] [Google Scholar]
- Wang, M. Y. , Siddiqi, M. Y. , Ruth, T. J. , & Glass, A. D. M. (1993). Ammonium uptake by rice roots (II. Kinetics of 13NH4 + Influx across the plasmalemma). Plant Physiology, 103(4), 1259–1267. [DOI] [PMC free article] [PubMed] [Google Scholar]
- Weil, R. , & Brady, N. (2017). The nature and properties of soils (15th ed.). Pearson Education Limited. [Google Scholar]
- Xia, L. , Lam, S. K. , Chen, D. , Wang, J. , Tang, Q. , & Yan, X. (2017). Can knowledge‐based N management produce more staple grain with lower greenhouse gas emission and reactive nitrogen pollution? A meta‐analysis. Global Change Biology, 23(5), 1917–1925. 10.1111/gcb.13455 [DOI] [PubMed] [Google Scholar]
- Yadvinder‐Singh , Singh, M. , Sidhu, H. S. , Humphreys, E. , Thind, H. S. , Jat, M. L. , Blackwell, J. , & Singh, V. (2015). Nitrogen management for zero till wheat with surface retention of rice residues in north‐west India. Field Crops Research, 184, 183–191. 10.1016/j.fcr.2015.03.025 [DOI] [Google Scholar]
- Yue, Q. , Ledo, A. , Cheng, K. , Albanito, F. , Lebender, U. , Sapkota, T. B. , Brentrup, F. , Stirling, C. M. , Smith, P. , Sun, J. , Pan, G. , & Hillier, J. (2018). Re‐assessing nitrous oxide emissions from croplands across Mainland China. Agriculture, Ecosystems & Environment, 268, 70–78. 10.1016/j.agee.2018.09.003 [DOI] [Google Scholar]
- Zhang, X. , Davidson, E. A. , Mauzerall, D. L. , Searchinger, T. D. , Dumas, P. , & Shen, Y. (2015). Managing nitrogen for sustainable development. Nature, 528(7580), 51–59. 10.1038/nature15743 [DOI] [PubMed] [Google Scholar]
Associated Data
This section collects any data citations, data availability statements, or supplementary materials included in this article.
Supplementary Materials
Supplementary Material
Supplementary Material
Table S1‐S2
Data Availability Statement
The data will be made publicly available via a website.