Abstract
Accurate knowledge of transport properties of Li‐insertion materials in application‐relevant temperature ranges is of crucial importance for the targeted optimization of Li‐ion batteries (LIBs). Galvanostatic intermittent titration technique (GITT) is a widely applied method to determine Li‐ion diffusion coefficients of electrode materials. The well‐known calculation formulas based on Weppner's and Huggins’ approach, imply a square‐root time dependence of the potential during a GITT pulse. Charging the electrochemical double layer capacitance at the beginning of a GITT pulse usually takes less than one second. However, at lower temperatures down to −40 °C, the double layer charging time strongly increases due to an increase of the charge transfer resistance. The charging time can become comparable with the pulse duration, impeding the conventional GITT diffusion analysis. We propose a model to describe the potential change during a galvanostatic current pulse, which includes an initial, relatively long‐lasting double layer charging, and analyze the accuracy of the lithium diffusion coefficient, derived by using the Weppner‐Huggins method within a suitably chosen time interval of the pulse. Effects leading to an inaccurate determination of the diffusion coefficient are discussed and suggestions to improve GITT analyses at low temperature are derived.
Keywords: Battery, charge transfer, diffusion coefficient of cathode material, galvanostatic intermittent titration technique, low temperature kinetics
Double layer charging at low temperature significantly impacts the determination of the diffusion coefficient from GITT measurements. Systematic modeling and experimental studies show how the accuracy of the determined diffusion coefficient is affected by charge transfer kinetics. Effects leading to inaccurate determination of the diffusion coefficient are discussed and suggestions for improving GITT analyses at low temperature are derived.
1. Introduction
Lithium‐ion batteries (LIBs) are currently considered the most attractive option to power hybrid‐ and all‐electric vehicle.[ 1 , 2 ] However, the user acceptance is still quite limited, mainly due to high costs, safety concerns, unsatisfactory fast charging, and insufficient range capabilities. Furthermore, the wide‐spread adoption of electric vehicles is restricted by insufficient low temperature performance. Besides additional energy demands for heating the driver‘s compartment in cold‐climate countries at the expense of the battery capacity and driving range, the power capability of current LIBs is dramatically reduced at subzero temperatures. This is due to increasing kinetic and mass transport limitations inside the electrodes and the electrolyte.[ 3 , 4 ] Particularly, the lithium diffusion in the cathode material is expected to slow down significantly at low temperature. Accordingly, researchers attempt to determine lithium diffusion coefficients of novel cathode materials in application‐relevant temperature ranges of −40–50 °C (cf. for example Refs. [5–13]). Such studies are essentially required for both, knowledge‐based material development (e. g. understanding the impact of the host structure or dopants) and targeted design optimization based on modeling and simulation. For these purposes, the accuracy of the parameters determined in kinetic studies is of crucial importance, as it forms the basis for subsequent developments.
The most frequently used method to determine the diffusion coefficient is the galvanostatic intermittent titration technique (GITT). It is considered to be one of the most reliable methods. Figure 1 shows a schematic of the idealized potential change during a GITT pulse. The voltage response is characterized by an initial jump, the so called IR drop ( ) and the subsequent increase from to followed by a second IR drop and a relaxation transient after current interruption. In the seminal work by Weppner and Huggins, [14] it was shown how the chemical diffusion coefficient can be estimated from the measured potential data. The corresponding formulas to determine the diffusion coefficient assume a square‐root time dependence of the potential during the GITT pulse. The initial charging of the electrochemical double‐layer capacitance is usually very short and can be disregarded. However, it becomes significant at low temperature. Because of the increasing charge‐transfer resistance with lowering the temperature, the charging time of the double‐layer capacitance increases, and the potential curve noticeably differs from the idealized pulse in Figure 1. [15]
Figure 1.
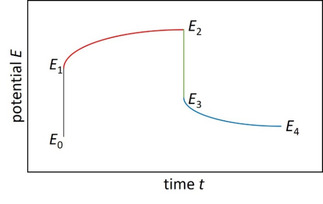
Schematic of potential change as a function of time during a galvanostatic current pulse and the subsequent relaxation phase.
In the present work, we attempt to analyze the accuracy of the diffusion coefficient derived from GITT data in the limiting case of low temperature. We propose a model to describe the potential progression during a galvanostatic current pulse, which includes the charging of the double‐layer capacitance. Within the framework of this model, we first simulate potential pulses for given diffusion coefficient and, subsequently, determine the diffusion coefficient according to the Weppner‐Huggins approach. To this end, we determine the slope by means of linear regression within a suitably chosen time domain of the current pulse, excluding the initial charging period of the double‐layer capacitance. We found that the accuracy of the diffusion coefficient, derived in this way, is related to the temperature and the state of lithiation (SOL e. g. as x in LixCO2) and depends strongly on the chosen time domain of the GITT pulse for the diffusion analysis. The theoretical considerations are complemented by experimental investigations on the cathode material LiNi0.5Co0.2Mn0.3O2 (NCM523). Different effects leading to an inaccurate determination of the diffusion coefficient are discussed and guidelines for GITT analyses at low temperature are derived.
Methods Section
GITT Analysis
Considering a thin film geometry of the electrode material, Weppner and Huggins derived the following equation for the diffusion coefficient (Eq. (36) in Ref. [14]) from the square‐root time dependence of the potential for times t≪L 2/D (L is the film thickness):
| (1) |
where is the galvanostatic current, is the area of the electrolyte‐oxide interface (EOI), is Faraday's constant, is the maximum lithium density in the oxide (in mol m−3), and is the stoichiometry of lithium in the oxide, referred to as state of lithiation (SOL) in the following. is the equilibrium potential (open circuit voltage) as a function of the SOL. is the potential progression between the characteristic potential values and in Figure 1. For sufficiently small current and short pulses, the derivative can be approximated by , where is the SOL at the beginning of the pulse and at the end of the relaxation phase (cf. Figure 1). Then, Equation (1) becomes:
| (2) |
In this formula, the change of the SOL due to one GITT pulse can be expressed as (for charging ), where is the pulse duration, is the volume fraction of the active cathode material, and is the total electrode volume. The porous cathode in LIBs typically consists of an agglomerate of sphere‐like lithium oxide particles. Approximating the specific surface area of the particles by with as particle radius (cf. for exampleRef. [12]), one obtains the surface area of the EOI as . Inserting these relations into Eq. (2) yields the following equation for the diffusion coefficient:
| (3) |
Note that for spherical particles (in difference to the thin film geometry considered in Ref. [14]), the square‐root time dependence of the potential is valid for (within 5 % accuracy for , see e. g. Ref. [15]).
Modeling
The electrochemical processes during a GITT measurement were theoretically analyzed within the single particle model (SPM),[ 16 , 17 ] which is considered to be adequate at low current typical for GITT. The EOI is modeled in an approximate manner similar to an RC‐circuit with resistor and capacitor in a parallel connection (cf. Figure 2). The capacitor represents the capacitance of the electric double layer at the EOI. The charge transfer resistance is given by , where the current passing the EOI is described by the Butler‐Volmer (BV) equation:
| (4) |
Figure 2.
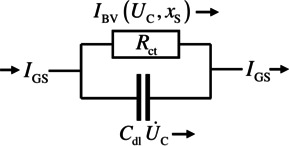
Equivalent circuit of the EOI consisting of the charge transfer resistance and the capacitance of the double layer. The schematic shows the current contributions to the galvanostatic current due to charge transfer ( ) through the EOI and initial charging of the double layer ( ).
In this formula, is the anodic charge transfer coefficient, is the gas constant, T is the temperature, U C is the potential drop at the EOI, and x S is the SOL at the surface of the oxide particles. The exchange current is expressed by:
| (5) |
where is the rate constant (dimension mol m−2 s−1). The lithium concentration in the electrolyte, which also affects the exchange current, is assumed constant since the lithium diffusivity is orders of magnitude larger compared to solid‐state diffusion in the oxide particles.
Switching on the galvanostatic current initially leads to charging of the electric double layer at the EOI. This causes an increase of the potential drop at the EOI which, in turn, causes the charge transfer through the EOI according to the Butler‐Volmer law Eq. (4). From the total current , one finds the temporal change of the potential drop:
| (6) |
Here, we have considered that the lithium concentration at the oxide surface changes with time t, which in turn affects the potential and the charge transfer resistance. The initial condition for solving differential equation (6) is . To solve Eq. (6), one has to calculate simultaneously the development of the lithium concentration inside the oxide particles. Actually, the lithium diffusion coefficient in the oxide depends on the lithium concentration. However, for simplicity, we neglect this dependence within the lithiation interval covered during one GITT pulse, which is typically small. Assuming spherical oxide particles of equal radius and isotropic diffusion coefficient D, the lithium diffusion problem is given by the spherical diffusion equation:
| (7) |
With initial condition and boundary conditions:
| (8) |
Because of the time dependence of the boundary condition at the particle surface, the concentration evolution has to be calculated numerically.
Linear analysis: For a first analysis, we consider the limiting case of small galvanostatic current . In this case, the overpotential at the EOI is small and the BV‐formula (4) can be linearized. Correspondingly, Eq. (6) becomes:
| (9) |
The charisitc time is introduced in [Eq. 10]:
| (10) |
Using the characteristic time, Equation (9) can be rewritten as:
| (11) |
To roughly estimate the duration of charging the electric double layer, we neglect the initial change of the lithium concentration , i. e. we replace in (11) by . Then, Eq. (11) can be solved analytically:
| (12) |
(here ). The time in Eq. (12) has the meaning of the double‐layer charging time (in linear approximation). Clearly, the neglect of the temporal change of is a rough approximation, which is expected to be reasonable for small galvanostatic current and large lithium diffusion coefficient. Because of (cf. Eq. (10)), the charging time increases with decreasing rate constant and for large SOL . With lowering the temperature, the rate constant and thus the exchange current strongly decrease. Consequently, the overpotential in Eq. (4) increases to provide the prescribed galvanostatic current. In this limit, the above linear analysis will fail. Thus, a numerical analysis including the lithium diffusion inside the oxide particles must be performed to properly describe the potential change during a GITT pulse as base for an accurate determination of the lithium diffusion coefficient.
Nonlinear analysis: For the general case of the nonlinear BV‐relationship (4), the system of differential equations (6) and (7) was solved numerically. The ordinary differential equation (6) was solved by the simple Euler method and the partial differential equation (7) by an explicit finite difference method [18] . The accuracy of the finite difference method was proven by comparison with the analytic solution of the concentration evolution for constant lithium current density at the surface of the oxide particles (cf. page 96 in Ref. [18]).
Model parameters: For the numerical calculation of the potential change during a GITT pulse, appropriate input parameters for low temperatures were extracted from Electrochemical impedance spectroscopy (EIS) measurements on the cathode material NCM523 (cf. Ref. [15] for details on EIS measurements). The double layer capacitance varies only slightly within the considered temperature range (Figure 3a) when compared to the strong change of the charge transfer resistance (Figure 3b). Thus, to simplify the parameter study, the specific double layer capacitance was fixed at a mean value of . It has to be noted that this is about 10 times larger than typical values reported in the literature [19–21]. (A higher value of 80 F m−2 was reported in Ref. [22].) The comparatively high value of is most likely related to the fact that we referred the capacitance to the surface of the 10 μm‐sized secondary oxide particles consisting of small primary particles with sizes of a few 100 nm. Thus, the real surface area is considerably larger. The specific charge‐transfer surface‐resistance was referred to the same area. Accordingly, the time constant is independent of the area.
Figure 3.
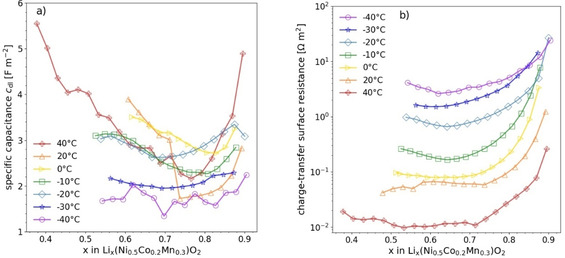
Results of EIS measurements on NCM523: specific double‐layer capacitance (a) and charge‐transfer surface‐resistance (b) as a function of the SOL for different temperatures.
The charge transfer resistance, , (cf. Figures 2 and 3b) is closely related to the rate constant . In the limit of small galvanostatic current, we find from the linearized BV‐formula (4) . With the relation , the exchange current results as . Together with Eq. (5), the relation between rate constant and resistance follows as . The charge transfer coefficient was supposed as . For an order‐of‐magnitude estimate of the rate constant, we employed the charge transfer resistance derived from EIS measurements on NCM523. [15] In correspondence to the estimated values in Table 1, we included ‐values ranging from in the following parameter study.
Table 1.
Rate constant estimated in linear approximation from experimentally determined charge transfer resistance at different temperatures and SOL.
|
Temperature [°C] |
SOL |
Charge‐transfer surface resistance [ ] |
Rate constant [mol m−2 s−1] |
|---|---|---|---|
|
−40 |
0.904 |
24.2 |
2.9 ⋅ 10−8 |
|
−10 |
0.713 |
0.217 |
2.4 ⋅ 10−6 |
|
+40 |
0.714 |
0.0108 |
5.7 ⋅ 10−5 |
The number of titrations of a GITT analysis covering the whole SOL range of a LIB is typically 20 to 50 pulses with a pulse duration of about 200 to 3000 s.[ 8 , 11 , 23 , 24 , 25 ] For example, covering an SOL range from 0.5 to 0.9 by 40 pulses, the SOL increment per pulse follows as . The corresponding galvanostatic current density through the oxide surface results from a charge balance as (e‐elementary charge). Choosing , , and , we find . In the following model calculations, as well as the relatively small value were used. The smaller value is expected to be more suited at very low temperatures because of slower lithium diffusion in the electrolyte. The lower the current, the better the suppositions of the SPM are fulfilled. The ohmic resistance , which is in series with the RC circuit in Figure 2, was fixed. The ohmic voltage drop results as . Our choice of and corresponds to the experimental results in Ref. [15].
For the equilibrium potential as a function of the SOL, , we employed the quasi‐equilibrium values shown in Figure 4. They were obtained during GITT measurements at 273 K after a relaxation period of 14400 s between the GITT pulses. [15] Actually, the equilibrium potential slightly depends on temperature. However, for demonstration purposes, we applied at 273 K also for the other temperatures.
Figure 4.
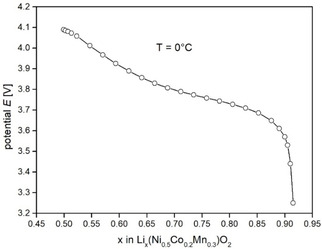
Equilibrium potential as a function of the SOL, which was experimentally determined at 273 K.
For calculating the lithium diffusion in the oxide particles during one GITT pulse, we supposed spherical particles with radius and uniform initial lithium concentration. The diffusion coefficient was chosen in the range according to reported diffusion data for NCM523 at different temperatures [7, 11, 12, 15, 21]. The rather small value of was included as limiting case, considering that lithium diffusion could strongly slow down at very low temperatures.
2. Results
2.1. Potential Calculations
In the following, we present results of numerical calculations of the temporal potential change during a GITT pulse. As outlined above, we employed the single particle model Ref. [16, 17] since the applied current was low. In view of the intended application of formula (3) for determining the diffusion coefficient from the potential change, the potential is plotted as a function of the square root of time . In Figure 5, potential changes calculated for temperatures 25 °C and −40 °C are compared. The rate constant and diffusion coefficient were chosen as limiting cases of our parameter study to clearly demonstrate the problems which arise in the application of formula (3) for determining the diffusion coefficient. The curves in Figure 5 show a significant deviation from a strict linear behavior, which would otherwise correspond to a square‐root time dependence of the potential as required by formula (3) to be valid. The double‐layer charging causes an initial transition region of about 1 s at 25 °C and 100 s at −40 °C. Subsequently, the curve follows an approximate square‐root time dependence, especially in the case of the small diffusion coefficient of 10−16 m2 s−1 at the temperature of −40 °C. The potential change at 25 °C exhibits a noticeable curvature beyond a time of about 100 s (see dotted line in Figure 5). The reason for this deviation from the linear behavior is obviously that the lithium diffusion penetration depth of about 2 μm at time and becomes comparable with the radius of the oxide particles of 5 μm so that the square‐root time dependence is no longer valid.
Figure 5.
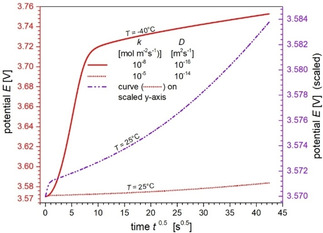
Comparison of calculated potential changes during GITT pulses at 25 °C and −40 °C (red left axis) as a function of . Respective rate constant and diffusion coefficient were chosen to demonstrate expected changes of the potential with lowering the temperature. For better comparability, the pulse at 25 °C is also displayed in a scaled version (dash‐dotted line, purple right axis). Further parameters: , .
2.2. Determination of Diffusion Coefficient
In view of the demonstrated deviation of from strictly linear behavior, the question arises whether a suited time interval , exhibiting approximately linear behavior, can be chosen to derive the slope , which is adequate for an accurate determination of the diffusion coefficient. As displayed in Figure 6, a straight line is fitted from the data points within a certain time interval to derive the slope. The chosen time interval in Figure 6a is clearly not suited and yields an inaccurate diffusion coefficient. This case is shown here only for demonstration. Such an improper choice of the lower cut time could happen for example in an automated analysis without visual inspection of pulse shapes. The apparently suited choice of the time interval in Figure 6b yields a diffusion coefficient which overestimates the exact value by about 50 %.
Figure 6.
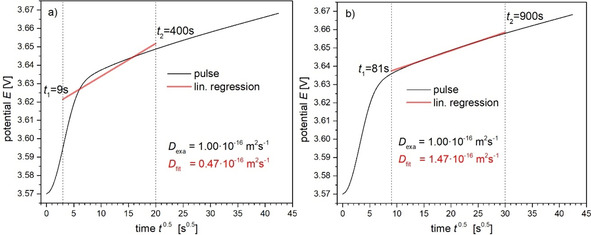
Determination of the diffusion coefficient using different time intervals for estimating the slope by linear fitting. An improper choice of the lower cut time (e. g. by an automated analysis) leads to an inaccurate diffusion coefficient of compared to the exact value of (a). Choosing and yields the better result of (b). Further parameters: , , , .
Within a comprehensive parameter study, we have investigated the impact of choosing different lower ( ) and upper ( ) cut times on the diffusion coefficient derived by using Equation (3). In the following, we present selected cases that demonstrate particular difficulties in the determination of the diffusion coefficient, especially at low temperature. Figure 7a shows fitted diffusion coefficients for a parameter set which is expected to correspond to room temperature measurements. For demonstration purposes, a relatively small diffusion coefficient was chosen in Figure 7b. In the latter case, the potential change exhibits almost strictly linear behavior after a short initial transition region. The derived diffusion coefficients for different chosen time intervals are close to the exact value, almost independent of the lower cut time . The deviation from the exact value somewhat increases with increasing the upper cut time , which is attributed to a very slight positive curvature of . For the larger diffusion coefficient, (Figure 7a), the potential change shows a much larger curvature. As a consequence, the underestimation of the diffusion coefficient strongly increases up to one order of magnitude with increasing upper cut time .
Figure 7.
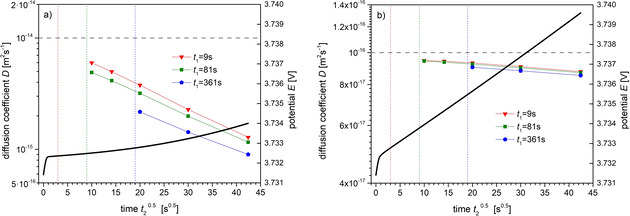
Overview of derived diffusion coefficients in dependence on the time interval , used for determining by linear fitting. The diagrams show two cases for the given diffusion coefficients (dashed horizontal lines) of (a) and (b). Besides the potential change (black line, right y‐axis), the calculated diffusion coefficients are displayed as a function of discrete values of (x‐axis) with as parameter. Colored lines are guides to the eye. Further parameters: , , , .
Figure 8 shows results of derived diffusion coefficients for a parameter set which is expected to apply to low temperature. Because of the wide range of reported diffusion coefficients for the cathode material NCM523, we considered three values ranging from D exa=10−14 m2 s−1 down to D exa=10−16 m2 s−1. The double layer charging time of the pulses is about τ dl ≈100 s, independent of the diffusion coefficient. The choice of a lower cut time t 1<τ dl (e. g. by an automated analysis) can lead to strong underestimations of the diffusion coefficient by orders of magnitude. The deviation from the exact value reduces by choosing a large upper cut time t 2 to compensate the bad choice of t 1. With cut time t 1 well above the charging time (t 1=361 s), the derived diffusion coefficients are rather close to the exact value in case of the given diffusion coefficients D exa=10−16 m2 s−1 (Figure 8c, slight overestimation) and D exa=10−15 m2 s−1 (Figure 8b, slight underestimation). However, for D exa=10−14 m2 s−1 (Figure 8a), all derived diffusion coefficients are considerably below the exact value despite an apparently adequate choice of the time interval (t 1,t 2). Obviously, there is no pronounced time region which allows application of formula (3). Initially, the potential change is dominated by the double‐layer charging and subsequently the condition for the applicability of formula (3), in this case t≪r P 2/D=2500s, already starts to be violated.
Figure 8.

Derived diffusion coefficients in dependence on the time interval for a parameter set corresponding to low temperature. See Figure 7 for detailed explanations. The diagrams show three cases for given diffusion coefficient (dashed horizontal lines) of D exa=10−14 (a), (b), and 10−16 m2 s−1 (c). Further parameters: , , , .
The double layer charging time can be reduced by performing GITT measurements at higher galvanostatic current. This time reduction is a consequence of the nonlinear current‐potential relation of the BV‐formula (4). The resistance diminishes with increasing current. An example of derived diffusion coefficients using parameters as in Figure 8, but with ten‐fold higher current, is shown in Figure 9. The charging time is reduced from about 100 s in Figure 8 to about 10s in Figure 9. For given diffusion coefficient of (Figure 9c), the derived diffusion coefficients are overestimations of up to one order of magnitude with increasing times and . For (Figure 9b), the derived values are remarkably close to the exact ones, whereas for (Figure 9a) the diffusion coefficient is underestimated by more than a factor of three.
Figure 9.
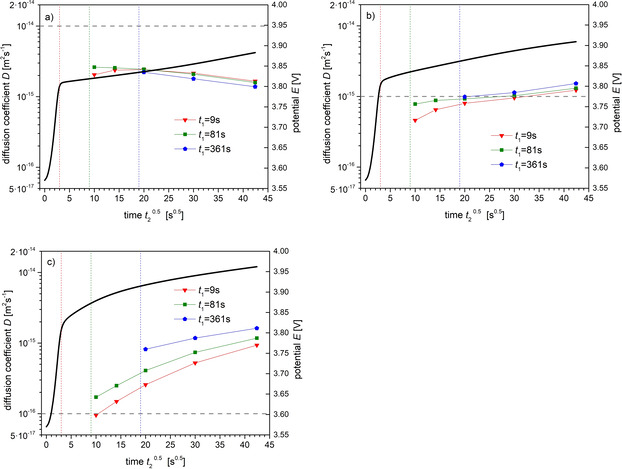
Derived diffusion coefficients in dependence on the time interval for parameters as in Figure 8, but with higher galvanostatic current i GS=0.1Am−2. See Figure 7 for explanations. The given diffusion coefficients (dashed horizontal lines) are D exa=10−14 (a), (b), and 10−16 m2 s−1 (c). Further parameters: T=−40 °C, k=10−8 mol m−2s−1, x0=0.9.
3. Discussion
The presented examples of the determination of the diffusion coefficient (Figures 6 to 9) demonstrate that considerable inaccuracies can appear in applying formula (3). To obtain diffusion coefficients as accurate as possible, the following issues are valuable.
Near room temperature, the double layer charging time is typically small compared to the duration of the GITT pulse. The upper cut time should be chosen sufficiently close to to exclude the later time region from the fit, where the plot exhibits a significant curvature, particularly for large diffusion coefficient. Accordingly, relatively short GITT pulses are sufficient (e. g. Ref. [25]). This would also increase the SOL‐resolution in the determination of the dependence on the SOL since the SOL‐change per pulse is small. With lowering the temperature, the double layer charging time strongly increases, especially at low galvanostatic current. Thus, sufficiently long pulses are necessary, e. g. for the examples in Figure 8. As a tendency, those examples reveal that a lower cut time well above (e. g. ) yields more accurate results. With increasing upper cut time , the diffusion coefficient is stronger overestimated (D small) or underestimated (D large) depending on the diffusion coefficient.
The calculations in Figure 8 were performed for an intentionally low galvanostatic current (to best guarantee the suppositions of the SPM at low temperature). Hence, the total time of a GITT analysis becomes inconveniently large. More typical is a current as chosen in Figure 9. For higher current, the double‐layer charging time considerably reduces at low temperature. The reduction of the charging time with lowering the rate constant (due to lower temperatures) is shown in Figure 10 for different galvanostatic currents. The charging time in Figure 10 is defined as the time when the current I BV through the EOI (cf. Eq. (4)) has reached 63 % of the galvanostatic current (i. e. ). Also, the charging time derived by the linear analysis above (cf. Eq. (10)) is displayed in Figure 10 for comparison. The plots show that, at low rate constant, the linear approximation is valid only for very small galvanostatic current.
Figure 10.
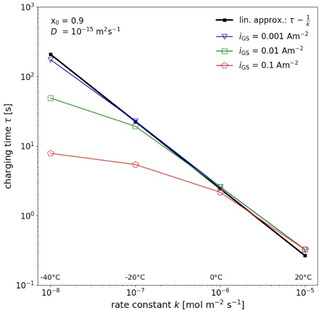
Calculated double‐layer charging time τ 63 as function of the rate constant for different galvanostatic currents together with the result of the linear analysis Eq. (10). The lines are guides for the eye. The temperatures corresponding to the different rate constants are indicated in the diagram.
According to the results in Figure 10, the use of a higher galvanostatic current seems advantageous since the charging time is considerably reduced and a smaller lower cut time can be chosen. However, this does not necessarily improve the accuracy of the derived diffusion coefficient, as demonstrated in Figure 9. Depending on the value of the given diffusion coefficient, a strong over‐ or underestimation of up to one order of magnitude can occur, particularly for t 1 well above τ dl. The over‐ or underestimation is presumably related to the different sign of the curvature of the plot with varying diffusion coefficient, current density and the SOL dependent curvature of the equilibrium curve. Due to this different behavior, there is no clear recommendation how to obtain best results for the diffusion coefficient.
The above discussion revealed two main reasons which complicate the determination of the diffusion coefficient at low temperature via formula (3): a comparatively long double‐layer charging time and an increasing violation of the supposition with increasing upper cut time . A further supposition in deriving formula (3) is that the slope of the equilibrium potential curve (Figure 4) is nearly constant within the SOL change at the oxide surface during one GITT pulse. As a tendency, high current and low diffusion coefficient lead to large ‐changes. For example, at the end of one GITT pulse for and , whereas for higher current and slower diffusion (initial SOL , , , ). The equilibrium potential curve in Figure 4 shows strong changes of the slope in the SOL‐range to , which causes deviations from the supposed behavior. Thus, to improve the diffusion analysis in this SOL region, it is important to choose short GITT pulses and small current. The former is however limited by the requirement . For preferably small current, the potential change during one pulse is comparatively small. However, at low temperature, the charge transfer resistance is high so that also small currents lead to well measurable potential changes.
4. Conclusions
The knowledge of the lithium diffusion coefficient at low temperature is important for the understanding and optimization of LIBs. Its determination by GITT turns out to be much more complicated than at room temperature. We proposed a model for predicting the potential change during GITT measurements, which is appropriate also at low temperature where the charge transfer resistance at the EOI is comparatively high. At low temperature, the charging time of the double‐layer capacitance of the EOI can become comparable with the duration of the galvanostatic current pulse. This impedes the determination of the diffusion coefficient from the measured data according to the well‐known method proposed by Weppner and Huggins. [14] Best results are obtained by choosing an appropriate time interval of the plot for determining the slope , which excludes the initial double layer charging and the late diffusion stage where can show a significant curvature if the time approaches . At low temperature and high galvanostatic current, the curvature of the plot can additionally be caused by the curvature of the equilibrium potential , which is typically pronounced for SOL values near . In limiting cases (cf. Figure 9c), there is no clear straight‐line segment of the plot for determining the proper slope . We hope that the simulation of potential pulses on the base of the proposed model, including double‐layer capacitance and charge transfer resistance data derived by EIS, will enable to determine the diffusion coefficient also in those complex limiting cases. This way, the accuracy of parameters determined by GITT over a wide temperature range might be improved to support knowledge‐based material development and targeted design optimization based on modeling and simulation of LIBs.
Conclusively we expect to find the behavior described here not only in Lithium intercalation materials but in intercalation materials in general.
Conflict of interest
The authors declare no conflict of interest.
Acknowledgements
This work was funded by the European Union and the Free State of Saxony via the project TTkin (grant no. 100225300 and 100259273). We acknowledge the Center for Information Services and High Performance Computing (ZIH) at TU Dresden for computational resources. Open access funding enabled and organized by Projekt DEAL.
T. Schied, A. Nickol, C. Heubner, M. Schneider, A. Michaelis, M. Bobeth, G. Cuniberti, ChemPhysChem 2021, 22, 885.
GITT: Galvanostatic intermittent titration technique.
Contributor Information
Dr. Thomas Schied, Email: thomas.schied@tu-dresden.de.
Prof. Gianaurelio Cuniberti, Email: gianaurelio.cuniberti@tu-dresden.de.
References
- 1. Cano Z. P., Banham D., Ye S., Hintennach A., Lu J., Fowler M., Chen Z., Nat. Energy 2018, 3, 279–289. [Google Scholar]
- 2. Zeng X., Li M., El-Hady D. A., Alshitari W., Al-Bogami A. S., Lu J., Amine K., Adv. Energy Mater. 2019, 9, 1900161. [Google Scholar]
- 3. Jaguemont J., Boulon L., Dubé Y., Appl. Energy 2016, 164, 99–104. [Google Scholar]
- 4. Zhu G., Wen K., Lv W., Zhou X., Liang Y., Yang F., Chen Z., Zou M., Li J., Zhang Y., He W., J. Power Sources 2015, 300, 29–40. [Google Scholar]
- 5. Amin R., Chiang Y.-M., J. Electrochem. Soc. 2016, 163, A1512–A1517. [Google Scholar]
- 6. Cabanero M. A., Boaretto N., Röder M., Müller J., Kallo J., Latz A., J. Electrochem. Soc. 2018, 165, A847–A855. [Google Scholar]
- 7. Cui S., Wei Y., Liu T., Deng W., Hu Z., Su Y., Li H., Li M., Guo H., Duan Y., Wang W., Rao M., Zheng J., Wang X., Pan F., Adv. Energy Mater. 2016, 6, 1501309. [Google Scholar]
- 8. Delacourt C., Ati M., Tarascon J. M., J. Electrochem. Soc. 2011, 158, A741–A749. [Google Scholar]
- 9. Ecker M., Tran T. K. D., Dechent P., Käbitz S., Warnecke A., Sauer D. U., J. Electrochem. Soc. 2015, 162, 9, A1836–A1848. [Google Scholar]
- 10. Hess A., Roode-Gutzmer Q., Heubner C., Schneider M., Michaelis A., Bobeth M., Cuniberti G., J. Power Sources 2015, 299, 156–161. [Google Scholar]
- 11. Shen Z., Cao L., Rahn C. D., Wang C. Y., J. Electrochem. Soc. 2013, 160, A1842–A1846. [Google Scholar]
- 12. Verma A., Smith K., Santhanagopalan S., Abraham D., Yao K. P., Mukherjee P. P., J. Electrochem. Soc. 2017, 164, A3380–A3392. [Google Scholar]
- 13. Yang S., Wang X., Yang X., Bai Y., Liu Z., Shu H., Wei Q., Electrochim. Acta 2012, 66, 88–93. [Google Scholar]
- 14. Weppner W., Huggins R. A., J. Electrochem. Soc. 1977, 124, 1569–1578. [Google Scholar]
- 15. Nickol A., Schied T., Heubner C., Schneider M., Michaelis A., Bobeth M., Cuniberti G., J. Electrochem. Soc. 2020, 167, 090546. [Google Scholar]
- 16. Guo M., Sikha G., White R. E., J. Electrochem. Soc. 2011, 158, A122–A132. [Google Scholar]
- 17. Santhanagopalan S., Guo Q., Ramadass P., White R. E., J. Power Sources 2006, 156, 620–628. [Google Scholar]
- 18. Crank J., The Mathematics of Diffusion, Clarendon Press, Oxford, 1975. [Google Scholar]
- 19. Legrand N., Raël S., Knosp B., Hinaje M., Desprez P., Lapicque F., J. Power Sources 2014, 251, 370–378. [Google Scholar]
- 20. Lück J., Latz A., Phys. Chem. Chem. Phys. 2018, 20, 27804–27821. [DOI] [PubMed] [Google Scholar]
- 21. Schmalstieg J., Rahe C., Ecker M., Sauer D. U., J. Electrochem. Soc. 2018, 165, A3799–A3810. [Google Scholar]
- 22. Tippmann S., Walper D., Balboa L., Spier B., Bessler W. G., J. Power Sources 2014, 252, 305–316. [Google Scholar]
- 23. Markevich E., Levi M. D., Aurbach D., J. Electroanal. Chem. 2005, 580, 231–237. [Google Scholar]
- 24. Shaju K. M., Rao G. V. S., Chowdari B. V. R., J. Electrochem. Soc. 2004, 151, A1324–A1332. [Google Scholar]
- 25. Zheng W., Shui M., Shu J., Gao S., Xu D., Chen L., Feng L., Ren Y., Bull. Mater. Sci. 2103, 36, 495–498. [Google Scholar]


