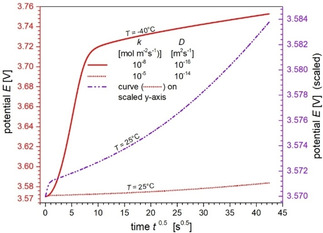
Figure 5.

Comparison of calculated potential changes during GITT pulses at 25 °C and −40 °C (red left axis) as a function of . Respective rate constant and diffusion coefficient were chosen to demonstrate expected changes of the potential with lowering the temperature. For better comparability, the pulse at 25 °C is also displayed in a scaled version (dash‐dotted line, purple right axis). Further parameters: , .
