

Abstract
The additive‐free tetrazine/enol ether click reaction was performed in ultra‐high vacuum (UHV) with an enol ether group covalently linked to a silicon surface: Dimethyl 1,2,4,5‐tetrazine‐3,6‐dicarboxylate molecules were coupled to the enol ether group of a functionalized cyclooctyne which was adsorbed on the silicon (001) surface via the strained triple bond of cyclooctyne. The reaction was observed at a substrate temperature of 380 K by means of X‐ray photoelectron spectroscopy (XPS). A moderate energy barrier was deduced for this click reaction in vacuum by means of density functional theory based calculations, in good agreement with the experimental results. This UHV‐compatible click reaction thus opens a new, flexible route for synthesizing covalently bound organic architectures.
Keywords: click chemistry, density functional calculations, silicon, surface chemistry, X-ray photoelectron spectroscopy
Catalyst‐free coupling of a tetrazine derivative and an enol ether group, the latter being covalently attached on a Si(001) surface via cyclooctyne, has been observed in ultra‐high vacuum by X‐ray photoelectron spectroscopy. DFT calculations identified the associated reaction meachanism. This click chemistry scheme allows the synthesis of covalently bound molecular architectures on highly reactive surfaces in a UHV environment.

Click reactions[ 1 , 2 ] are employed in various fields of chemistry such as drug development [3] and material science. [4] The concept is well developed for reactions in solution, including heterosequences of click reactions using orthogonal reaction types (Figure 1(a)). No general strategy for vacuum‐based click chemistry, in particular using orthogonal heterosequences, has been reported so far. This is mainly based on the fact that conventional click reactions are typically developed in solution and can require a catalyst; they are thus not compatible with a UHV‐based approach. On the other hand, highly reactive semiconductor surfaces are typically prepared under UHV conditions and vacuum‐based click chemistry could lead to predictable tailored layer‐by‐layer synthesis on such surfaces without the experimental challenge of transferring the samples from UHV to solution (and reverse). [5]
Figure 1.

a) Heterosequences of orthogonal click reactions are well established in solution. b) The reaction of dimethyl 1,2,4,5‐tetrazine‐3,6‐dicarboxylate with a methyl enol ether group attached to Si(001) via cyclooctyne was studied as part of such a heterosequence under ultra‐high vacuum conditions. c) Chemoselective adsorption of methyl enol ether‐substituted cyclooctyne (MEECO) on Si(001) is the first step of this heterosequence. Gas‐phase clicking as the second step can then lead to a well‐ordered organic bilayer.
A carefully tuned enolether/tetrazine cycloaddition has been shown to proceed in solution without catalyst. [6] It is thus a promising candidate for a vacuum‐based click reaction (Figure 1(b)). Furthermore, it is orthogonal to the strain‐promoted cycloaddition of cyclooctynes to azides. [7] Given the fact that substituted cyclooctynes can react in a chemoselective, strain promoted 2+2 cycloaddition on Si(001),[ 8 , 9 , 10 , 11 , 12 ] an orthogonal cycloaddition sequence under UHV‐conditions could be realized when combining both reaction schemes (Figures 1(b) and (c)).
Here we show experimentally by means of XPS that tetrazine/enol‐ether coupling can be performed under ultra‐high vacuum conditions at elevated substrate temperature. The results are backed by DFT calculations which find a moderate energy barrier for this reaction in the absence of solvent or catalyst. We employ this reaction for coupling a tetrazine molecule to an enol ether group which is covalently attached on a Si(001) surface via cyclooctyne as a linker (Figures 1(b) and (c)). In this context, UHV‐based click chemistry can be employed for the synthesis of covalently bound, complex organic architectures on surfaces[ 13 , 14 ] (Figure 1(c)), with many applications, e. g., in surface functionalization or organic electronics.
In Figure 2, N 1s core level spectra of different adsorption experiments are compared. No nitrogen signal is obtained from the MEECO‐covered surface (Figure 2(d)), which serves as the starting point of our experiment (compare Figure 1(b), left). When a multilayer of tetrazine molecules is physically adsorbed on the MEECO‐covered Si surface at 150 K, a clear nitrogen peak is observed (Figure 2(a)). However, this peak completely vanishes when the sample is heated to 300 K (Supporting Information, Figure S1). Thus, all tetrazine molecules again desorbed from the surface, indicating that no covalent bonds were established under these conditions. In contrast, a clear peak is observed at 401.6 eV when tetrazine is reacted on the MEECO‐covered Si surface at T S=380 K as shown in Figure 2(c). We interpret this peak as the result of the click reaction based on the following reasoning: first, we can exclude a direct binding of tetrazine via the nitrogen atoms to the silicon surface by comparison with Figure 2(b), which shows a measurement of tetrazine adsorbed on bare Si(001). In the latter case, two major peaks are observed at lower binding energy; the peak at 398.5 eV can be assigned to N atoms directly bound to silicon, [15] the peak at 400.0 eV is assigned to further nitrogen atoms in these molecules which are adsorbed on silicon via one or two nitrogen atoms. The small peak at 401.4 eV might be assigned to tetrazine molecules which do not bind via nitrogen atoms but solely via the ester groups to the silicon surface. Second, although the peak position is similar to the spectrum in Figure 2(a), we can exclude physisorbed tetrazine molecules to be the origin of the signal in Figure 2(c), as such physisorbed molecules were shown to desorb at temperature below room temperature. Thus the signal in Figure 2(c) indeed can be assigned to the tetrazine‐MEECO coupling which proceeds at temperatures higher than room temperature only. The similar peak position in Figure 2(a) and Figure 2(c) can be explained by the fact that the chemical environment of the nitrogen atoms does not change significantly when tetrazine is reacted with MEECO.
Figure 2.

N 1s spectra measured under different experimental conditions. a) Multilayer of tetrazine molecules physically adsorbed on the MEECO covered Si surface at 150 K. Tetrazine was adsorbed b) on bare Si(001) at 300 K or c) on MEECO/Si(001) at 380 K. In (c), one single peak is observed that can be assigned to the product of the click reaction of tetrazine on MEECO. d) For reference, the nitrogen spectrum measured directly after MEECO adsorption is shown, no N signal is identified.
Further evidence is obtained from the O 1s spectra shown in Figure 3, which were measured during the same experiments as the N 1s spectra shown in Figure 2. It has to be taken into account that the adsorbed MEECO on the Si(001) surface already accounts for three peaks in the O 1s spectra (Figure 3(d)), as discussed in detail in a previous work. [12] In brief, these components can be assigned to the intact ether group (534.1 eV), [16] oxygen from the ether group reacted on silicon (532 eV), [17] and a C=O group as a product of CH2 abstraction (532.7 eV). [18] In Figure 3(c), the spectrum of the tetrazine/enol‐ether coupling product is shown. Two additional peaks are observed, which are assigned to the C−O−C configuration (534.7 eV, brown) and the C=O configuration (533.2 eV, red) in the tetrazine molecule. Both of these configurations have been assigned in the spectrum of MEECO on silicon as well (Figure 3(d)), however, with a slightly different binding energy. This difference in binding energy results from two contributions: first, the two components are closely coupled in the ester group of the tetrazine derivative but there is always only one oxygen atom in the configurations related to MEECO on Si(001). Second, the total chemical environment is different: The reacted tetrazine molecule contains two nitrogen atoms, whereas no further heteroatom with an electronegativity higher than for carbon is present in the MEECO molecule. This assignment is further backed by the peak positions deduced from the DFT calculations shown in Figure 3(c).
Figure 3.

O 1s spectra measured under different experimental conditions. a) The spectrum of tetrazine on MEECO/Si(001) at 150 K. Most of the intensity (peaks at 533.3 and 535.0 eV, blue lines) can be assigned to the two oxygen species present in the tetrazine molecule. Additionally, the oxygen atoms from the adsorbed MEECO molecules contribute to the total intensity (orange components, cf (d), the O 1s spectrum after MEECO adsorption on Si(001)). b) The spectrum of tetrazine adsorbed on bare Si(001) at 300 K. The most intense peak at 532.2 eV can be assigned to O−Si, thus indicating that adsorption of tetrazine molecules on Si(001) involves on average more than one oxygen atom per tetrazine molecule. In combination with Figure 2(b), multi‐tethered molecules, including the O and N atoms, can be deduced from these experiments. c) The spectrum after tetrazine reaction on MEECO/Si(001) at 380 K. The peak of the intact enol ether group decreases; two additional peaks (brown and red) can be assigned to the oxygen atoms in the tetrazine molecule (cf Figure 1(b)); they are in good agreement with the calculated peak positions indicated by bars drawn in the respective color.
The peak at 534.0 eV, which is assigned to the intact enol ether group of MEECO, shows a reduced intensity in Figure 3(c) when compared to Figure 3(d). This can be seen as a further indication for the click reaction, which reduces the number of intact enol ether groups on the surface.
The corresponding C 1s spectra are shown in Figure 4. All spectra are dominated by the peaks of MEECO adsorbed on silicon (compare Figure 4(d)). In Figure 4(a), when tetrazine is adsorbed on MEECO/Si at 150 K, three further components at relatively high binding energy around 290 to 291 eV and between 286 and 288 eV can be measured. These peaks are assigned to the carbon atoms binding with the oxygen atoms (C−O; O−C=O) and nitrogen atoms in the intact tetrazine molecule. These three components are also present in the spectrum taken after tetrazine adsorption on Si(001) at 300 K (Figure 4(b)). The spectrum shown in Figure 4(c) was taken after reaction of tetrazine on a MEECO‐covered surface at T S=380 K. The contribution of the carbon atoms of tetrazine coupled to MEECO to the total carbon signal is low, as the number of reacted MEECO accounts only for approximately one fifth of the MEECO coverage. Nonetheless, we observe a small peak at a binding energy of 291 eV as indicated in the inset of Figure 4(c) which can be assigned to the C atom in the intact ester group (O−C=O) of the tetrazine molecules coupled to MEECO on Si(001).
Figure 4.

C 1s spectra measured under different conditions. a) Tetrazine adsorbed on MEECO/Si(001) at 150 K. Blue lines: components attributed to tetrazine (blue) and to MEECO on Si(001) (orange; cf (d)). b) Tetrazine adsorbed on Si(001) at 300 K. The components attributed in (a) to carbon atoms in tetrazine are shifted to lower binding energy due to adsorption of the molecule to silicon, thus increasing the electronic density also at the carbon atoms being in next neighborhood to the reacting N and O atoms. The spectrum measured after tetrazine reaction on MEECO/Si(001) at 380 K is shown in (c). The inset in (c) indicates a small signal at higher binding energy. In (d), the C 1s spectrum after the MEECO adsorption on Si(001) is shown for comparison.
We carried out DFT calculations to shed light on the reaction of adsorbed MEECO with tetrazine with the main results summarized in Figure 5. We start from intact MEECO adsorbed on Si(001) as investigated before. [12] The reaction with tetrazine first leads to a physisorbed pre‐complex 2–3 bound by 29 kJ mol−1 at room temperature (all energies refer to Gibbs free energies, ▵G). The reaction then proceeds via a moderate reaction barrier of 100 kJ mol−1 towards the post‐complex 4 which is already 75 kJ mol−1 more stable than the reactants. The final product 5 is then reached via loosing dinitrogen and methanol. Due to the very high thermodynamic driving force for this second reaction we did not investigate the reaction barrier. The transition state structure TS shows the early state of the formation of two C−C bonds that form the ring structure in the product. The bond lengths are still quite long (2.052 Å and 2.329 Å) in comparison to post‐complex 4 which shows typical values for C−C single bonds. This explains the moderate barrier since the strong deformation in both molecules at the transition state structure is not counter‐balanced by stabilization via bond formation processes. The barrier is nevertheless not too high to be overcome at room temperature and perfectly in line with the low reaction rates observed in experiment. For the higher reaction temperature of 380 K, we find the barrier only mildly increasing (+9 kJ mol−1).
Figure 5.
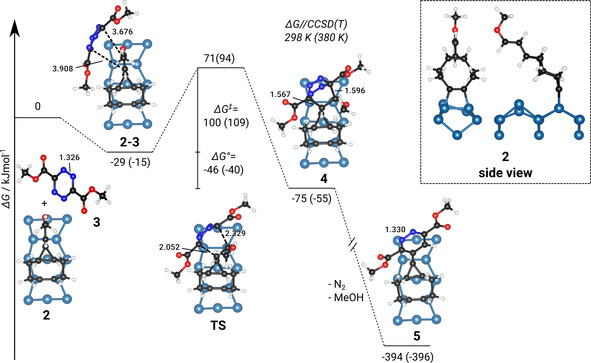
Computed reaction pathway (Gibbs free energy ΔG) of tetrazine with MEECO as adsorbed on Si(001). The reaction shows pre‐ (2–3) and post‐complexes (4) connected via a transition state structure (TS) and ends in the product (5) after loosing dinitrogen and methanol. Reaction energies including thermodynamic corrections and high‐level energy corrections are given at 298 and 380 K (in brackets) relative to the separated reactants. Selected bond lengths are given in Å.
In experiment, the reaction is only observed at elevated temperature while it is not observed when heating the MEECO‐covered surface which was prepared with a multilayer of physically bound tetrazine at 150 K (Figure S1, Supporting Information). This observation is in agreement with the theoretical results which suggest a substantial conversion rate from 2–3 to 4 only at elevated temperatures. When slowly heating the tetrazine‐covered surface, desorption via the rather low desorption barrier is favored over reaction via TS with its higher energy barrier.
At this point, we would like to note that, in the experiment, the MEECO‐covered surface consists of several products and is thus not homogeneous as assumed in the calculations. This may alter the quantitative comparison between experiment and calculations but should have no influence on the qualitative interpretation of the data.
As summarized in Figure 6, coupling between a tetrazine derivative and an enol ether group, the latter being covalently attached on a Si(001) surface via cyclooctyne, has been experimentally observed under ultrahigh vacuum conditions, i. e., in the absence of solvent or catalyst. Even under these conditions, the reaction proceeds via a moderate energy barrier between the physisorbed molecule and 4, as shown by means of DFT calculations. The further reaction towards the experimentally observed final product 5 then exhibits a strong thermodynamic driving force. In conclusion, this click chemistry scheme in combination with the chemoselective reactivity of substituted cyclooctynes (1→2 in Figure 6) allows for the synthesis of covalently bound molecular architectures in an UHV environment. As no catalyst is needed for the reaction investigated in this study, it can be applied on a substrate of choice, different to previously reported approaches, which were performed on the surfaces of Cu‐containing materials,[ 19 , 20 ] the latter acting both as substrate and catalyst.
Figure 6.
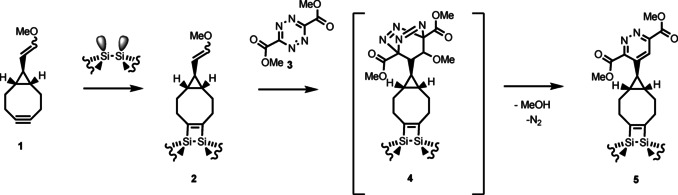
Summary of the reaction investigated: MEECO (1) reacts on the dimers of Si(001) via the strained triple bond of cyclooctyne forming 2. [12] 1,2,4,5‐Tetrazine‐3,6‐dicarboxylate (3) reacts with 2 via 4 to the final product 5 releasing N2 and MeOH.
Methods
The XPS experiments were performed in a UHV chamber with a base pressure <1×10⁻¹⁰ mbar. Si(001) samples were prepared by degassing at 700 K and repeated direct current heating cycles to 1450 K. A well ordered 2×1 reconstruction was obtained by cooling rates of about 1 K/s.[ 21 , 22 ] The preparation of methyl enol ether functionalized cyclooctyne (MEECO) on Si(001) was carried out according to Ref. [12]. MEECO adsorption on Si(001) preferentially takes place via the strained triple bond of the cyclooctyne ring; side reactions include ether cleavage and the formation of an aldehyde group. [12]
Synthesis of dimethyl 1,2,4,5‐tetrazine‐3,6dicarboxylate (short: tetrazine, Figure 1(b)) was carried out according to Ref. [6]. Tetrazine was dosed via a leak valve from the vapor phase in a test tube while the sample was kept at constant temperature using direct current heating of the sample and liquid nitrogen cooling of the sample holder. XPS measurements were performed using an Al Kα X‐ray source with a monochromator (Omicron XM1000) and a hemispherical energy analyzer (Omicron EA125). All XPS spectra were referenced to the Si 2p3/2 peak at 99.4 eV. [23] Voigt‐profiles were used for fitting the data; they are composed of 90 % Gaußfunction and 10 % Lorentzfunction. If not otherwise stated, full width at half maximum (FWHM) was approximately 0.9 eV in case of the single components of the C 1s and O 1s signals, and approximately 1.5 eV for the N 1s signals; these values are typical for XPS spectra measured in this setup.[ 15 , 24 ]
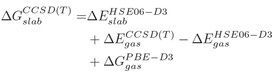
DFT investigations were done with the Vienna ab initio simulation package (VASP 5.4.4)[ 25 , 26 , 27 ] and standard PAW‐pseudopotentials PBE.54 [28] with a large core configuration while dispersion effects were considered via the DFT−D3 scheme including an improved damping function.[ 29 , 30 ] The plane wave energy cutoff was set to 400 eV and a total energy difference of at least 10−6 eV with “accurate” precision was used for SCF convergence. Structural optimizations were performed with the PBE‐D3 [31] exchange correlation functional with the force convergence criterion set to 10−2 eV/Å while more accurate energies were then derived using HSE06‐D3 [32] range‐separated hybrid functional as single‐point energies. For tetrazine, a planar structure has been used, PBE‐D3 gives an unphysically buckled structure as minimum. Transition‐state structures were calculated with the dimer method [33] as implemented in the transition state tools (1.73) for VASP with tighter electronic convergence of 10−7 eV. For the Si(001) slab calculations, a Γ‐centered 2×2×1 k‐mesh was chosen together with a setup of six layers (two bottom layers frozen and terminated with hydrogen atoms) as determined in previous work. [34] Thermodynamic corrections for the Gibbs energy were calculated at the PBE‐D3 level in a pseudo gas phase model by replacing all Si−C bonds with capping hydrogens while keeping the C=C distance fixed. Thus a restricted Hessian calculation is performed except for free molecules (tetrazine, dinitrogen, and methanol) for which the full Hessian is used. Scripts to extract thermodynamic data from the VASP output have been published elsewhere. [15] In order to improve the energies obtained with HSE06‐D3, OSV‐PNO‐CCSD(T) [35] calculations as implemented in TURBOMOLE 7.3 [36] were performed for the same gas phase model that was used for the thermodynamic corrections. The higher order correction is then given as follows:
O 1s XPS peaks were determined in the initial state approximation from recalculation of the core orbital Kohn‐Sham eigenvalues (VASP option: ICORELEVEL=1) and shifted by +25.7 eV.
Supporting Information
Supporting Information include XPS spectra on tetrazine adsorption on MEECO‐covered Si(001) after adsorption at 150 K and heating to 300 K as well as information on computational raw data.
Conflict of interest
The authors declare no conflict of interest.
Supporting information
As a service to our authors and readers, this journal provides supporting information supplied by the authors. Such materials are peer reviewed and may be re‐organized for online delivery, but are not copy‐edited or typeset. Technical support issues arising from supporting information (other than missing files) should be addressed to the authors.
Supplementary
Acknowledgements
We acknowledge financial support by the Deutsche Forschungsgemeinschaft through SFB 1083 (project‐ID 223848855). We thank HRZ Marburg, GOETHE‐CSC Frankfurt and HLR Stuttgart for computational resources. Open access funding enabled and organized by Projekt DEAL.
T. Glaser, J. Meinecke, L. Freund, C. Länger, J.-N. Luy, R. Tonner, U. Koert, M. Dürr, Chem. Eur. J. 2021, 27, 8082.
References
- 1. Kolb H. C., Finn M. G., Sharpless K. B., Angew. Chem. Int. Ed. 2001, 40, 2004–2021; [DOI] [PubMed] [Google Scholar]; Angew. Chem. 2001, 112, 2056–2075. [Google Scholar]
- 2. Sletten E. M., Bertozzi C. R., Angew. Chem. Int. Ed. 2009, 48, 6974–98; [DOI] [PMC free article] [PubMed] [Google Scholar]; Angew. Chem. 2009, 121, 7108–7133. [Google Scholar]
- 3. Peng B., Thorsell A.-G., Karlberg T., Schüler H., Yao S. Q., Angew. Chem. Int. Ed. 2017, 56, 248–253; [DOI] [PubMed] [Google Scholar]; Angew. Chem. 2017, 129, 254–259. [Google Scholar]
- 4. Xi W., Scott T. F., Kloxin C. J., Bowman C. N., Adv. Funct. Mater. 2014, 24, 2572–2590. [Google Scholar]
- 5. Glaser T., Meinecke J., Langer C., Heep J., Koert U., Dürr M., J. Phys. Chem. C 2021, 125, 4021–4026. [Google Scholar]
- 6. Meinecke J., Koert U., Org. Lett. 2019, 21, 7609–7612. [DOI] [PubMed] [Google Scholar]
- 7. Münster N., Nikodemiak P., Koert U., Org. Lett. 2016, 18, 4296–4299. [DOI] [PubMed] [Google Scholar]
- 8. Mette G., Dürr M., Bartholomäus R., Koert U., Höfer U., Chem. Phys. Lett. 2013, 556, 70–76. [Google Scholar]
- 9. Reutzel M., Münster N., Lipponer M. A., Länger C., Höfer U., Koert U., Dürr M., J. Phys. Chem. C 2016, 120, 26284–26289. [Google Scholar]
- 10. Pecher L., Tonner R., Theo. Chem. Acc. 2018, 137, 48. [Google Scholar]
- 11. Länger C., Heep J., Nikodemiak P., Bohamud T., Kirsten P., Höfer U., Koert U., Dürr M., J. Phys.: Condens. Matter 2019, 31, 034001. [DOI] [PubMed] [Google Scholar]
- 12. Glaser T., Meinecke J., Länger C., Luy J.-N., Tonner R., Koert U., Dürr M., ChemPhysChem 2020, 22, 404–409. [DOI] [PMC free article] [PubMed] [Google Scholar]
- 13. Devaraj N. K., Collman J. P., QSAR Comb. Sci. 2007, 26, 1253–1260. [Google Scholar]
- 14. Gouget-Laemmel A. C., Yang J., Lodhi M. A., Siriwardena A., Aureau D., Boukherroub R., Chazalviel J.-N., Ozanam F., Szunerits S., J. Phys. Chem. C 2013, 117, 368–375. [Google Scholar]
- 15. Heep J., Luy J.-N., Länger C., Meinecke J., Koert U., Tonner R., Dürr M., J. Phys. Chem. C 2020, 124, 9940–9946. [Google Scholar]
- 16. Glaser T., Länger C., Heep J., Meinecke J., Silly M. G., Koert U., Dürr M., J. Phys. Chem. C 2020, 124, 22619–22624. [Google Scholar]
- 17. Mette G., Reutzel M., Bartholomäus R., Laref S., Tonner R., Dürr M., Koert U., Höfer U., ChemPhysChem 2014, 15, 3725–3728. [DOI] [PubMed] [Google Scholar]
- 18. O'Donnell K. M., Byron C., Moore G., Thomsen L., Warschkow O., Teplyakov A., Schofield S. R., Phys J., Chem. C 2019, 123, 22239–22249. [Google Scholar]
- 19. Bebensee F., Bombis C., Vadapoo S.-R., Cramer J. R., Besenbacher F., Gothelf K. V., Linderoth T. R., J. Am. Chem. Soc. 2013, 135, 2136–2139. [DOI] [PubMed] [Google Scholar]
- 20. He C., Janzen R., Bai S., Teplyakov A. V., Chem. Mater. 2019, 31, 2068–2077. [Google Scholar]
- 21. Schwalb C. H., Lawrenz M., Dürr M., Höfer U., Phys. Rev. B 2007, 75, 085439. [Google Scholar]
- 22. Mette G., Adamkiewicz A., Reutzel M., Koert U., Dürr M., Höfer U., Angew. Chem. Int. Ed. 2019, 58, 3417–3420; [DOI] [PubMed] [Google Scholar]; Angew. Chem. 2019, 131, 3455–3458. [Google Scholar]
- 23. Reutzel M., Mette G., Stromberger P., Koert U., Dürr M., Höfer U., J. Phys. Chem. C 2015, 119, 6018–6023. [Google Scholar]
- 24. Länger C., Bohamud T., Heep J., Glaser T., Reutzel M., Höfer U., Dürr M., J. Phys. Chem. C 2018, 122, 14756–14760. [Google Scholar]
- 25. Kresse G., Hafner J., Phys. Rev. B 1993, 47, 558–561. [DOI] [PubMed] [Google Scholar]
- 26. Kresse G., Furthmüller J., Comput. Mater. Sci. 1996, 6, 15–50. [Google Scholar]
- 27. Kresse G., Furthmüller J., Phys. Rev. B 1996, 54, 11169–11186. [DOI] [PubMed] [Google Scholar]
- 28. Kresse G., Joubert D., Phys. Rev. B 1999, 59, 1758–1775. [Google Scholar]
- 29. Grimme S., Antony J., Ehrlich S., Krieg H., J. Chem. Phys. 2010, 132, 154104. [DOI] [PubMed] [Google Scholar]
- 30. Grimme S., Ehrlich S., Goerigk L., Comput. Mater. Sci. 2011, 32, 1456–1465. [DOI] [PubMed] [Google Scholar]
- 31. Perdew J. P., Burke K., Ernzerhof M., Phys. Rev. Lett. 1996, 77, 3865–3868. [DOI] [PubMed] [Google Scholar]
- 32. Krukau A. V., Vydrov O. A., Izmaylov A. F., Scuseria G. E., J. Chem. Phys. 2006, 125, 224106. [DOI] [PubMed] [Google Scholar]
- 33. Henkelman G., Jonsson H., J. Chem. Phys. 1999, 111, 7010–7022. [Google Scholar]
- 34. Pecher J., Tonner R., ChemPhysChem 2017, 18, 34–38. [DOI] [PubMed] [Google Scholar]
- 35. Schmitz G., Hättig C., Tew D. P., Phys. Chem. Chem. Phys. 2014, 16, 22167–22178. [DOI] [PubMed] [Google Scholar]
- 36.TURBOMOLE V7.2 2017, a development of University of Karlsruhe and Forschungszentrum Karlsruhe GmbH, 1989–2007, TURBOMOLE GmbH, since 2007; available from http://www.turbomole.com.
Associated Data
This section collects any data citations, data availability statements, or supplementary materials included in this article.
Supplementary Materials
As a service to our authors and readers, this journal provides supporting information supplied by the authors. Such materials are peer reviewed and may be re‐organized for online delivery, but are not copy‐edited or typeset. Technical support issues arising from supporting information (other than missing files) should be addressed to the authors.
Supplementary