

Abstract
Bladder cancer (BLCA) remains the leading cause of cancer‐related mortality among genitourinary malignancies worldwide. BLCA metastasis represents the primary reason for its poor prognosis. In this study, we report that decreased expression of partitioning defective 3 (Par3), a polarity protein (encoded by PARD3), is associated with tumor aggressive phenotypes and poor prognosis in BLCA patients. Consistently, ablation of Par3 promotes the metastasis and invasion of BLCA cells in vitro and in vivo. Further studies reveal that zinc finger protein Snail represses the expression of Par3 by binding to E2‐box (CAGGTG) of PARD3 promoter‐proximal. Inhibition of GSK‐3β promotes the expression and nuclear localization of Snail and then reduces the expression of Par3, resulting in the metastasis and invasion of BLCA cells. Moreover, we detected the interaction between Par3 (936‐1356 aa) and ZO‐1 (1372‐1748 aa), which is involved in the maintenance of tight junction. Together, our results demonstrate that the GSK‐3β/Snail/Par3/ZO‐1 axis regulates BLCA metastasis, and Snail is a major regulator for Par3 protein expression in BLCA.
Keywords: bladder cancer, GSK‐3β, metastasis, Par3, Snail
We report here that (a) polarity protein Par3 is frequently lost in BLCA patients and is associated with muscle‐invasive phenotypes and poor prognosis; (b) Par3 deficiency is required for BLCA invasion and metastasis in vitro and in vivo; (c) Snail suppresses Par3 expression through its binding to PARD3 E2‐box; and (d) overexpression of Par3 abolishes LiCl‐ or Snail‐induced BLCA metastatic behaviors, suggesting a role of the GSK‐3β/Snail/Par3 axis in regulating BLCA metastasis.

1. INTRODUCTION
Bladder cancer (BLCA) is one of the most frequent genitourinary malignant tumors worldwide, with more than 199 000 deaths per year. 1 Localized urothelial carcinoma of the bladder (UCB) is broadly categorized into non–muscle‐invasive bladder cancer (NMIBC) and muscle‐invasive disease. NMIBC is the most common form of BLCA, with frequent recurrences and risk of progression. Although many of these patients have experienced effective treatment including chemotherapy, radiotherapy, and radical cystectomy, the prognosis of BLCA patients is still unsatisfactory due to distant metastases. 2 Patients with high‐risk NMIBC that do not respond to adjuvant therapy with the standard‐of‐care immunotherapy, bacille Calmette‐Guérin (BCG), constitute a challenging patient population to manage. 3 Approximately one‐third of BLCA patients develop muscle‐invasive disease, and the 5‐year survival of these patients drops to a measly 5%. 4 Therefore, a better understanding of critical molecules or factors responsible for the metastasis is crucial for developing novel strategies for BLCA treatment.
Previous studies mostly focus on the clinical therapy of invasive BLCA, but the mechanisms that contribute to the complicated characteristics of BLCA pathology remain limited. Frequent mutations of p53 have been reported in 50% of invasive BLCAs, suggesting the importance of the p53 regulatory pathway in developing aggressive BLCA. 5 Loss of p53 in the background of mutant H‐ras induced low‐ and high‐grade papillary neoplasms but not enough to trigger invasion, implying that additional complex regulatory events are required to render an entirely aggressive phenotype. 6 RNA‐seq on invasive BLCA tissues indicated that fibulin‐3 served as a proinvasive factor in BLCA, which might be mediated through modulation of the expression of insulin‐like growth factor–binding protein‐5 (IGFBP5). 7 Another study found that lncRNA GClnc1 promoted proliferation and invasion of BLCA through activation of MYC. Previous observations point toward the activation of the phosphoinositide 3‐kinase (PI3K)/AKT/GSK3β and Wnt/β‐catenin pathways as a potential driver of an invasive phenotype. 8 In BLCA, the PI3K/AKT pathway displayed genetic alterations, dysregulation of expression, and involvement in proliferation, metastasis, and angiogenesis. 9 Furthermore, GSK3β contributed to epithelial‐to‐mesenchymal transition (EMT) and the metastasis of BLCA. 10
Epithelial cell polarity and cell‐cell junction are the basis of tissue function and often regarded as "gatekeepers" for tumorigenesis and metastasis. 11 Tumor cells undergo tight‐junction dissolution, disruption of cell polarity, and reorganization of the cytoskeletal architecture, which enable cells to develop an invasive phenotype. 12 Junctions between neighboring urothelium cells are required to establish and maintain cell polarity, suggesting that loss of cell‐cell adhesion and the alteration of cell polarity are involved during invasion. 13 Cell polarity is regulated by three conservative polarity complexes: PAR, Crumbs, and Scribble. The PAR polarity complex, which consists of Par3, Par6, and atypical PKCs, is essential in defining the apical‐basal membrane border and the tight junction in epithelial cells. 14 Notably, loss of polarity protein Par3 has been reported in multiple types of cancer metastasis, including breast, lung, and ovary cancer. 15 Par3 deficiency conjunction with oncogenic activation promotes invasion and metastasis via Stat3 activity in mammary and lung tumors. 16 Par3 was also reported to exert its tumor suppressor function via its regulation of aPKC activity. 17
Transcription factor Snail has a critical role in inhibiting E‐cadherin expression and promoting the loss of epithelial characteristics, including epithelial polarity and cell junctions. 18 Previous reports have investigated that high expression of Snail predicts a poor prognosis in various tumors of epithelial origin, 19 including BLCA. 20 The activity or expression levels of Snail is regulated by GSK‐3β, a multitasking kinase of the PI3K/Akt and WNT/β‐catenin pathways. 21 GSK3β promotes the cytoplasmic export and ubiquitin‐mediated proteasome degradation of Snail, 22 and GSK‐3β/Snail signaling might be involved in the metastasis of BLCA. 10 Many oncogenic pathways such as MAPK and Wnt could govern human cancer invasion and metastasis through the regulation of GSK3β activity. 23 The abnormal activation of Wnt/β‐catenin signaling has been shown to contribute to bladder tumorigenesis. 24
In this study, we demonstrate that Par3 is frequently lost in BLCA. Snail inhibits the expression of Par3 via its repressing PARD3 transcriptional activity by binding to the E2‐box of PARD3 promoter region, which promotes BLCA metastasis. Furthermore, PARD3 overexpression can abolish BLCA cell migration and invasion induced by LiCl or SNAI1 knockdown, suggesting Par3 deficiency may facilitate BLCA metastasis via the GSK‐3β/Snail axis.
2. MATERIALS AND METHODS
2.1. Patients and specimens
A total of 127 BLCA patients who underwent surgical resection and were pathologically diagnosed with BLCA in Shanghai General Hospital (Shanghai, China) were enrolled in the study. This study was approved by the research ethics committee of Shanghai General Hospital, and informed consent was obtained from each patient before clinical data analyses. Postsurgical follow‐up of patients was performed as previously described. Overall survival (OS) was defined as the time interval from surgery to death.
Another 32 pairs of freshly collected tumor tissues and adjacent nontumor bladder tissues were used for quantitative reverse transcription polymerase chain reaction (qRT‐PCR) and Western blot analysis.
2.2. Generation of mutation plasmids
PARD3 promoter sequence (−200/+100) was obtained from genomic DNA of human SV‐HUC‐1 cell line by PCR. Mutagenesis of the Snail sites in the human PARD3 promoter was performed by the Q5® site‐directed mutagenesis kit (NEB) using primers shown in Table S2. All truncated mutant cDNA of the PARD3 promoter and SNAI1 were cloned into mammalian expression vector pcDNA3.1 (−) (Invitrogen). Vectors were digested with restriction enzymes (New England Biolabs), and linear fragments were purified using a gel extraction kit (Qiagen). The truncated mutants were amplified and ligated into the linearized vector using T4 DNA ligase and transformed into DH5α chemically competent Escherichia coli. Colonies were screened for inserts of correct size via restriction enzyme digestion, and the plasmids were verified by sequencing.
2.3. ChIP‐PCR
Chromatin immunoprecipitation (ChIP) assays were carried out using Simple ChIP enzymatic chromatin IP kits (Cell Signaling Technology). Briefly, cells with indicated treatments were incubated for 10 minutes with 1% formaldehyde solution at room temperature, followed by incubation with 125 mM glycine. Antibodies used for ChIP were as follows: rabbit anti‐Snail (5 μg per IP sample) and normal rabbit IgG (5 μg per IP sample). A Qiagen PCR purification kit was used to purify the DNA. For the Snail binding site at position +76 of the human PARD3 promoter, ChIP‐qPCR was performed to analyze Snail enrichment at different Par3 levels of cells. The DNA fragments that were immunoprecipitated by anti‐Snail antibody were analyzed by quantitative PCR using TB Green® Fast qPCR Mix (TaKaRa). PCR products were analyzed in a 1.5% agarose gel by ethidium bromide staining. See Table S2 for primer information.
2.4. Fluorescent multiplex immunohistochemistry
Fluorescent multiplex immunohistochemistry (mIHC) involving tyramide signal amplification (TSA®) was employed to detect multiple proteins of interest in a given tissue section in a stepwise fashion. The optimal antibody dilution was predetermined by experiments. Tissue sections following deparaffinization/rehydration and antigen unmasking were incubated with 3% H2O2 solution for 10 minutes to quench endogenous peroxidase activity. Sections were then incubated with primary antibody diluted in 1× TBST for 1 hour. Tissue sections were covered in several drops of mIHC detection reagent specific to the species of the primary antibody. Fluorophore‐conjugated TSA® Plus amplification reagent was diluted as manufacturer's recommendation. 300 μL was applied per section. Sections were incubated for 10 minutes at room temperature in a humidified chamber, protected from light. For serial staining, we used microwave, brought slides to boil in 10 mM sodium citrate buffer (pH 6.0), and maintained them at a sub‐boiling temperature for 10 minutes. Slides were cooled to room temperature on bench top for 30 minutes, and we proceeded with staining/detection using a different tyramide‐fluorophore conjugate. Randomly selected fields were photographed by a spectral imaging system (Vectra Polaris; PerkinElmer). Antibodies are listed in Table S3.
2.5. Animals
To establish the metastasis model, 4 to 6–week‐old NOD‐SCID mice were purchased from Shanghai SLAC Laboratory Animal Co., Ltd (Shanghai, China) and fed in a pathogen‐free animal facility under standard conditions. All animal procedures were performed according to the criteria outlined in the "Guide for the Care and Use of Laboratory Animals" prepared by the National Academy of Sciences and published by the National Institutes of Health (NIH publication 86‐23 revised 1985). Studies were approved by the Shanghai Medical Experimental Animal Care Commission.
2.6. Lung metastatic tumor model
The mice were randomly allocated to eight groups according to the BLCA cells received: RT4‐shCtrl, RT4‐shPARD3, RT4‐SNAI1, RT4‐SNAI1 + PARD3, TCCSUP‐Ctrl, TCCSUP‐PARD3, TCCSUP‐shSNAI, and TCCSUP‐shSNAI1 + shPARD3. For each group, six mice were recruited. To establish the lung metastasis model, BLCA cells (1 × 10⁶ in 150 μL PBS) were injected into each narcotized mice's tail vein. All the mice were sacrificed humanely 6 weeks later. Whole lung of each mouse was removed, fixed with 10% buffered formalin, embedded in paraffin, and serially sectioned. Paraffin sections were stained with hematoxylin‐eosin (HE), and the number of metastatic lesions in lungs was counted under a microscope.
2.7. Statistical analysis
OS was plotted by the Kaplan‐Meier method and compared by log‐rank test. Pearson test was used to evaluate the correlation between gene expression profiles. Comparisons between groups for statistical significance were carried out with Student’s t‐test. All the functional experiments were performed in triplicate, and the results were presented as mean value ± SD. The statistical analysis was performed using SPSS 20.0 software (IBM) or Prism GraphPad 8.0 software. The level of significance in the statistical analyses is indicated as *P < .05; **P < .01; ***P < .001.
3. RESULTS
3.1. Loss of Par3 correlates with poor prognosis in human BLCA
To investigate the distribution of the PAR complex in BLCA, we employed immunofluorescence histochemical staining and found that the members of the PAR polarity complex were mainly localized to the transitional epithelium of the bladder wall (Figure S1A,B). RNA‐sequencing results from The Cancer Genome Atlas (TCGA), genotype‐tissue expression (GTEx), and gene expression omnibus (GEO) database indicated that the mRNA level of PARD3, but not PARD6, PRKCI, or PRKCZ, was reduced in BLCA (Figure 1A,B and Figure S1C). We then examined the mRNA and protein levels of Par3 in BLCA specimens and the matched noncancerous tissues by qPCR and Western blot analysis. Consistent with the results of TCGA and GEO dataset, Par3 was downregulated in BLCA compared with the matched 32 adjacent tissues (Figure 1C,D). Par3 expression was further investigated in the cohort of BLCA patients by IHC. Compared with the adjacent urothelium, Par3 protein expression was significantly lower in 127 cancerous tissues (Figure 1E‐G). Besides, we then divided patients into a low‐ (IHC score < 4) and a high‐expression (IHC score ≧ 4) group. Low expression of Par3 was correlated with clinical‐pathological parameters such as high‐grade (P = .032) and muscle‐invasive (P = .020) (Table S1). Furthermore, according to the median expression level of PARD3 (7.705) in GSE13507, we found that low expression of PARD3 in BLCA tissue was associated with shorter OS, compared with patients with tumors expressing high level of PARD3 (Figure 1H), which was consistent with the result from TCGA dataset showing that decreased PARD3, but not PARD6, PRKCI, or PRKCZ, predicted poor prognosis (Figure S1D). Together, the decrease of Par3 expression correlates with poor prognosis in BLCA and may contribute to metastasis of BLCA.
FIGURE 1.

Loss of Par3 correlates with poor prognosis in human bladder cancer (BLCA). A, B, The mRNA levels of PARD3 gene are lower in tumors than those in paired nontumor tissues. Data from The Cancer Genome Atlas (TCGA) (A) and GSE13507 (B) dataset (log2TPM) were analyzed and shown as violin plots. *P < .05 by Student's t‐test. C, PARD3 mRNA expression decreases in BLCA tissues. PARD3 mRNA levels in 32 paired BLCA and adjacent nontumor tissues were determined by qPCR. Relative values of PARD3 were normalized with GAPDH. ***P < .001 by Student's t‐test. D, Par3 protein levels in BLCA tissues (T) are lower than those in adjacent normal samples (N). Left panel: representative expression pattern of Par3 protein. Right panel: relative intensity of Par3 normalized to β‐actin. Values are mean ± SD. ***P < .001 by Student's t‐test. n = 32. E, Representative immunohistochemical staining (IHC) images of Par3 in BLCA and adjacent normal urothelium. Upper scale bar, 200 μm; lower scale bar, 50 μm. F, Significantly lower Par3 immunostaining in BLCA tissues compared with adjacent urothelium tissues. Scale bar, 50 μm. Adjacent (n = 46), BLCA (n = 127). G, Par3 protein staining in BLCA tissues is lower than that in adjacent normal samples. Par3 IHC score was quantified and shown. ***P < .001 (left panel: two‐sided unpaired t‐test, right panel: two‐sided paired t‐test). H, Low PARD3 expression is associated with significantly worse overall survival. n = 165, log‐rank test
3.2. Loss of Par3 promotes BLCA metastasis
To investigate the biologic role of Par3 in BLCA cell proliferation and invasion, we first explored Par3 expression in low‐grade BLCA cells with lower metastatic potential (RT4 and 5637) and high‐grade BLCA cells prone to distant metastases (TCCSUP and UMUC3). 25 Endogenous Par3 protein is decreased as a function of increased metastatic capability in BLCA cells, whereas normal urothelial cell SV‐HUC‐1 expressed the highest Par3 protein compared with BLCA cells (Figure S2A). We then generated stable PARD3‐knockdown cell lines in RT4 and 5637 cells with higher Par3 expression, and stable PARD3‐overexpression cell lines in TCCSUP and UNUC3 cells with lower Par3 expression (Figure S2B,C). Cell viability, indicated by CCK‐8 proliferation assay, was not altered in PARD3‐overexpression or ‐knockdown BLCA cells (Figure 2A). Next, transwell migration assay and invasion assay were performed. The results showed that knockdown of PARD3 increased cell migration and invasion capability, while PARD3 overexpression led to an attenuation of aggressive behavior (Figure 2B‐E). To further explore the effect of PARD3 on the invasion of BLCA cells in vivo, a lung metastasis model was generated. More lung cancerous nodes were observed in mice injected with PARD3‐knockdown RT4 cells than in those injected with the empty vector (Figure 2F). In contrast, highly invasive TCCSUP cells, subject to PARD3 overexpression, formed fewer lung cancerous nodes (Figure 2G). These results indicate that Par3 inhibits BLCA cell migration and invasion.
FIGURE 2.

Loss of Par3 promotes bladder cancer (BLCA) metastasis. A, Par3 does not affect the proliferation of BLCA cells. CCK‐8 cell proliferation assays were performed with the BLCA stable cells mentioned in Figure S2B‐C. Data are presented as mean ± SD. B‐E, Par3 deficiency promotes the migration and invasion of BLCA cells. Transwell assays were used to determine the migration (B, D; left panel) and invasion (C, E; left panel) abilities of the referred BLCA stable cells. Scale bar, 100 μm. Quantification of the relative cells (B‐E, left panel) was performed by ImageJ and is shown in the right panels of B‐E, respectively. F‐G, Par3 deficiency promotes lung metastasis of BLCA cells in vivo. Lung metastatic tumor models were developed by injecting indicated BLCA cells into the tail vein of NOD‐SCID mice. Hematoxylin‐eosin (HE) staining images of lung metastatic nodules from each group were exhibited (F, G; left panel). Left scale bar, 200 μm; right scale bar, 50 μm. Ten regions were randomly selected from each mouse lung, and the number of metastatic nodes were counted (F, G; right panel). Values are mean ± SD. n = 6. ***P <.001 by Student's t‐test
3.3. PARD3 promoter activity is repressed by Snail through its binding to PARD3 E2‐box
Genetic alteration and epigenetic inactivation are two major causes for the loss of suppressor genes. By searching the cBioPortal database, we found that PARD3 exhibits a low mutation rate (3.7%, 91/2410, including 57 duplicate mutations in patients with multiple samples) in BLCA tissues, the missense mutation is 2.2% (55/2410), and the truncating mutation is 1.5% (36/2410) (Figure S3A,B). Furthermore, PARD3 mutation does not affect its mRNA level (Figure S3C). Besides, in the variation of PARD3 copy number, diploid accounts for 50.8% (687/1352), shallow deletion accounts for 17.9% (242/1352), gain accounts for 28.8% (389/1352), deep deletion and amplification account for only 2.5% (34/1352), and no significant decrease of PARD3 mRNA in BLCA with the alteration of PARD3 copy number was found, suggesting copy number is not the reason for reduced PARD3 expression level (Figure S4). Moreover, TCGA dataset shows a low CpG methylation level (β < .2, n = 316) in the promoter region of PARD3 gene (Figure S5A,B). It appears that genetic mutation, copy number, and DNA methylation have less effect on PARD3 expression in BLCA.
We then analyzed the proximal region of PARD3 transcription start sites (TSS) and identified an E2‐box–type element (ACAGGTG) (Figure 3A‐C) which has been shown to bind the zinc finger clusters of Snail in PARD3 promoter‐proximal. 22 To verify whether Snail regulates the transcriptional activity of the PARD3 promoter, we first transiently cotransfected full‐length Snail expression plasmid with reporter plasmids driven by the PARD3 core promoter (−200/+100) into SV‐HUC‐1 cells and found a 60% decrease in the activity of PARD3 promoter caused by wild‐type Snail overexpression (Figure 3D, lower panel). To address the specificity of Snail action, point mutations at PARD3 promoter E2‐box +77 (G to A) or +78 (T to G) sites were applied (Figure 3D, upper panel). E2‐box mutation relieved the suppression of PARD3 promoter activity regulated by Snail (Figure 3D, lower panel), suggesting the key role of E2‐box in Snail‐mediated activity of PARD3 promoter. Next, Snail zinc finger domains were mutated (C2H2 to C2YH or C2HC to C2YC) (Figure 3E, upper panel) and cotransfected with the PARD3 promoter into cells. We found that ZF4 mutant was able to repress PARD3 promoter activity, whereas the mutation of ZF1, ZF2, and ZF3, respectively or together, hardly inhibited PARD3 promoter activity (Figure 3E, lower panel). So ZF1, ZF2, and ZF3 might be the crucial motifs regulating the activity of PARD3 promoter.
FIGURE 3.

PARD3 promoter activity is repressed by Snail through its binding with PARD3 E2‐box. A, The sequence bound to Snail is predicted by JASPAR. B Snail binds to the promoter region of PARD3 gene. C, The canonical binding site of Snail predicted by JASPAR is manifested by the sequence logograph. D, Snail represses PARD3 promoter activity through E2‐box. The E2‐box of PARD3 promoter was mutated respectively as indicated (upper panel). Luciferase reporter assays were conducted to determine the activity of PARD3 promoter (lower panel). Values are mean ±SD. ***P <.001, Student's t‐test compared with wild type (WT). E, Three zinc finger clusters of Snail repress the activity of PARD3 promoter. The zinc finger clusters of Snail were mutated respectively as indicated (upper panel). PARD3 promoter luciferase reporter assays were performed (lower panel). Values are mean ±SD. **P <.01, ***P <.001, Student's t‐test compared with wild type (WT). F, Snail binds to the E2‐box of PARD3 promoter. ChIP was applied to determine the binding of wild‐type and mutated E2‐box to Snail. Snail antibody enriched the DNA sequence of wild‐type E2‐box. PCR quantification of the immunoprecipitated DNA was measured. Normal rabbit IgG was used as negative control (NC); Poll 2 was used as positive control (PC). G, Three zinc finger clusters of Snail bind to the E2‐box of PARD3 promoter. Interaction between PARD3 promoter and mutated Snail was determined by ChIP with Snail antibody. The immunoprecipitated DNA was amplified and quantified. Normal rabbit IgG was used as negative control (NC); Poll 2 was used as positive control (PC). H, Mutation visualization of human bladder cancer genomic dataset. Data were obtained from the International Cancer Genome Consortium (ICGC) database
To demonstrate the interaction between Snail and PARD3 promoter, ChIP was conducted and showed that E2‐box mutation caused a loss of binding between PARD3 promoter and Snail (Figure 3F). Moreover, Snail mutation in ZF1, ZF2, and ZF3 displayed a deficiency of interaction between Snail and PARD3 promoter, while ZF4 mutation did not alter this interaction (Figure 3G). Together with the analysis of the International Cancer Genome Consortium (ICGC) database showing that there are no mutations (including single base substitution, deletion, and insertion) at the PARD3 site binding to Snail in BLCA (Figure 3H), our data suggest that three zinc finger clusters of Snail bind to PARD3 E2‐box, thereby repressing PARD3 promoter activity.
3.4. Snail represses Par3 expression in vitro and in vivo
As Snail was capable of repressing PARD3 promoter activity, we then investigated the correlation between Snail and Par3 expression in BLCA cells. We first generated stable SNAI1‐overexpression and SNAI1‐knockdown SV‐HUC‐1 cells (Figure S6A,B). At both mRNA and protein levels, SNAI1 overexpression effectively repressed the expression of Par3, while SNAI1 deficiency led to an accumulation of Par3 (Figure 4A,B). The protein levels of Par3 and Snail in four BLCA cell lines were then determined, and the results indicated that TCCSUP and UMUC3 exhibited low levels of Par3 protein but high levels of Snail protein (Figure 4C). Consistently, SV‐HUC‐1, RT4, and 5637 cells had more Par3 expression but less Snail protein (Figure 4C). Total cell lysates from TCCSUP, UMUC3, RT4, and 5637 cells were subjected to ChIP with anti‐Snail antibody or control IgG. PCR assay revealed a significant accumulation of Snail at PARD3 promoter in TCCSUP and UMUC3 cells with low expression of Par3 (Figure 4D), confirming the finding that Snail regulates Par3 expression by binding to PARD3 promoter and repressing its transcription. Additionally, we performed IHC to examine Par3 and Snail protein expression in 39 specimens of BLCA patients (Figure 4E) and found negative correlation between Snail and Par3 protein levels in BLCA tissues (Figure 4E‐G).
FIGURE 4.

Snail represses Par3 expression in vitro and in vivo. A, Snail negatively regulates Par3 protein level. Snail was stably overexpressed or knocked down in SV‐HUC‐1 cells, and immunofluorescence analysis was performed to determine the protein levels of Snail (green) and Par3 (red). Scale bar, 50 μm. B, Snail represses Par3 expression at both mRNA and protein levels. The mRNA and protein levels of Par3 and Snail in SNAI1‐overexpression or SNAI1‐knockdown cells were measured by PCR and Western blot (WB), respectively. C, Bladder cancer (BLCA) cells with lower Snail protein level express higher level of Par3 protein. The protein levels of Par3 and Snail in BLCA cells were determined by Western blot. β‐actin was used as a loading control. D, Snail accumulation at PARD3 promoter reduces Par3 protein expression. Total cell lysates of indicated cells were subject to ChIP with anti‐Snail antibody or control IgG. qPCR with PARD3 primers was used to test the level of PARD3 promoter sequence, indicating the enrichment of Snail at PARD3 promoter. Values are mean ± SD. **P < .01 by Student's t‐test. E‐G, Par3 protein expression is negatively associated with Snail protein. The expression patterns of Par3 and Snail in 39 BLCA tissues were determined by immunohistochemistry (IHC). Upper scale bar, 200 μm; lower scale bar, 50 μm (E). The staining intensity of Snail and Par3 was quantified and is presented as mean ± SD (F). **P < .01 by Student's t‐test. Pearson's correlation between Par3 and Snail IHC score in 39 BLCA tissues is shown (G)
3.5. Par3 deficiency mediates Snail promoting BLCA cell migration and invasion
We stably knocked down PARD3 or overexpressed SNAI1 in RT4 and 5637 cells, and overexpressed PARD3 or knocked down SNAI1 in TCCSUP and UMUC3 cells, respectively (Figure S6C,D). These cells were subjected to CCK‐8 assays, and the results revealed that neither Par3 nor Snail manipulation altered cell proliferation ability (Figure 5A). Cell migration and invasion abilities were then detected by transwell migration assay and invasion assay. Both PARD3 knockdown and SNAI1 overexpression led to a significant increase of cell migration and invasion ability in RT4 and 5637 cells (Figure 5B,C). Furthermore, SNAI1 overexpression–mediated enhancement of migration and invasion was partially rescued by PARD3 overexpression (Figure 5B,C). Either PARD3 overexpression or SNAI1 knockdown resulted in remarkable suppression of migration and invasion abilities, and SNAI1 knockdown–reduced migration and invasion abilities were restored by PARD3 knockdown in TCCSUP and UMUC3 cells (Figure 5D‐E). Moreover, we developed a lung metastasis model in NOD‐SCID mice by injecting BLCA cells into the tail vein. HE staining of lung tissue sections revealed that PARD3 knockdown or SNAI1 overexpression in lower‐invasive RT4 cells led to more lung cancerous nodes, while highly invasive TCCSUP cells, subject to PARD3 overexpression or SNAI1 knockdown, formed less lung cancerous nodes (Figure 5F,G). Similarly, PARD3 overexpression blocked the effect of SNAI1 overexpression in the lung metastasis model, while PARD3 knockdown–restored SNAI1 knockdown decreased the number of lung cancerous nodes (Figure 5F,G). Together with the data that Snail overexpression strongly decreased the level of Par3 protein, while Snail absence led to the accumulation of Par3 in cells (Figure S6E,F), this implies that Snail promotes BLCA cells migration and invasion via inhibiting Par3 expression.
FIGURE 5.
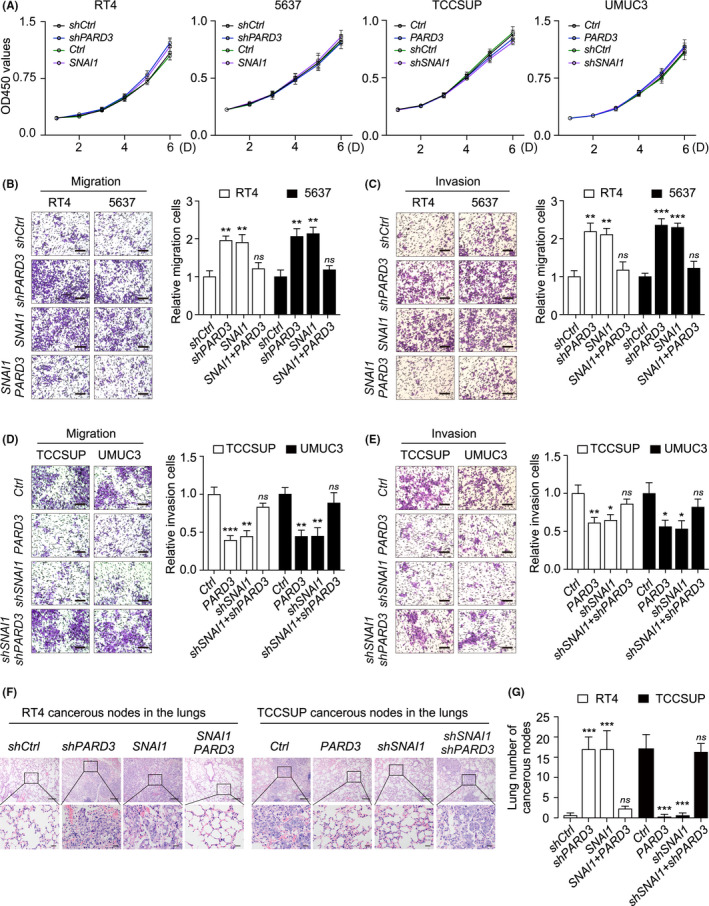
Par3 deficiency–mediated Snail promoting bladder cancer (BLCA) cell migration and invasion. A, Snail or Par3 manipulation does not affect BLCA cells' growth. CCK‐8 assays were performed to measure the proliferation of indicated cells. B‐E, An increase of Snail protein promotes the migration and invasion of BLCA cells, which could be rescued by PARD3 overexpression. The migration (B, D; left panel) and invasion (C, E; left panel) of indicated cell lines were determined by transwell and Matrigel invasion assays. Scale bar, 100 μm. Quantification was performed by ImageJ and shown in the right panels of B, C, D, E, respectively. Values are mean ± SD. *P < .05, **P < .01, ***P < .001 by Student's t‐test. ns, not significant. F‐G, Par3 overexpression blocks Snail upregulation–increased lung metastasis in vivo. Lung metastatic tumor models were developed. HE staining images of lung metastatic nodules from each group were exhibited (F). Upper scale bar, 200 μm; lower scale bar, 50 μm. Ten regions were randomly selected from each mouse lung, and the number of metastatic nodes was counted (G). Values are mean ± SD. n = 6. ***P < .001, ns, not significant, by Student's t‐test
3.6. GSK‐3β phosphorylation promotes the expression and nuclear localization of Snail
The phosphatidylinositol‐3‐OH kinase (PI[3]K)/Akt, MAPK, and Wnt pathways have been implicated in Snail‐mediated EMT and invasion. 21 , 22 We then treated the cells with epidermal growth factor (EGF) and LiCl to activate the Akt, MAPK, and Wnt pathways, and detected a significant induction of phosphorylated GSK‐3β (p‐GSK‐3β) at Ser9, a more substantial accumulation of Snail, and a decrease of Par3 in RT4 and 5637 cells (Figure 6A,B). PI(3)K inhibitor (Wortmannin) or MAPK inhibitor (PD98059) abolished the EGF‐induced alteration of p‐GSK‐3β, Snail, and Par3 (Figure 6A,B). Confocal immunofluorescence showed that LiCl treatment increased the levels of Snail protein in the nucleus of RT4 and 5637 cells, which was similar to the phenomenon that resulted from SNAI1 overexpression (Figure 6C). Furthermore, cytoplasmic and nuclear fractions were isolated and the lysates were subjected to Western blot. As shown in Figure 6D,E, activation of the Wnt pathway using LiCl or SNAI1 overexpression induced a substantial increase of Snail protein in total and in nucleus. These results confirm the regulating role of GSK‐3β in Snail expression and nuclear localization. Furthermore, LiCl significantly promoted cell migration and invasion, which could be abolished by SNAI1 knockdown or PARD3 overexpression (Figure 6F,G). These data indicate that abnormal inactivation of GSK‐3β induces the expression and nuclear localization of Snail, inhibits Par3 expression, and promotes the migration and invasion of BLCA cells.
FIGURE 6.

GSK‐3β phosphorylation promotes the expression and nuclear localization of Snail. A, GSK‐3β phosphorylation increases Snail protein but decreases Par3 protein. RT4 and 5637 cells were pretreated with wortmannin (0.1 mM), PD98059 (20 μM), or LiCl (30 mM) for 1 h, followed by stimulation with epidermal growth factor (EGF) (1 ng/mL) for 6 h. The protein levels of Snail and the activation of AKT, MAPK, and GSK‐3β were examined by Western blot. B, A model illustrating the regulating role of GSK‐3β in protein level and nuclear localization of Snail. EGF, an activator of the Akt and MAPK pathways, and LiCl, a GSK‐3β inhibitor, could suppress phosphorylated GSK‐3β (GSK‐3β) at Ser9 and induce strong accumulation of Snail in total and in the nucleus. Wortmannin (PI[3]K inhibitor) or PD98059 (MAPK inhibitor) could restore the suppression of GSK‐3β, which correlates with the downregulation of Snail. C‐E, LiCl treatment increases the protein level and promotes nuclear localization of Snail. RT4 and 5637 cells were treated with LiCl or SNAI1 overexpression. Immunofluorescence staining of Snail (green) and Par3 (red) was applied. Scale bar, 10 μm. C, Cytoplasmic and nuclear fractions were isolated and subjected to Western blot (D). Snail protein levels in the cytoplasmic and nuclear fractions were quantified and normalized against α‐tubulin or Lamin B, respectively (E). Values are mean ± SD. **P < .01, ***P < .001, ns, not significant, determined by Student's t‐test. F‐G, LiCl promotes cell migration and invasion, which could be blocked by SNAI1 knockdown or PARD3 overexpression. RT4 and 5637 cells were pretreated with LiCl (30 mM) for 1 h, followed by migration (F, left panel) and invasion (G, left panel) assays. Scale bar, 100 μm. Quantification of the relative migration (F, right panel) and invasion (G, right panel) was performed and is shown, respectively. Values are mean ± SD. *P < .05, **P < .01, Student's t‐test
3.7. Par3 (936‐1356 aa) interacts with ZO‐1 (1372‐1748 aa)
To investigate the biological mechanism involved in Par3‐mediated metastasis in BLCA, we performed gene set enrichment analysis (GSEA) analysis and found a highly positive correlation between Par3 expression and cell junction organization (Figure 7A,B). Liquid chromatography–tandem mass spectrometry (LC‐MS/MS) was employed and identified ZO‐1 (encoded by TJP1) as a potential interactor of Par3 (Figure 7C,D). Additionally, both TJP1 and PARD3 were involved in cell junction organization (Figure 7D). To confirm the interaction between Par3 and ZO‐1, cells were transfected with HA‐Par3 and Flag‐ZO‐1 for reciprocal coimmunoprecipitation assay. As shown in Figure 7E, anti‐HA or anti‐Flag antibody brought down ZO‐1 or Par3, respectively. Confocal immunofluorescence also showed the colocalization of Par3 and ZO‐1 in SV‐HUC‐1 (Figure 7F). We further determined the crucial region for the Par3 and ZO‐1 interaction. A series of HA‐tagged Par3 fragments were generated and cotransfected with Flag‐ZO‐1 into cells. Par3 is a large scaffold protein and contains a conserved N‐terminal domain, three PDZ domains, and a C‐terminal region including the aPKC‐binding motif and coiled‐coil domain. The following coprecipitation experiments detected the interaction between Par3 coiled‐coil domain (936‐1356 aa) and ZO‐1 (Figure 7G). ZO‐1 protein comprises three N‐terminal PDZ domains (PDZ1, PDZ2, PDZ3), a central region that contains SH3 and GUK domains, and a C‐terminal region including an actin‐binding region (ABR) and a ZU5 domain. 26 We also applied the reciprocal experiment for truncated fragments of ZO‐1 and determined the ZU5 domain (1372‐1748 aa) as sufficient fragment for the interaction with Par3 (Figure 7H).
FIGURE 7.

Par3 (936‐1356 aa) interacts with ZO‐1 (1372‐1748 aa). A, B, Par3 plays an important role in cell junction organization. Major biological processes modulated by Par3 in bladder cancer were predicted based on transcriptome analysis by gene ontology (A) and GSEA (B) analysis. NES, normalized enrichment score. Among the identified pathways, cell junction organization process showed a positive correlation with high the expression levels of PARD3 based on a dataset from TCGA database. C, Liquid chromatography–tandem mass spectrometry (LC‐MS/MS) analysis of Par3 binding proteins. Total cell lysates from SV‐HUC‐1 cells were immunoprecipitated with anti‐Par3 antibody or control IgG and visualized with Coomassie Blue staining. The indicated bands were cut for LC‐MS/MS analysis. D, PARD3 potentially interacts with TJP1. UpSet plot was used to visualize the total size and overlaps of various datasets, including genes analyzed by GSEA in cell junction organization (green), LC‐MS/MS experiment 1 (purple), LC‐MS/MS experiment 2 (orange), and LC‐MS/MS experiment 3 (blue). PARD3 and TJP1 were identified in three LC‐MS/MS experiments, as well as in genes involved in cell junction organization. E, Par3 interacts with ZO‐1. HA‐Par3 and Flag‐ZO‐1–expressing plasmids were transfected into 293T for 24 h. Reciprocal coimmunoprecipitation was performed by anti‐Flag (left panel) and anti‐HA (right panel). F, Par3 colocalizes with ZO‐1. Immunofluorescence showed colocalization of Par3 (red) and ZO‐1 (green) in SV‐HUC‐1 cells. Scale bar, 10 μm. G, 936‐1356 aa fragment of Par3 interacts with ZO‐1. Cells were cotransfected with Flag‐ZO‐1 and indicated HA‐tagged Par3 truncated plasmids. Cell lysates were subject to coimmunoprecipitation and Western blot. H, 1372‐1748 aa fragment of ZO‐1 interacts with Par3. Cells were cotransfected with HA‐Par3 and indicated Flag‐tagged Par3 truncated plasmids. Lysates were subject to coimmunoprecipitation and Western blot
3.8. The GSK‐3β‐Snail signaling axis regulates Par3 expression in BLCA
To further verify our in vitro model in tumor tissues, we determined the protein levels of p‐GSK‐3β, Snail, and Par3 in 39 pairs of human BLCA samples by multispectral immunofluorescence. Consistent with our findings in cells, the downregulation of Par3 significantly correlated with the upregulation of p‐GSK‐3β and Snail in BLCA tissues (Figure 8A,B). Moreover, our data showed that the level of ZO‐1 expression was significantly lower in tumor tissues than that in matched adjacent tissues (Figure 8A,B). Together, it implies a role of the GSK‐3β/Snail/Par3/ZO‐1 axis in regulating BLCA metastasis (Figure 8C).
FIGURE 8.

The GSK3β/Snail/Par3/ZO‐1 regulatory axis in bladder cancer (BLCA). A, Representative image of the microscopic immunofluorescence detection of Par3 (yellow), Snail (cyan), p‐GSK‐3β (S9) (red), and ZO‐1 (green) in BLCA patient paraffin section. DAPI colored in blue was a nuclear counterstain. Left scale bar, 200 μm; right scale bar, 50 μm. B, Matrix showing Spearman's correlation between Par3, Snail, p‐GSK‐3β (S9), and ZO‐1 for BLCA and adjacent tissues from 39 pairs of patients. The color and shape of the ellipses indicated the strength of the correlation. Only significant correlation coefficients were shown. Color bars indicated tissue type. C, A schematic model illustrating the GSK‐3β/Snail/Par3/ZO‐1 axis in metastatic BLCA. Inhibition of GSK‐3β by phosphorylation increases Snail protein levels and promotes the accumulation of Snail in the nucleus. As a transcriptional repressor, Snail in the nucleus binds to the promoter region of PARD3 and inhibits its transcription, leading to a reduced Par3 expression and enhanced metastatic capability of BLCA
4. DISCUSSION
We report here that (a) polarity protein Par3 is frequently lost in BLCA patients and is associated with muscle‐invasive phenotypes and poor prognosis; (b) Par3 deficiency is required for BLCA invasion and metastasis in vitro and in vivo; (c) Snail suppresses Par3 expression through its binding to PARD3 E2‐box; and (d) overexpression of Par3 abolishes LiCl‐ or Snail‐induced BLCA metastatic behaviors, suggesting a role of the GSK‐3β/Snail/Par3 axis in regulating BLCA metastasis.
The majority of human carcinomas show a loss of epithelial apical‐basal polarity during benign progression to invasive carcinoma. 17 The misregulation of polarity complexes, including PAR, Crumbs, and Scribble complexes, is closely related to tumor metastasis. 27 The role of Par3 in metastasis has been demonstrated in several tumor types, such as breast cancer, 15 skin cancer, 28 and lung squamous cell carcinomas. 29 In agreement with previous reports, 30 our current findings in BLCA suggest that loss of Par3 promotes carcinoma cell migration and invasion. Par3 confers epithelial tight junctions (TJ) in mammalian cells, 31 which might correlate with the inhibition of cell migration. TJ plays an essential role in the urothelium barrier, 13 which is composed of transmembrane proteins and cytoplasmic scaffolding proteins connecting the transmembrane proteins to the cytoskeleton, such as ZO‐1. ZO proteins have long been assumed to participate in TJ establishment and epithelial polarity maintenance by directly binding to claudins, and ZO‐1 is required for the formation of TJ. 32 Moreover, ZO‐1 might contribute to EMT, invasion, and metastasis of BLCA. 33 A mechanosensitive intramolecular interaction between a C‐terminal fragment of ZO‐1 resulted in the formation of the folded conformation, and ZO‐1 in this conformation cannot bind to its ligands ZONAB/DbpA and occludin, leading to downstream modulation of nuclear signaling and barrier function. 34 Here, we firstly provide evidence of the interaction between Par3 and ZU5 domain, a region of the C‐terminal fragment of ZO‐1. Although its function is not well understood, the ZU5 domain might have an important role in the dynamics of ZO‐1 and in barrier function. 35 An interaction between the ZO‐1 ZU5 domain and MRCKβ has been also determined, which is associated with MRCKβ‐mediated cell migration. 36 Therefore, we speculate that loss of Par3 likely disrupts TJ destruction of urothelium cells via its close relationship with ZO‐1, which leads to BLCA metastasis. This needs further investigations in the future.
Our present work reveals Par3 as a novel downstream target of Snail in the migration and invasion of BLCA. EMT is associated with an invasive or metastatic phenotype in BLCA. 37 It has been shown that a Snail‐mediated cascade could downregulate epithelial markers and upregulate mesenchymal markers to undergo an EMT and acquire metastatic potential. 17 In BLCA, overexpression of Snail has been reported to be involved in tumor progression, invasiveness, and metastasis. 38 One of the EMT hallmarks is the functional loss of E‐cadherin (encoded by CDH1), leading to the destabilization of adherens junctions, which is currently thought to be a suppressor of invasion during carcinoma progression. 22 Snail represses E‐cadherin transcription by directly binding to its promoter. We found the same E2‐box–type elements C/A(CAGGTG) as CDH1 in the proximal region of PARD3 promoter. On binding to the E‐box, Snail zinc finger transcription factor is thought to act as a transcriptional repressor. 21 Based on the finding that PARD3 genetic mutation and DNA methylation were not correlated with loss of protein expression, which is consistent with lung squamous cell carcinomas, 39 we demonstrate that Snail‐regulated PARD3 inhibition is the major regulating mechanism responsible for PARD3 expression in BLCA.
Generally, activation of Wnt signaling has been associated with cancer metastasis. A recent study showed that there was functional redundancy of GSK‐3β in Wnt/β‐catenin signaling. 40 GSK‐3β binds to and phosphorylates Snail (at motif 2), thereby inducing its nuclear export and binding to β‐Trcp, leading to the degradation of Snail. 41 Inhibition of GSK‐3β results in the upregulation of Snail, as well as the repression of E‐cadherin in vivo. 41 According to the present study, we speculate that the inhibition of GSK‐3β degrades both Par3 and E‐cadherin at transcriptional level by increasing the protein level of repressing transcriptional factor Snail, which induces BLCA migration and invasion in a coordinated fashion. This speculation is consistent with the fact that loss of Par3 and E‐cadherin promotes breast cancer metastasis by compromising cell‐cell cohesion. 30 Thus, it is conceivable that Snail represses Par3 expression and induces BLCA metastasis in a GSK‐3β phosphorylation–dependent manner.
In conclusion, the present work reports for the first time a loss of Par3 expression in BLCA with muscle‐invasive phenotypes and evidences a role of Par3 in suppressing the migration and invasion of BLCA cells. The GSK3β/Snail/Par3/ZO‐1 regulatory axis could play an important role in BLCA metastasis, which might provide new thoughts for BLCA treatment. While we found that endogenous Par3 protein was highly detected in urothelial cell SV‐HUC‐1 compared with BLCA cells, does Par3 play a role in oncogenesis of bladder epithelial cells? This needs further investigation.
DISCLOSURE
All authors declared that they had no conflict of interest.
Supporting information
Figure S1‐S6
Table S1‐S3
Supplementary Material
ACKNOWLEDGMENTS
This work was supported by the National Natural Science Foundation (81772615, 81972294, 81772968, 2072821, and 92059112), Shanghai Songjiang Municipal Science and Technology Commission Natural Science Foundation (20SJKJGG250), and Shanghai Specialized Research Fund for Integrated Chinese and Western Medicine in General Hospitals (ZHYY‐ZXYJHZX‐1‐201705).
Wang S, Cai J, Zhang S, et al. Loss of polarity protein Par3, via transcription factor Snail, promotes bladder cancer metastasis. Cancer Sci. 2021;112:2625–2641. 10.1111/cas.14920
Shenyi Wang and Jinming Cai contributed equally to this work
Contributor Information
Yingying Xu, Email: yingyingxu@fudan.edu.cn.
Bing Shen, Email: urodrshenbing@shsmu.edu.cn.
She Chen, Email: shechen@fudan.edu.cn.
REFERENCES
- 1. Bray F, Ferlay J, Soerjomataram I, Siegel RL, Torre LA, Jemal A. Global cancer statistics 2018: GLOBOCAN estimates of incidence and mortality worldwide for 36 cancers in 185 countries. CA Cancer J Clin. 2018;68:394‐424. [DOI] [PubMed] [Google Scholar]
- 2. Siegel RL, Miller KD, Jemal A. Cancer statistics, 2017. CA Cancer J Clin. 2017;67:7‐30. [DOI] [PubMed] [Google Scholar]
- 3. Lenis AT, Lec PM, Chamie K, Mshs MD. Bladder cancer: a review. JAMA. 2020;324:1980‐1991. [DOI] [PubMed] [Google Scholar]
- 4. Kamat AM, Hahn NM, Efstathiou JA, et al. Bladder cancer. Lancet. 2016;388:2796‐2810. [DOI] [PubMed] [Google Scholar]
- 5. Hurst C, Rosenberg J, Knowles M. SnapShot: bladder cancer. Cancer Cell. 2018;34:350.e1. [DOI] [PubMed] [Google Scholar]
- 6. Cheng JHH, Pak J, Shapiro E, et al. Allelic loss of p53 gene is associated with genesis and maintenance, but not invasion, of mouse carcinoma in situ of the bladder. Cancer Res. 2003;63:179‐185. [PubMed] [Google Scholar]
- 7. Han AL, Veeneman BA, El‐Sawy L, et al. Fibulin‐3 promotes muscle‐invasive bladder cancer. Oncogene. 2017;36:5243‐5251. [DOI] [PubMed] [Google Scholar]
- 8. Hoxhaj G, Manning BD. The PI3K‐AKT network at the interface of oncogenic signalling and cancer metabolism. Nat Rev Cancer. 2020;20:74‐88. [DOI] [PMC free article] [PubMed] [Google Scholar]
- 9. DA Kachrilas S, Papatsoris A, Avgeris S, et al. PI3K/AKT pathway genetic alterations and dysregulation of expression in bladder cancer. J BUON. 2019;24:329‐337. [PubMed] [Google Scholar]
- 10. Zhou Z, Liu X, Li Y, et al. TP53INP2 modulates epithelial‐to‐mesenchymal transition via the GSK‐3beta/beta‐Catenin/Snail1 pathway in bladder cancer cells. Onco Targets Ther. 2020;13:9587‐9597. [DOI] [PMC free article] [PubMed] [Google Scholar]
- 11. Riga A, Castiglioni VG, Boxem M. New insights into apical‐basal polarization in epithelia. Curr Opin Cell Biol. 2020;62:1‐8. [DOI] [PubMed] [Google Scholar]
- 12. Williams ED, Gao D, Redfern A, Thompson EW. Controversies around epithelial‐mesenchymal plasticity in cancer metastasis. Nat Rev Cancer. 2019;19:716‐732. [DOI] [PMC free article] [PubMed] [Google Scholar]
- 13. Haynes MDMT, Jenkins SA, Kynaston HG, Matthews PN, Jiang WG. Tight junctions and bladder cancer (review). Int J Mol Med. 2005;16:3‐9. [PubMed] [Google Scholar]
- 14. Liu Z, Yang Y, Gu A, et al. Par complex cluster formation mediated by phase separation. Nat Commun. 2020;11:2266. [DOI] [PMC free article] [PubMed] [Google Scholar]
- 15. McCaffrey LM, Montalbano J, Mihai C, Macara IG. Loss of the Par3 polarity protein promotes breast tumorigenesis and metastasis. Cancer Cell. 2012;22:601‐614. [DOI] [PMC free article] [PubMed] [Google Scholar]
- 16. Guyer RA, Macara IG. Loss of the polarity protein PAR3 activates STAT3 signaling via an atypical protein kinase C (aPKC)/NF‐kappaB/interleukin‐6 (IL‐6) axis in mouse mammary cells. J Biol Chem. 2015;290:8457‐8468. [DOI] [PMC free article] [PubMed] [Google Scholar]
- 17. Jung HY, Fattet L, Tsai JH, et al. Apical‐basal polarity inhibits epithelial‐mesenchymal transition and tumour metastasis by PAR‐complex‐mediated SNAI1 degradation. Nat Cell Biol. 2019;21:359‐371. [DOI] [PMC free article] [PubMed] [Google Scholar]
- 18. Cano AP‐MM, Rodrigo I, Locascio A, et al. The transcription factor Snail controls epithelial–mesenchymal transitions by repressing E‐cadherin expression. Nat Cell Biol. 2000;2:76‐83. [DOI] [PubMed] [Google Scholar]
- 19. Kosaka T, Kikuchi E, Mikami S, et al. Expression of Snail in upper urinary tract urothelial carcinoma: prognostic significance and implications for tumor invasion. Clin Cancer Res. 2010;16:5814‐5823. [DOI] [PubMed] [Google Scholar]
- 20. Keck B, Wach S, Goebell PJ, et al. SNAI1 protein expression is an independent negative prognosticator in muscle‐invasive bladder cancer. Ann Surg Oncol. 2013;20:3669‐3674. [DOI] [PubMed] [Google Scholar]
- 21. Nieto MA. The snail superfamily of zinc‐finger transcription factors. Nat Rev Mol Cell Biol. 2002;3:155‐166. [DOI] [PubMed] [Google Scholar]
- 22. Peinado H, Olmeda D, Cano A. Snail, Zeb and bHLH factors in tumour progression: an alliance against the epithelial phenotype? Nat Rev Cancer. 2007;7:415‐428. [DOI] [PubMed] [Google Scholar]
- 23. Mancinelli R, Carpino G, Petrungaro S, et al. Multifaceted roles of GSK‐3 in cancer and autophagy‐related diseases. Oxid Med Cell Longev. 2017;2017:e4629495. [DOI] [PMC free article] [PubMed] [Google Scholar]
- 24. Ahmad I, Morton JP, Singh LB, et al. beta‐Catenin activation synergizes with PTEN loss to cause bladder cancer formation. Oncogene. 2011;30:178‐189. [DOI] [PMC free article] [PubMed] [Google Scholar]
- 25. Zuiverloon TCM, de Jong FC, Costello JC, Theodorescu D. Systematic review: characteristics and preclinical uses of bladder cancer cell lines. Bladder Cancer. 2018;4:169‐183. [DOI] [PMC free article] [PubMed] [Google Scholar]
- 26. Fanning ASMT, Anderson JM. Isolation and functional characterization of the actin binding region in the tight junction protein ZO‐1. FASEB J. 2002;16:1835‐1837. [DOI] [PubMed] [Google Scholar]
- 27. Fomicheva M, Tross EM, Macara IG. Polarity proteins in oncogenesis. Curr Opin Cell Biol. 2020;62:26‐30. [DOI] [PMC free article] [PubMed] [Google Scholar]
- 28. Mescher M, Jeong P, Knapp SK, et al. The epidermal polarity protein Par3 is a non‐cell autonomous suppressor of malignant melanoma. J Exp Med. 2017;214:339‐358. [DOI] [PMC free article] [PubMed] [Google Scholar]
- 29. Iden S, van Riel WE, Schafer R, et al. Tumor type‐dependent function of the par3 polarity protein in skin tumorigenesis. Cancer Cell. 2012;22:389‐403. [DOI] [PubMed] [Google Scholar]
- 30. Xue B, Krishnamurthy K, Allred DC, Muthuswamy SK. Loss of Par3 promotes breast cancer metastasis by compromising cell‐cell cohesion. Nat Cell Biol. 2013;15:189‐200. [DOI] [PMC free article] [PubMed] [Google Scholar]
- 31. Ahmed SM, Macara IG. The Par3 polarity protein is an exocyst receptor essential for mammary cell survival. Nat Commun. 2017;8:e14867. [DOI] [PMC free article] [PubMed] [Google Scholar]
- 32. Zihni C, Mills C, Matter K, Balda MS. Tight junctions: from simple barriers to multifunctional molecular gates. Nat Rev Mol Cell Biol. 2016;17:564‐580. [DOI] [PubMed] [Google Scholar]
- 33. Islam SS, Mokhtari RB, Noman AS, et al. Sonic hedgehog (Shh) signaling promotes tumorigenicity and stemness via activation of epithelial‐to‐mesenchymal transition (EMT) in bladder cancer. Mol Carcinog. 2016;55:537‐551. [DOI] [PubMed] [Google Scholar]
- 34. Spadaro D, Le S, Laroche T, et al. Tension‐dependent stretching activates ZO‐1 to control the junctional localization of its interactors. Curr Biol. 2017;27(24):3783‐3795.e8. [DOI] [PubMed] [Google Scholar]
- 35. King JM, Tan CJP, Thomason NC, White AR, Shen L, Turner JR. Zonula occludens‐1 ZU5 domain contributes essential stabilizing interactions at the tight junction. FASEB J. 2016;30:1250. [Google Scholar]
- 36. Huo L, Wen W, Wang R, et al. Cdc42‐dependent formation of the ZO‐1/MRCKbeta complex at the leading edge controls cell migration. EMBO J. 2011;30:665‐678. [DOI] [PMC free article] [PubMed] [Google Scholar]
- 37. McConkey DJ, Choi W, Marquis L, et al. Role of epithelial‐to‐mesenchymal transition (EMT) in drug sensitivity and metastasis in bladder cancer. Cancer Metastasis Rev. 2009;28:335‐344. [DOI] [PMC free article] [PubMed] [Google Scholar]
- 38. Nadal R, Bellmunt J. Management of metastatic bladder cancer. Cancer Treat Rev. 2019;76:10‐21. [DOI] [PubMed] [Google Scholar]
- 39. Bonastre E, Verdura S, Zondervan I, et al. PARD3 inactivation in lung squamous cell carcinomas impairs STAT3 and promotes malignant invasion. Cancer Res. 2015;75:1287‐1297. [DOI] [PMC free article] [PubMed] [Google Scholar]
- 40. Doble BW, Patel S, Wood GA, Kockeritz LK, Woodgett JR. Functional redundancy of GSK‐3alpha and GSK‐3beta in Wnt/beta‐catenin signaling shown by using an allelic series of embryonic stem cell lines. Dev Cell. 2007;12:957‐971. [DOI] [PMC free article] [PubMed] [Google Scholar]
- 41. Zhou BP, Deng J, Xia W, et al. Dual regulation of Snail by GSK‐3beta‐mediated phosphorylation in control of epithelial‐mesenchymal transition. Nat Cell Biol. 2004;6:931‐940. [DOI] [PubMed] [Google Scholar]
Associated Data
This section collects any data citations, data availability statements, or supplementary materials included in this article.
Supplementary Materials
Figure S1‐S6
Table S1‐S3
Supplementary Material