Abstract
Objective
To compare how structural MRI, fluorodeoxyglucose (FDG), and flortaucipir (FTP) PET signals predict cognitive decline in high-amyloid vs low-amyloid participants with the goal of determining which biomarker combination would result in the highest increase of statistical power for prevention trials.
Methods
In this prospective cohort study, we analyzed data from clinically normal adults from the Harvard Aging Brain Study with MRI, FDG, FTP, and Pittsburgh compound B (PiB)-PET acquired within a year and prospective cognitive evaluations over a mean 3-year follow-up. We focused analyses on predefined regions of interest: inferior temporal, isthmus cingulate, hippocampus, and entorhinal cortex. Cognition was assessed with the Preclinical Alzheimer's Cognitive Composite. We evaluated the association between biomarkers and cognitive decline using linear mixed-effect models with random intercepts and slopes, adjusting for demographics. We generated power curves simulating prevention trials.
Results
Data from 131 participants (52 women, age 73.98 ± 8.29 years) were analyzed in the study. In separate models, most biomarkers had a closer association with cognitive decline in the high-PiB compared to the low-PiB participants. A backward stepwise regression including all biomarkers demonstrated that only neocortical PiB, entorhinal FTP, and entorhinal FDG were independent predictors of subsequent cognitive decline. Power analyses revealed that using both high PiB and low entorhinal FDG as inclusion criteria reduced 3-fold the number of participants needed in a hypothetical trial compared to using only high PiB.
Discussion
In preclinical Alzheimer disease, entorhinal hypometabolism is a strong and independent predictor of subsequent cognitive decline, making FDG a potentially useful biomarker to increase power in clinical trials.
Classification of Evidence
This study provides Class II evidence that in people with preclinical Alzheimer disease, entorhinal hypometabolism identified by FDG-PET is predictive of subsequent cognitive decline.
Alzheimer disease (AD) is a neurodegenerative disorder characterized clinically by progressive cognitive decline and pathologically by the deposition of brain β-amyloid (Aβ) plaques and tau neurofibrillary tangles.1 Mounting evidence suggests that AD pathology starts accumulating before cognitive symptoms are evident, defining a preclinical stage.2,3 PET studies investigating Aβ have shown that clinically normal (CN) older individuals with elevated Aβ are more likely to perform worse over time on cognitive tests than those with lower Aβ.4-6 However, not all CN individuals with high Aβ burden experience cognitive decline. Several surrogate markers have been suggested to characterize preclinical AD-related cognitive decline, including structural MRI,7 fluorodeoxyglucose (FDG) PET,8 and more recently flortaucipir (FTP) tau-PET imaging.9 These biomarkers have been shown to predict cognitive decline in high-Aβ CN but also appear to be highly colinear with each other.10 Besides, these biomarkers may also reveal clues about non-AD pathologies mimicking AD symptoms or suggest the presence of non-AD copathologies that are currently difficult to measure in vivo but may influence the suitability of certain individuals to participate in specific anti-AD therapeutic trials. Expanding on previous work,9,11 the purpose of this study was to compare whether FTP, FDG, and structural MRI in previously identified preclinical AD regions provided independent contributions to predicting cognitive decline in a sample of CN adults characterized by their Aβ burden. We specifically aimed to evaluate which biomarker combinations would be most useful in deciding which participants to include in prevention trials.
Methods
Participants
The Harvard Aging Brain Study (HABS) is a longitudinal aging study that included 283 participants who were cognitively normal at enrollment with a Global Clinical Dementia Rating score of 0. Exclusion criteria included a history of drug or alcohol abuse, head trauma, and serious medical or psychiatric conditions (Geriatric Depression Scale score >10 of 30). We selected HABS participants from the entire cohort who had baseline structural MRI (116.0 ± 96.5 days from FTP PET), FDG (109.7 ± 88.2 days), FTP (aka AV1451 or T807), and Pittsburgh compound B (PiB; 84.4 ± 83.1 days) -PET collected within a year of one another, which were used to evaluate regional thickness and volume, glucose metabolism, tau, and Aβ pathology, respectively. In addition, the participants analyzed in this report underwent at least 2 annual neuropsychological testing battery assessments that were used to measure prospective cognitive performance over a mean of 3.0 years (minimum 0.8 year, maximum 5.1 years). Participants did not miss any annual assessments, although follow-up length varied from one participant to another.
Standard Protocol Approvals, Registrations, and Patient Consents
The use of human participants in HABS has been approved by the Partners Human Research Committee, and all participants provided written informed consent.
Neuropsychological Evaluation
Prospective cognitive decline was determined by annual assessments of the Preclinical Alzheimer's Cognitive Composite (PACC5). The PACC5 integrates 5 neuropsychological tests that are known to be sensitive to cognitive decline in individuals with preclinical AD.12 The composite includes the z-scored means of the Mini-Mental State Examination, Logical Memory Delayed Recall, Digit-Symbol Coding Test, Free and Cued Selective Reminding Test (included free and total recall), and category fluency, computed at study entry.
Brain Imaging
Three-dimensional structural T1-weighted MRI scans were acquired with a Siemens 3T Tim Trio (Siemens, Erlangen, Germany). T1 images were segmented and parcellated with FreeSurfer software (version 6.0) to identify regions of interest (ROIs). Cortical thickness measures were obtained for the ROIs, as well as hippocampal volume (HV).8 In addition, all participants underwent PET imaging with C11-PiB, F18-FTP, and F18-FDG. All 3 radiotracers were synthesized at Massachusetts General Hospital (Boston, MA) and administered onsite, with the images acquired with a Siemens HR+ scanner. All PET procedures were performed following previously published protocols.13 PiB values were computed as distribution volume ratios with the Logan graphical method. Analyses used a FreeSurfer-defined neocortical aggregate ROI comprising regions from the frontal, lateral temporal, and retrosplenial cortices such as the superior frontal, rostral middle frontal, rostral anterior cingulate, medial orbitofrontal, inferior and middle temporal, inferior parietal, and precuneus. Gaussian mixture models performed in previous studies4,11 were used to separate the sample into low-PiB and high-PiB subgroups, with a threshold for PiB positivity at a distribution volume ratio value of 1.30. FDG and FTP measures were calculated as standard uptake value ratios (SUVr; scaled on cerebellar gray). Entorhinal cortex (EC), isthmus cingulate (IC), inferior temporal (IT), and hippocampus FreeSurfer-defined ROIs were used for analyses.11 Hippocampus FTP values were also residualized for mean choroid plexus signal because of previous reports of adjacent off-target binding in the choroid plexus.14 Geometric transfer matrix–based partial volume–corrected PET values were used,15 but all analyses were replicated in noncorrected data with similar findings.
Statistics
Means and SDs were computed for the entire sample and each PiB subgroup to show descriptive statistics, and t tests compared the low- and high-PiB groups. PACC5 scores were predicted using linear mixed-models with random intercept for each participant and a random slope for time in the entire sample, as well as separately in the low- and high-PiB groups. Cross-sectional PET and structural MRI measures were used as predictors of PACC5 decline, covarying for age, sex, and years of education. Each predictor and covariate were entered both as a main effect and in interaction with time. For plotting our results, we extracted the individual slopes of PACC5 by summing the estimated fixed and random effects of time. Further adjusting for APOE ε4 carrier status did not affect findings. We used backward stepwise regressions with all predictors to evaluate the most significant predictors of cognitive decline measured with PACC5 scores with a liberal threshold (2-tailed p < 0.10) in all participants and in PiB subgroups, generating estimates and 95% confidence intervals (CIs). Furthermore, we assessed how well the addition of FDG and FTP measures to inclusion criteria already high PiB in frontal, lateral temporal, and retrosplenial cortices would affect the number of participants a hypothetical AD-preventive clinical trial would need to enroll to detect a slowing of cognitive decline of 30% (2 arms over 4-year duration with annual assessments; 90% power; α = 0.05). These results were done using previously validated power analyses for mixed models.4,16 A 5,000-trial bootstrapping procedure provided 95% CIs around the number of participants. Statistics were computed with R (version 3.3.3, R Foundation for Statistical Computing, Vienna, Austria). We reported 2-tailed p values. This article reports analyses for 13 biomarkers, and we provided all results both without correction and with a Bonferroni correction of corrected p ≤ 0.004 (uncorrected p ≤ 0.05). The analyses in this study provide Class II evidence.
Data Availability
Data for the present study were collected as part of National Institute on Aging–NIH P01AG036694, Impact of Amyloid and Tau on the Aging Brain: The Harvard Aging Brain Study (HABS). At of the time of submission, the raw neuroimaging data used were not available to nonstudy staff. At a future point in time, all data used in this report will be made publicly available to the research community (pending approval of a data request and agreement to abide by the HABS data use agreement). Additional information regarding data/code sharing can be found at nmr.mgh.harvard.edu/lab/harvardagingbrain/data and nmr.mgh.harvard.edu/research/software. Any unanswered questions about the data can be emailed to habsdata@mgh.harvard.edu.
Results
Characteristics of the Participants
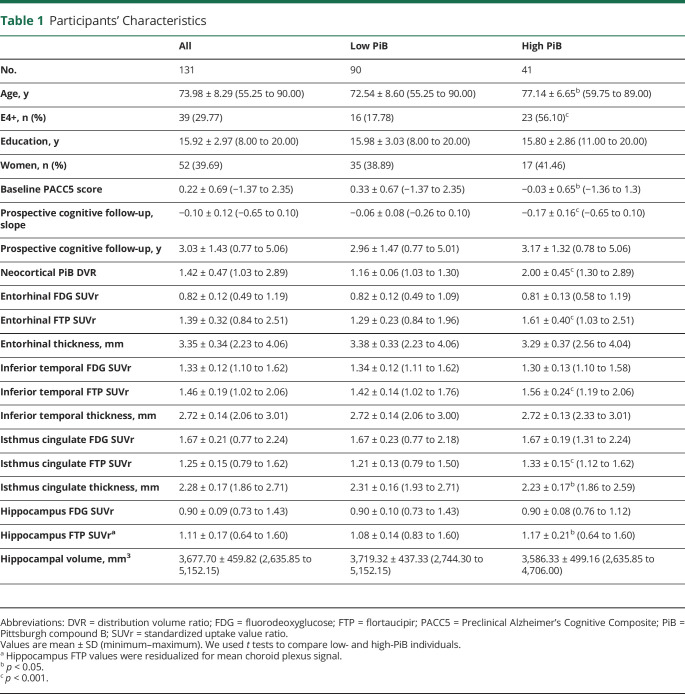
One hundred thirty-one participants had all the biomarkers needed for the study and 2 prospective neuropsychological assessments. Descriptive statistics for these participants are shown in table 1. Ninety participants demonstrated low levels of PiB, while 41 (31.3%) demonstrated high levels of PiB. Individuals with high PiB were older and had a higher percentage of APOE ε4 carriers than those with low PiB. In addition, high-PiB individuals exhibited lower PACC5 scores at baseline (t = 2.93, p ≤ 0.004) and faster cognitive decline (t = 4.14, p ≤ 0.001) compared to low-PiB individuals. With regard to the PET measures, high-PiB participants had greater EC, IT, IC, and hippocampus FTP levels (t = 2.49, p = 0.02 for hippocampus, which is nonsignificant after Bonferroni correction; t ≥ 3.55, p < 0.001 for all other PET values), but their FDG levels were not significantly different from those of the low-PiB participants. IC was thinner in high-PiB individuals (t = 2.69, p = 0.02, nonsignificant after Bonferroni correction), but there were no other differences in MRI measures between high-PiB and low-PiB participants.
Table 1.
Participants' Characteristics
PET Data Predict Prospective Cognitive Decline
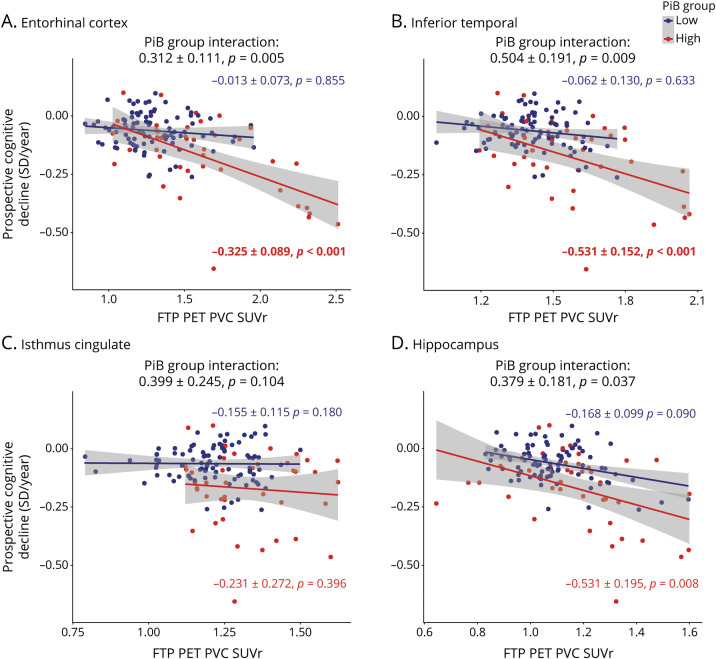
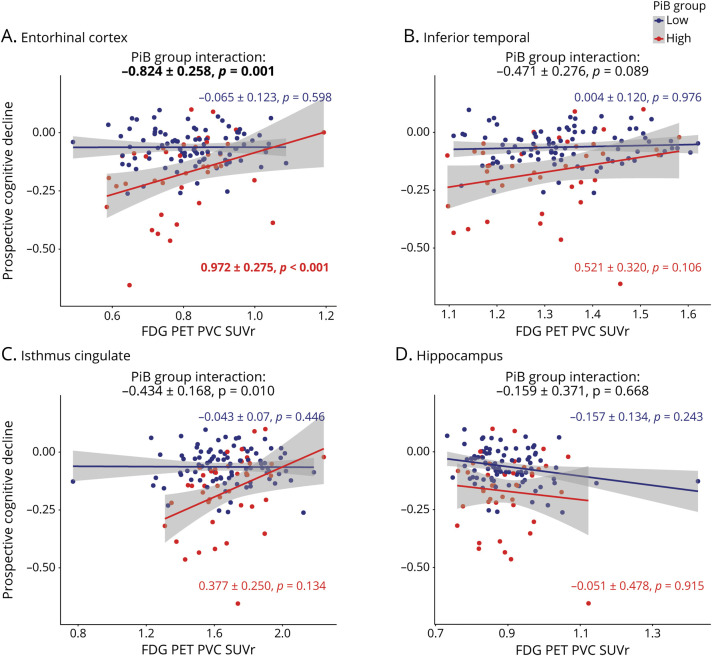
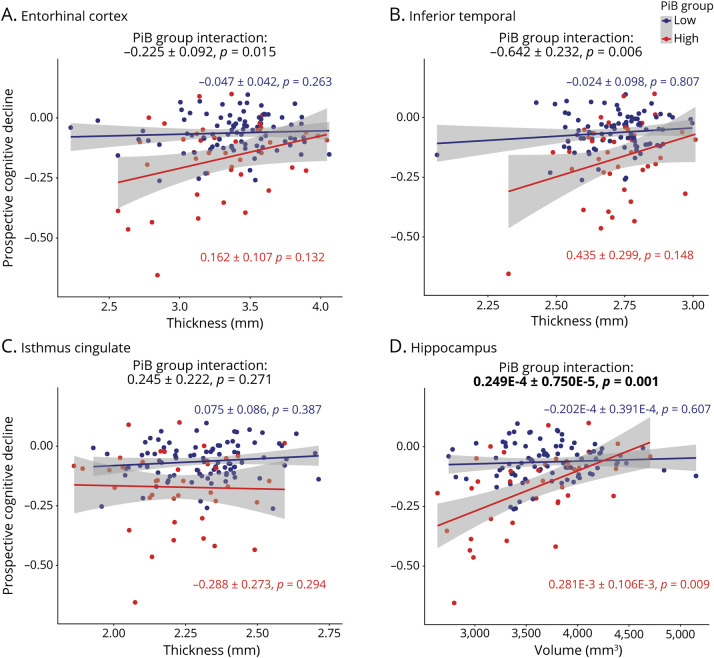
In separate linear mixed-models, FTP, FDG, and MRI measures were not associated with change in cognitive decline in the low-PiB sample. In high-PiB individuals, regional EC, IT, and hippocampal FTP predicted cognitive decline (figure 1), and in separate models, there was a significant interaction between PiB group and EC, IT, and hippocampal FTP in predicting cognitive decline. Of these analyses, only EC and IT FTP predicting cognitive decline survived the Bonferroni-corrected p value. Besides FTP biomarkers, EC FDG (figure 2) and HV (figure 3) were the only 2 biomarkers significantly associated with cognitive decline in the high-PiB sample. However, we observed significant interactions between PiB group and EC and IC FDG in predicting cognitive decline (figure 2). In terms of MRI measures (figure 3), EC and IT thickness and HV each had significant interactions with PiB group, demonstrating that these biomarkers had closer associations with cognitive decline in the high-PiB compared to the low-PiB participants. Of these other measures, only EC FDG significantly predicted cognitive decline when the Bonferroni correction was applied, while the interaction between PiB group and both EC FDG and HV, in separate models, also survived the correction. The results were similar when APOE ε4 carrier status was interacted with time and added to the model similarly to other demographic variables. Adjusting for baseline PACC5 performances while predicting PACC5 decline from year 2 also provided similar results.
Figure 1. Regional FTP PET Measures Are Predictive of Cognitive Decline in High-PiB Individuals.
Prospective cognitive decline (Preclinical Alzheimer's Cognitive Composite performance expressed in SD per year) was predicted using flortaucipir (FTP) PET biomarkers in linear mixed-effects models with a random intercept and slope per participant. Analyses were split between the low–Pittsburgh compound B (PiB) group (blue) and high-PiB group (red). Biomarkers included FTP PET partial volume-corrected (PVC) standard uptake value ratio (SUVr) values in the (A) entorhinal cortex, (B) inferior temporal, (C) isthmus cingulate, and (D) hippocampus. Interactions between PiB group and FTP PET biomarkers are included on the top of each graph. Models were adjusted for age, sex, and education. A Bonferroni-corrected p value was applied (13 biomarkers, p < 0.0038), and model outputs that survived the correction are in bold.
Figure 2. Regional FDG PET Measures Are Predictive of Cognitive Decline in High-PiB Individuals.
Prospective cognitive decline (Preclinical Alzheimer's Cognitive Composite performance expressed in SD per year) was predicted using fluorodeoxyglucose (FDG) PET biomarkers in linear mixed-effects models with a random intercept and slope per participant. Analyses were split between the low–Pittsburgh compound B (PiB) group (blue) and high-PiB group (red). Biomarkers included FDG PET partial volume–corrected (PVC) standard uptake value ratio (SUVr) values in the (A) entorhinal cortex, (B) inferior temporal, (C) isthmus cingulate, and (D) hippocampus. Interactions between PiB group and FDG PET biomarkers are included on the top of each graph. Models were adjusted for age, sex, and education. A Bonferroni-corrected p value was applied (13 biomarkers, p < 0.0038), and model outputs that survived the correction are in bold.
Figure 3. Regional MRI Measures Are Predictive of Cognitive Decline in High-PiB Individuals.
Prospective cognitive decline (Preclinical Alzheimer's Cognitive Composite performance expressed in SD per year) was predicted using various MRI biomarkers in linear mixed-effects models with a random intercept and slope per participant. Analyses were split between the low–Pittsburgh compound B (PiB) group (blue) and high-PiB group (red). MRI biomarkers used to predict cognitive decline were thickness measures in millimeters in the (A) entorhinal cortex, (B) inferior temporal, and (C) isthmus cingulate, as well as (D) hippocampal volume (cubic millimeters). Interactions between PiB group and MRI biomarkers are included on the top of each graph. Models were adjusted for age, sex, and education. A Bonferroni-corrected p value was applied (13 biomarkers, p < 0.0038), and model outputs that survived the correction are in bolded.
Using Multiple Predictors to Assess Which Biomarkers Predict Cognitive Decline
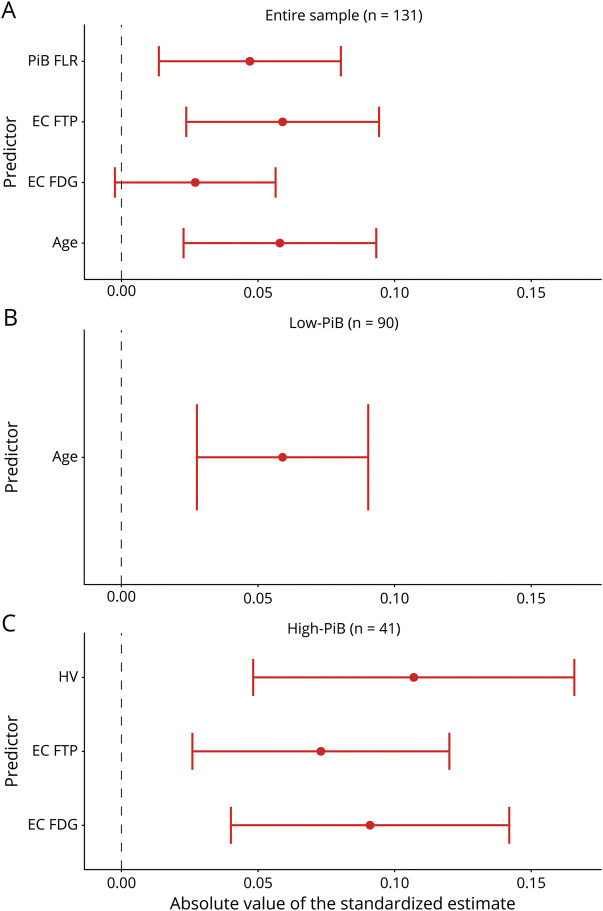
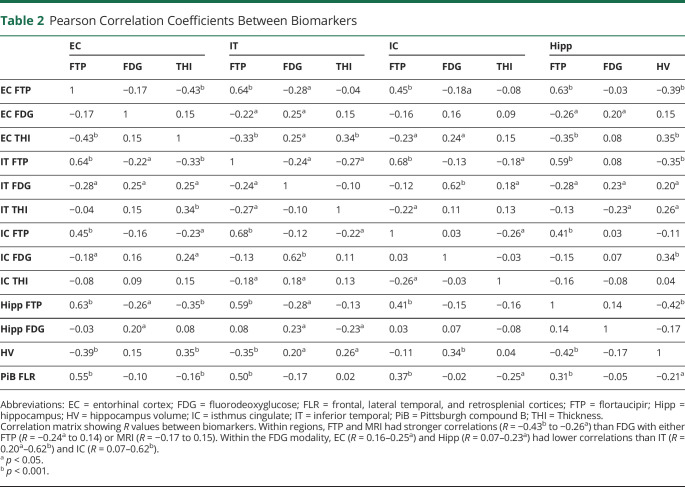
To evaluate which biomarkers independently predicted cognitive decline, we performed backward stepwise regressions in which age, sex, education, neocortical PiB, and all FTP, FDG, and MRI ROIs were evaluated, both for the entire sample and for each PiB group separately (figure 4). For interpreting these results, we also provided a correlation table, showing the association between the different PET and MRI biomarkers (table 2). In the entire sample, neocortical PiB (−0.047 ± 0.033, p = 0.005; standardized β ±standard error, p value), EC FTP (−0.060 ± 0.035, p < 0.001), EC FDG (0.025 ± 0.029, p = 0.097, nonsignificant after Bonferroni correction), and age (−0.059 ± 0.035, p = 0.001) were independently predictive of subsequent cognitive decline. Age was the only significant predictor in the low-PiB sample (−0.060 ± 0.031, p < 0.001). In high-PiB individuals, HV (0.107 ± 0.060, p < 0.001), EC FTP (−0.073 ± 0.047, p = 0.003), and EC FDG (0.091 ± 0.052, p < 0.001) independently predicted prospective cognitive decline. The other predictors were excluded from the final backward regressions because of lack of significance (liberal threshold of p > 0.10), after adjustment for the abovementioned predictors.
Figure 4. Entorhinal FDG Predicts Subsequent Cognitive Decline Independently of PiB and FTP.
Backward stepwise regressions identified the strongest predictors of subsequent cognitive decline in the (A) entire sample, (B) low–Pittsburgh compound B (PiB) subgroup, and (C) high-PiB subgroup. We used a liberal threshold in this test (2-tailed p ≤ 0.10) and removed nonsignificant predictors from the model. (A) PiB frontal, lateral temporal, and retrosplenial cortices (FLR), entorhinal cortex (EC) flortaucipir (FTP), EC fluorodeoxyglucose (FDG), and age were independently predictive of cognitive decline in the entire sample. (B) Age was the only predictor of cognitive decline in the low-PiB group. (C) EC FDG, EC FTP, and hippocampus volume (HV) were independently predictive in the high-PiB group. Although PiB and FTP estimates are negative, they are presented in the positive range to facilitate the comparison with FDG and HV.
Table 2.
Pearson Correlation Coefficients Between Biomarkers
Utility in Preclinical AD Clinical Trials
Because EC FDG captured variance in cognitive decline that was independent of PiB and FTP, we hypothesized that it may help determine the risk of subsequent cognitive decline in clinical trial participants, above and beyond what could be achieved with PiB and FTP biomarkers. Indeed, cognitive decline in CN is slow; therefore, determining which individuals are most at risk of decline in the next few years is critically important for the success of preventive trials. We thus used our high-PiB sample (n = 41) to estimate the number of participants needed for a clinical trial to detect a slowing of cognitive decline of 30%. A median split classified high-PiB individuals as high or low on the FTP and EC FDG measures. Using high EC FTP (in addition to high-PiB) as inclusion criterion (FTP-SUVr threshold 1.52) reduced the required sample size 2-fold, while using low EC FDG (FDG-SUVr threshold 0.81) reduced the required sample size 3-fold (figure 5). To detect a 30% slope reduction in PACC5, a trial would need 285 high-PiB (95% CI 118–1,195), 139 high-PiB high-FTP (95% CI 48–434), or 94 high-PiB low-FDG (95% CI 41–193) participants in each arm. Using either low EC FDG or high EC FTP resulted in an equal number of screening failures because a median split was used for both measures. Similar results were observed when either EC or IT FTP was used, but the FDG finding was observed in EC only. As was expected from the stepwise regression in the entire sample, adding HV to this model did not further decrease the number of participants needed compared with the model including PiB, FTP, and FDG.
Figure 5. Higher Statistical Power With Entorhinal FDG than With FTP.
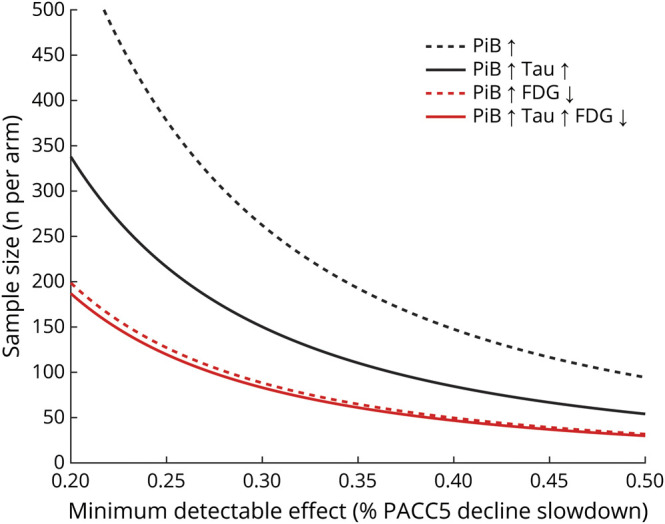
The number of high–Pittsburgh compound B (PiB) clinically normal individuals per arm (y-axis) that are needed for detecting a given slope reduction on the Preclinical Alzheimer Cognitive Composite (PACC5; x-axis) with a 90% power and α = 0.05 in a 4-year trial with annual assessments, using Pittsburgh compound B (PiB) alone (black dotted line), PiB and entorhinal cortex (EC) flortaucipir (FTP) (black plain line), PiB and EC fluorodeoxyglucose (FDG) (red dotted line), or PiB, EC FTP, and EC FDG (red plain line) as inclusion criteria. For this analysis, FDG (standard uptake value ratio [SUVr] threshold 0.81) and FTP (SUVr threshold 1.52) signals were dichotomized using a median split in the high-PiB group.
Discussion
We sought to evaluate the ability of regional FTP-PET, FDG-PET, and structural MRI to predict subsequent cognitive decline in a sample of CN older individuals with variable levels of neocortical Aβ. Our findings suggest that EC tau, EC metabolism, and HV are independently associated with prospective cognitive decline in CN adults with high Aβ burden. In contrast, IT and IC measures were not independently associated with cognitive decline. These results highlight the added contributions of medial temporal lobe (MTL) tau pathology and MTL structure and function to predict AD-related cognitive decline and possibly to reduce the sample size requirements for clinical trials.
PACC5 was designed to be a sensitive cognitive measure linked to Aβ-related changes.12 As previously demonstrated in HABS and other cohort studies,5-7,17 individuals with elevated Aβ were at an increased risk for PACC5 decline compared to those with lower levels of Aβ. In addition, the high-Aβ sample had elevated tau, and tau measures were associated with faster cognitive decline in these individuals.9 In contrast, the high-Aβ sample did not have low metabolism on average, but low FDG values were predictive of subsequent cognitive decline. Our findings showing greater tau but similar metabolism in the high-Aβ sample compared to the low-Aβ sample suggest that initial Aβ pathology is followed by tau deposition and then by a decrease in metabolism that occurs closer to cognitive impairment.8 Longitudinal PET studies using PiB, FTP, and FDG radiotracers are required to further disentangle the temporal trajectories of these biomarkers,18 but our cross-sectional observations suggest that tau precedes hypometabolism in the EC.
Remarkably, the association of cognitive decline with cortical thickness and metabolism in most brain regions disappeared after adjustment for FTP measures, possibly suggesting that cortical thinning and hypometabolism in these regions were tau mediated.19,20 However, EC metabolism (and HV when looking at high-Aβ individuals only) showed an FTP-independent association with cognitive decline, making this a biomarker of interest for identifying normal older adults at risk of subsequent cognitive decline and enrolling them in clinical trials. Although it is likely not as specific for AD pathology, the EC FDG biomarker provided additional power compared to FTP in a hypothetical clinical trial, reducing the requested sample size 3-fold.
The unique association between EC metabolism and cognitive decline, which was not explained by the PiB and FTP measures, may reflect AD-related cognitive decline and originate in the close temporal proximity of hypometabolism and cognitive impairment. It is also possible that EC metabolism captures non–AD-related variance in cognitive decline. A previous study reported MTL hypometabolism in patients with an AD-type amnestic dementia phenotype but autopsy-proven hippocampal sclerosis, a condition due to TAR DNA-binding protein 43 (TDP-43) that is observed almost exclusively in older individuals.21 Our results might indicate that the hypometabolism seen in the EC, a region commonly associated with early tauopathy in preclinical AD, is not caused solely by or associated with amyloid and tau pathology but could also be due to other non-AD pathologies. This interpretation of the results is of particular relevance for clinical research in that anti-AD therapeutic trials should aim to include participants who will experience cognitive decline that is related to AD pathology, not to other pathologies. To explore the contribution of non-AD pathologies to low EC hypometabolism, future analyses should focus on the association between FDG signal and cognitive decline in large cohorts of individuals with low levels of AD-related pathology. In individuals with high levels of Aβ, hypometabolism is more likely due to AD pathology, although, because mixed pathologies are frequent in older individuals,21 we cannot exclude that non-AD pathologies also contributed to the association of EC FDG and subsequent cognitive decline in our high-Aβ sample. The presence of hypometabolism largely exceeding tau-PET signal in high-Aβ individuals suggests the possibility of non-AD copathology, which, depending on the trial design, may justify excluding participants, although they are at risk of subsequent cognitive decline. Although our results demonstrated that a combination of Aβ-PET and FDG-PET performed very well to predict subsequent cognitive decline, we would not recommend using FDG instead of tau-PET because FDG-PET is not specific for any neuropathology.
Overall, our results indicate that FDG captures information that is relevant to cognition and can reflect a measure of downstream-related AD and non-AD processes that are not currently measurable in vivo. In combination with Aβ and tau-PET, FDG would allow enriched clinical trials in individuals with AD pathology and high risk of fast cognitive decline and minimize the possibility of coexisting pathologies.
This study has limitations. First, the HABS sample is highly educated and particularly healthy, potentially limiting our ability to observe a high rate of progression to cognitive impairment and dementia.22 The respective associations of PiB, FTP, and FDG with cognitive decline should be evaluated in additional more representative samples, especially because the findings could vary according to the sample. Replicating these results with a greater sample size is also important because one of the limitations of our study was the small number of individuals with high-PiB (n = 41). With a larger sample size, we would also be able to dichotomize participants by FTP and FDG signal using other methods beyond a median split, further setting up these analyses to be replicated in other samples. Second, while using 3 radiotracers to select individuals in clinical trials may allow the inclusion of those most at risk of decline in the next few years, this will be at the cost of a high rate of screen failures. The present study suggests that FDG-PET may be as effective as FTP-PET for this purpose, but cost-benefit studies for specific clinical trials need to be conducted. Also depending on the trial design, some may consider using FDG-PET to exclude individuals with brain dysfunction and focus on preventing Aβ or tau pathology at a very early stage. Overall, because this study was done to compare the use of FDG to FTP-PET in hypothetical trial inclusion criteria, these considerations and enrollment size will vary depending on the drug being tested and the variability of response to this drug. Third, while previous work had established that the ROIs we selected were associated with cognitive decline, we may have observed different results if we had included additional ROIs. Future work will include voxel-wise analyses that were not performed here, ideally in larger samples allowing correction for multiple comparisons. Fourth, FTP is a first-generation tau-PET tracer with known off-target bindings on neuromelanin14 and possibly on TDP-43, which may complicate the interpretation of the results, particularly in the MTL where both tau and TDP-43 pathologies frequently co-occur. Finally, while the lower predictive power of hippocampal FTP-PET is likely due to the known off-target binding from choroid plexus,14 we do not have any explanation as to why hippocampal FDG was not particularly associated with cognitive decline in this study. We previously showed that hippocampal FDG was lower in patients with mild cognitive impairment due to AD8 and in high-Aβ older individuals with subjective memory complaints.23 It is possible that EC hypometabolism precedes hippocampal hypometabolism,24 but longitudinal studies of regional FDG-PET in older adults are needed to address this issue.
Entorhinal hypometabolism is associated with subsequent cognitive decline in preclinical AD, above and beyond the association with amyloid and tau pathology. Adding low entorhinal FDG as an inclusion criterion in preclinical AD trials would significantly increase the power of the trials.
Glossary
- Aβ
β-amyloid
- AD
Alzheimer disease
- CI
confidence interval
- CN
clinically normal
- EC
entorhinal cortex
- FDG
fluorodeoxyglucose
- FTP
flortaucipir
- HABS
Harvard Aging Brain Study
- HV
hippocampal volume
- IC
isthmus cingulate
- IT
inferior temporal
- MTL
medial temporal lobe
- PACC5
Preclinical Alzheimer's Cognitive Composite
- PiB
Pittsburgh compound B
- ROI
region of interest
- SUVr
standard uptake value ratio
- TDP-43
TAR DNA-binding protein 43
Appendix. Authors

Footnotes
Class of Evidence: NPub.org/coe
Study Funding
Study funded by NIH grants P01AG036694 (R.A. Sperling and K.A. Johnson), R01 AG046396 (K.A. Johnson), R01AG061811 (J. Sepulcre), and R01AG061445 (J. Sepulcre); the Belgian Fund for Scientific Research (FNRS No. SPD 28094292; B.J. Hanseeuw); and the Belgian Foundation for Alzheimer Research (SAO-FRA No. P16.008, B.J. Hanseeuw). H.I.L. Jacobs received funding from the European Union's Horizon 2020 Research and Innovation Programme under the Marie Sklodowska-Curie Grant agreement (IF-2015-GF, 706714) and NIH–National Institute on Aging grant R01AG062559. P. Vannini is supported by K01 awards by the National Institute on Aging. K.V. Papp received NIH support through grant 5K23AG053422-03.
Disclosure
D.V. Mayblyum, J.A. Becker, H.I.L. Jacobs, R.F. Buckley, A.P. Schultz, J. Sepulcre, J.S. Sanchez, Z.B. Rubinstein, S.R. Katz, K.A. Moody, P. Vannini, and K.V. Papp report no disclosures relevant to the manuscript. D.M. Rentz reports support from Eli Lilly, Neurotrack, and Biogen outside the submitted work. J.C. Price reports no disclosures relevant to the manuscript. R.A. Sperling reports funding from Janssen and personal fees from AC Immune, Biogen, and Roche outside the submitted work. K.A. Johnson reports personal fees from Biogen, Lilly/Avid, Merck, Novartis, Takeda, Roche/Genentech, and Janssen, as well as grants from the Alzheimer's Association, Alzheimer's Drug Discovery Foundation, and NIH. B.J. Hanseeuw reports grants from the Belgian National Fund for Scientific Research and the Belgian Foundation for Alzheimer Research during the conduct of the study. Go to Neurology.org/N for full disclosures.
References
- 1.Hyman BT, Phelps CH, Beach TG, et al. . National Institute on Aging-Alzheimer's Association guidelines for the neuropathologic assessment of Alzheimer's disease. Alzheimers Dement. 2012;8(1):1-13. [DOI] [PMC free article] [PubMed] [Google Scholar]
- 2.Mintun MA, Larossa GN, Sheline YI, et al. . [11C]PIB in a nondemented population: potential antecedent marker of Alzheimer disease. Neurology. 2006;67(3):446-452. [DOI] [PubMed] [Google Scholar]
- 3.Price JL, McKeel DW, Buckles VD, et al. . Neuropathology of nondemented aging: presumptive evidence for preclinical Alzheimer disease. Neurobiol Aging. 2009;30(7):1026-1036. [DOI] [PMC free article] [PubMed] [Google Scholar]
- 4.Hanseeuw BJ, Betensky RA, Mormino EC, et al. . PET staging of amyloidosis using striatum. Alzheimers Dement. 2018;14(10):1281-1292. [DOI] [PMC free article] [PubMed] [Google Scholar]
- 5.Donohue MC, Sperling RA, Peterson R, Sun CK, Weiner MW, Aisen PS. Association between elevated brain amyloid and subsequent cognitive decline among cognitively normal persons. JAMA. 2017;317(22):2305-2316. [DOI] [PMC free article] [PubMed] [Google Scholar]
- 6.Lim YY, Maruff P, Pietrzak RH, et al. . Abeta and cognitive change: examining the preclinical and prodromal stages of Alzheimer's disease. Alzheimers Dement. 2014;10(6):743-751 e1. [DOI] [PubMed] [Google Scholar]
- 7.Knopman DS, Lundt ES, Therneau TM, et al. . Joint associations of beta-amyloidosis and cortical thickness with cognition. Neurobiol Aging. 2018;65:121-131. [DOI] [PMC free article] [PubMed] [Google Scholar]
- 8.Hanseeuw BJ, Schultz AP, Betensky RA, Sperling RA, Johnson KA. Hippocampal metabolism is decreased in high-amyloid mild cognitive impairment. Alzheimers Dement. 2016;12(12):1288-1296. [DOI] [PMC free article] [PubMed] [Google Scholar]
- 9.Sperling RA, Mormino EC, Schultz AP, et al. . The impact of amyloid-β and tau on longitudinal cognitive decline in older individuals. Ann Neurol. 2019;85(2):181-193. [DOI] [PMC free article] [PubMed] [Google Scholar]
- 10.Ossenkoppele R, Schonhaut DR, Schöll M, et al. . Tau PET patterns mirror clinical and neuroanatomical variability in Alzheimer's disease. Brain. 2016;139(pt 5):1551-1567. [DOI] [PMC free article] [PubMed] [Google Scholar]
- 11.Hanseeuw BJ, Betensky RA, Schultz AP, et al. . Fluorodeoxyglucose metabolism associated with tau-amyloid interaction predicts memory decline. Ann Neurol. 2017;81(4):583-596. [DOI] [PMC free article] [PubMed] [Google Scholar]
- 12.Papp KV, Rentz DM, Orlovsky I, Sperling RA, Mormino EC. Optimizing the preclinical Alzheimer's cognitive composite with semantic processing: the PACC5. Alzheimers Dement. 2017;3(4):668-677. [DOI] [PMC free article] [PubMed] [Google Scholar]
- 13.Johnson KA, Schultz A, Betensky RA, et al. . Tau positron emission tomographic imaging in aging and early Alzheimer disease. Ann Neurol. 2016;79(1):110-119. [DOI] [PMC free article] [PubMed] [Google Scholar]
- 14.Lee CM, Jacobs HIL, Marquié M, et al. . 18F-Flortaucipir binding in choroid plexus: related to race and Hippocampus signal. J Alzheimers Dis. 2018;62(4):1691-1702. [DOI] [PMC free article] [PubMed] [Google Scholar]
- 15.Greve DN, Salat DH, Bowen SL, et al. . Different partial volume correction methods lead to different conclusions: an F-FDG-PET study of aging. Neuroimage. 2016;132:334-343. [DOI] [PMC free article] [PubMed] [Google Scholar]
- 16.Ard MC, Edland SD. Power calculations for clinical trials in Alzheimer's disease. J Alzheimers Dis. 2011;26(s3):369-377. [DOI] [PMC free article] [PubMed] [Google Scholar]
- 17.Mormino EC, Papp KV, Rentz DM, et al. . Early and late change on the preclinical Alzheimer's cognitive composite in clinically normal older individuals with elevated amyloid beta. Alzheimers Dement. 2017;13(9):1004-1012. [DOI] [PMC free article] [PubMed] [Google Scholar]
- 18.Hanseeuw BJ, Betensky RA, Jacobs HIL, et al. . Association of amyloid and tau with cognition in preclinical Alzheimer disease: a longitudinal study. JAMA Neurol. 2019;76(8):915-924. [DOI] [PMC free article] [PubMed] [Google Scholar]
- 19.LaPoint MR, Chhatwal JP, Sepulcre J, Johnson KA, Sperling RA, Schultz AP. The association between tau PET and retrospective cortical thinning in clinically normal elderly. Neuroimage. 2017;157:612-622. [DOI] [PMC free article] [PubMed] [Google Scholar]
- 20.Harrison TM, La Joie R, Maass A, et al. . Longitudinal tau accumulation and atrophy in aging and Alzheimer disease. Ann Neurol. 2019;85(2):229-240. [DOI] [PMC free article] [PubMed] [Google Scholar]
- 21.Botha H, Mantyh WG, Murray ME, et al. . FDG-PET in tau-negative amnestic dementia resembles that of autopsy-proven hippocampal sclerosis. Brain. 2018;141(4):1201-1217. [DOI] [PMC free article] [PubMed] [Google Scholar]
- 22.Rentz DM, Mormino EC, Papp KV, Betensky RA, Sperling RA, Johnson KA. Cognitive resilience in clinical and preclinical Alzheimer's disease: the association of amyloid and tau burden on cognitive performance. Brain Imaging Behav. 2017;11(2):383-390. [DOI] [PMC free article] [PubMed] [Google Scholar]
- 23.Vannini P, Hanseeuw B, Munro CE, et al. . Hippocampal hypometabolism in older adults with memory complaints and increased amyloid burden. Neurology. 2017;88(18):1759-1767. [DOI] [PMC free article] [PubMed] [Google Scholar]
- 24.Mosconi L, Mistur R, Switalski R, et al. . FDG-PET changes in brain glucose metabolism from normal cognition to pathologically verified Alzheimer's disease. Eur J Nucl Med Mol Imaging. 2009;36(5):811-822. [DOI] [PMC free article] [PubMed] [Google Scholar]
Associated Data
This section collects any data citations, data availability statements, or supplementary materials included in this article.
Data Availability Statement
Data for the present study were collected as part of National Institute on Aging–NIH P01AG036694, Impact of Amyloid and Tau on the Aging Brain: The Harvard Aging Brain Study (HABS). At of the time of submission, the raw neuroimaging data used were not available to nonstudy staff. At a future point in time, all data used in this report will be made publicly available to the research community (pending approval of a data request and agreement to abide by the HABS data use agreement). Additional information regarding data/code sharing can be found at nmr.mgh.harvard.edu/lab/harvardagingbrain/data and nmr.mgh.harvard.edu/research/software. Any unanswered questions about the data can be emailed to habsdata@mgh.harvard.edu.


