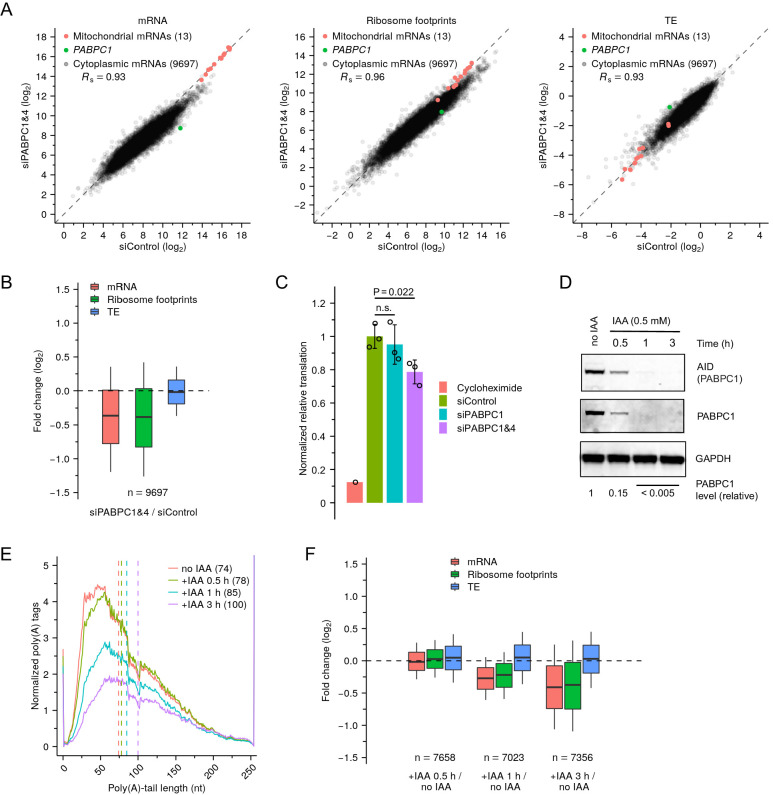
Figure 6. Depletion of PABPC in mammalian cell lines has minimal effect on TE.
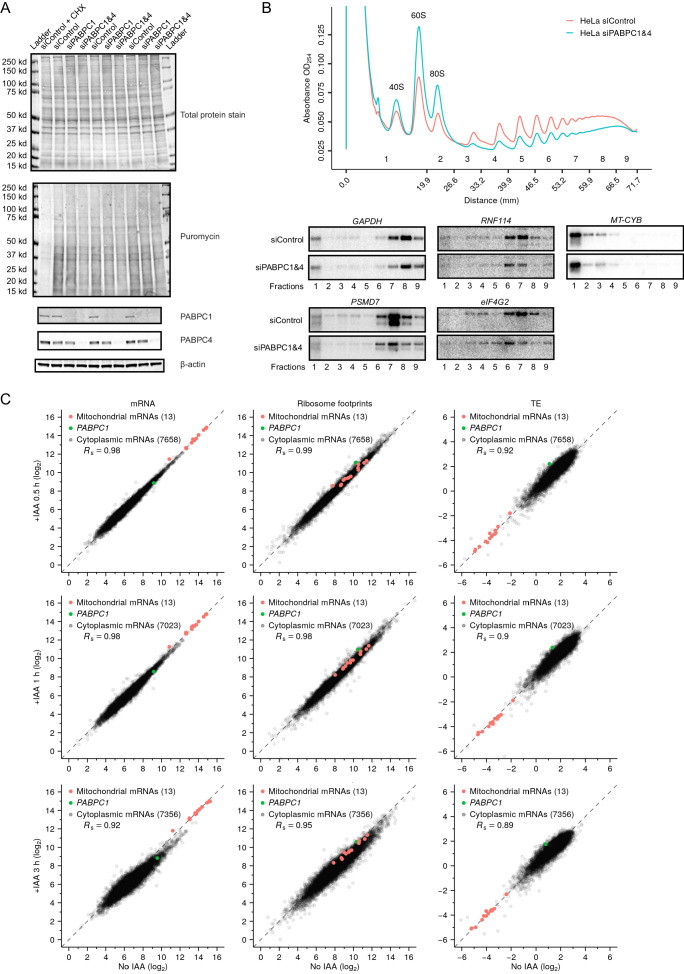
(A) Effect of PABPC knockdown on mRNA abundance (left), ribosome-footprint abundance (middle) and TE (right) in HeLa cells, comparing values in double-knockdown cells to those in control cells. For each gene, values for mRNA and ribosome-footprint reads per kilobase are plotted after normalizing to measurements for mitochondrial mRNAs. (B) Distributions of the effects of PABPC double knockdown on mRNA abundance, ribosome-footprint abundance and TE. Each box-whisker shows the 10th, 25th, 50th, 75th, and 90th percentile of the fold changes observed in (A). (C) Effect of PABPC knockdown on protein synthesis in HeLa cells. Plotted are relative levels of protein synthesis measured by pulse puromycin incorporation 48 hr after transfection with the indicated siRNAs (Figure 6—figure supplement 1A; error bars, standard deviation of three biological replicates; p values, one-sided t-tests; n.s., not significant). (D) Western blot showing rapid degradation of PABPC1-AID fusion protein after adding IAA to genome-engineered HCT116 cells. PABPC1 protein levels were quantified by averaging signals for AID and PABPC1, after normalizing to that for GAPDH. (E) Effect of PABPC1 depletion on abundance of mRNAs with different tail lengths. Shown are tail-length distributions of all poly(A) tags obtained from cytoplasmic mRNAs of HCT116 PABPC1-AID cells after treatment with IAA for the indicated time. For each distribution, the abundance of tags was normalized to that of the spike-in tail-length standards. Median values are indicated (dashed lines) and listed in parentheses. Due to depletion of 101-nt tail lengths, which was associated with a change in laser intensity at the next sequencing cycle, the values at this length were replaced with the average of values at tail lengths 100 and 102 nt. (F) Summary of the effects of rapid PABPC1 depletion. For each gene, at each time point after adding IAA to HCT116 PABPC1-AID cells, values for mRNA abundance, ribosome-footprint abundance and TE were each compared to the value observed in cells not treated with IAA (Figure 6—figure supplement 1C), and the distribution of fold changes is plotted. Each box-whisker shows the 10th, 25th, 50th, 75th, and 90th percentile. Tail-length measurements were obtained using PAL-seq v4.


