Abstract
Background:
RNA binding proteins (RBPs) play essential roles in the regulation of RNA metabolism. Recent studies have disclosed that RBPs achieve their functions via binding to their targets in a position-dependent pattern on RNAs. However, few studies have systematically addressed the associations between the RBP’s functions and their positional binding preferences.
Methods:
Here, we present large-scale analyses on the functional targets of human RBPs by integrating the enhanced cross-linking and immunoprecipitation followed by sequencing (eCLIP-seq) datasets and the shRNA knockdown followed by RNA-seq datasets that are deposited in the integrated ENCyclopedia of DNA Elements in the human genome (ENCODE) data portal.
Results:
We found that (1) binding to the translation termination site and the 3′untranslated region is important to most human RBPs in the RNA decay regulation; (2) RBPs’ binding and regulation follow a cell-type specific pattern.
Conclusions:
These analysis results show the strong relationship between the binding position and the functions of RBPs, which provides novel insights into the RBPs’ regulation mechanisms.
Keywords: RNA binding protein, CLIP-seq, RNA-seq, knockdown, RNA regulation
Author summary:
RBPs are essential to the post-transcriptional processes, which include RNA stabilization, degradation, alternative splicing, localization, etc. To achieve these functions, RBPs bind to their target RNAs in a position-dependent manner. By applying a recently developed computational tool to a large number of human RBPs, we discover the important relationships between the binding in the 3′ untranslated region and the regulation of RNA abundance. In addition, we report the cell-type specific binding and regulation of RBPs. This systematical study sheds light on the mechanisms of RBPs in regulating RNA metabolism.
INTRODUCTION
RNA-binding proteins (RBPs) play important roles in the post-transcriptional regulation of RNAs [1]. For example, RBP Nova regulates alternative splicing and poly(A) site usage [2]. It is essential to study these regulatory roles of RBPs because the abnormal expression of RBP-encoding genes is associated with human diseases [3–6]. Recently, cross-linking and immunoprecipitation followed by sequencing (CLIP-seq) have been widely used to study RNA-protein interaction at high resolution [2,7–10].
Correspondingly, a large number of computational approaches have been developed for analyzing CLIP-seq data [11–20], which can be classified into two major categories. The first class of computational tools are designed to detect RBP binding peaks or differential binding between two conditions [12,15,16,21]. The second category of computational tools are developed to identify the RBPs’ functional targets based on the binding peaks [22–24]. These computational tools help elucidate not only the biological functions of RBPs but also the underlying mechanisms.
Even though recent studies tried to dissect the functional roles of hundreds of human RBPs by associating their binding features with different functional assays, few studies have systematically examined the relationship between the position-dependent binding of RBPs and their functions. The availability of a large-scale collection of eCLIP data in the integrated ENCyclopedia of DNA Elements in the human genome (ENCODE) makes it possible to systematically analyze the association between RBPs’ positional binding features and their functional roles.
In this paper, we study the position-dependent functional bindings of RBPs by applying a new approach named Protein-RNA Association Strength (PRAS) [22] to the eCLIP data of RNA decay regulators in K562 and HepG2 cells. We demonstrate that the translation termination site on the transcript is essential for RBP binding to achieve their RNA decay related functions. By comparing the RBP functional targets in the two aforementioned cell types, we report the cell type-specific RBP regulation. These analyses results shed light on the study of the mechanisms of RBPs’ functions.
RESULTS
Binding to the translation termination site is important to most human RBPs in the RNA decay regulation
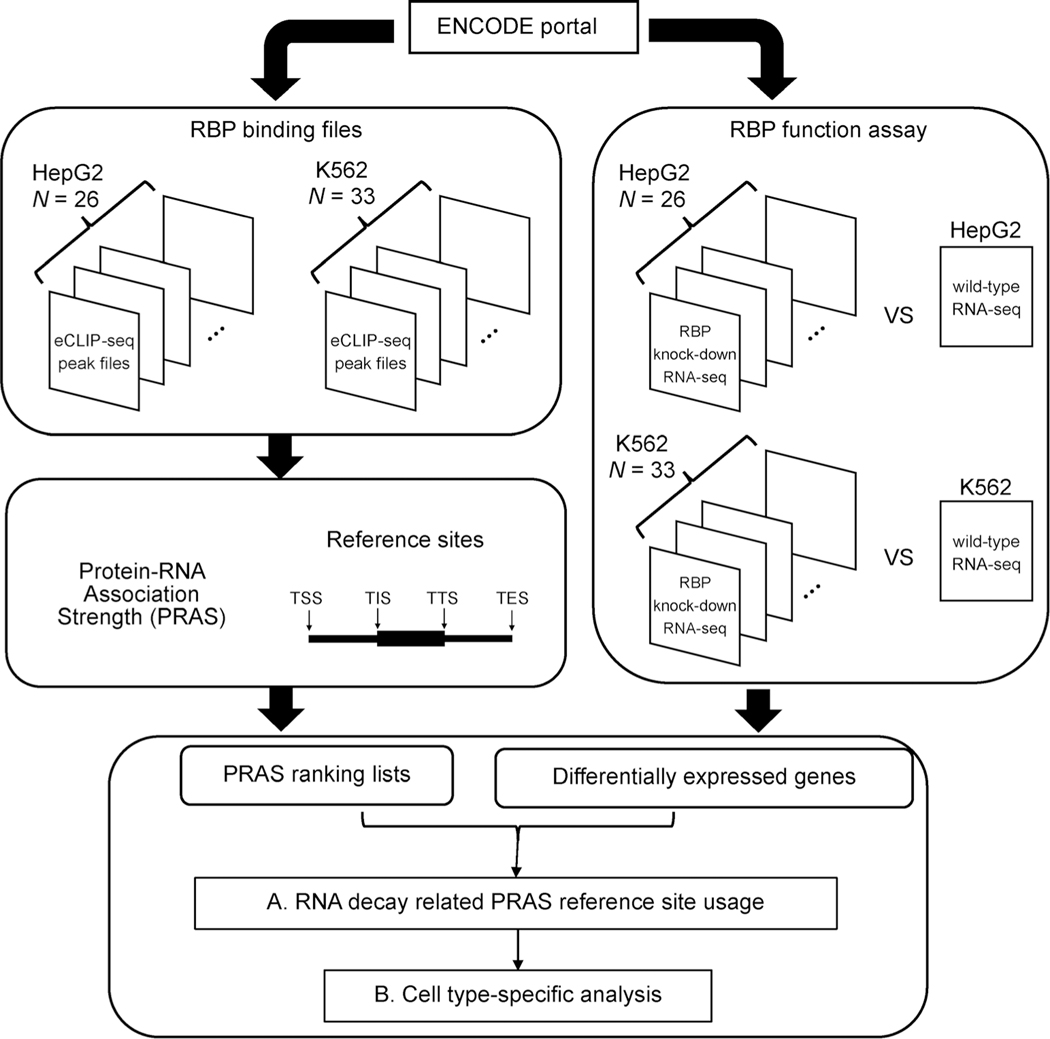
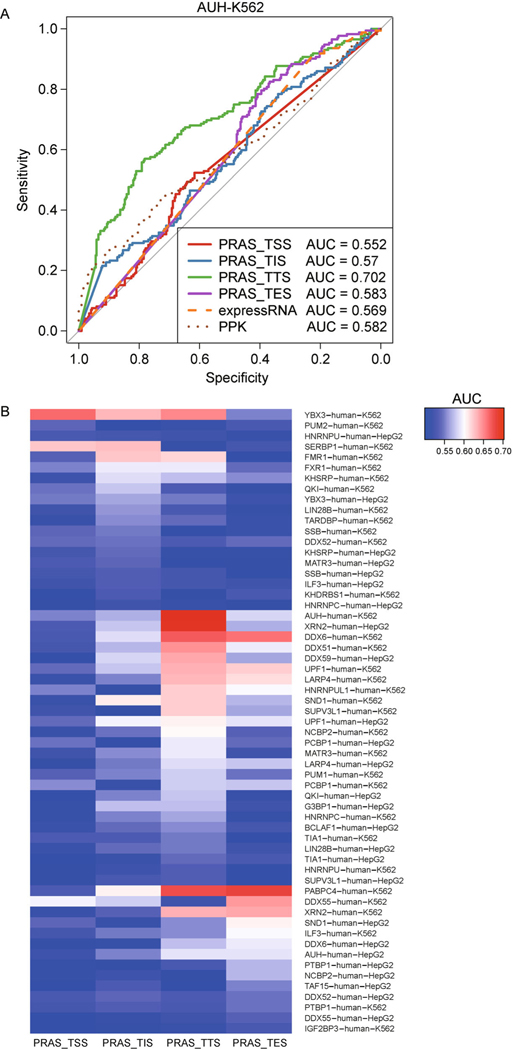
We first aimed to study the role of the binding positions of RBPs in achieving their biological functions. Recently, a computational method named PRAS was developed for predicting functional targets of RBPs, which integrates the intensities and positions of the binding peaks of RBPs in the prediction. PRAS requires a reference site on a transcript as input, which is regarded as the most important binding site for the RBP regulation and should be chosen from four candidates: transcription start site (TSS), translation initiation site (TIS), translation termination site (TTS), and transcription end site (TES). By comparing the performance of the four reference sites in PRAS, we were able to evaluate the importance of the reference sites for the RBP to achieve its function. The study design, data structure and analysis procedures are summarized in Fig. 1. Specifically, we analyzed the eCLIP data [25] in two human cell types, K562 and HepG2, from the ENCODE Consortium. Following the similar procedure as in our previous study [22], we applied PRAS to the RBPs that are related to the RNA decay function [26]. To quantify the RBP’s function in RNA decay, we collected the differential expression (DE) analysis results by DESeq [27] between the wild-type and RBP knockdown (KD) conditions from ENCODE for the corresponding RBPs in the two aforementioned cell types. We extracted the DE genes (adjusted p-value<= 0.05) and their log fold change (LFC) of the expression values in the RBP KD condition over wild-type. The genes with positive or negative LFCs were regarded as degraded and stabilized targets of the corresponding RBP, respectively. We then applied PRAS to the eCLIP data of these target genes using the four reference site candidates, respectively. After obtaining the PRAS scores, we did the ROC analysis between the RBP-stabilized and RBP-degraded genes for each RBP. To set a comparison with other existing methods, we included the performance of the two other methods mentioned in our previous study [22]: peak per kilobase (PPK) in Wang et al. [24], which calculated the score as the number of significant CLIP peaks per kilobase; and the expressRNA procedure of Rot et al. [23], which summed the number of reads in CLIP peaks within 200 nt upstream and downstream flanking the polyadenylation sites. We noted the PRAS with TSS, TIS, TTS and TES as the reference site as PRAS-TSS, PRAS-TIS, PRAS-TTS, and PRAS-TES, respectively. For each RBP, we assessed the performance of the methods by calculating the area under the curve (AUC) of the ROC curves. For example, PRAS-TTS obtained the highest AUC (0.702) among the compared methods in differentiating the stabilized and degraded targets of AU RNA binding methylglutaconyl-CoA hydratase (AUH) (Fig. 2A), a human RBP that is related to the mRNA decay via binding to the AU-rich elements (AREs). We found that the performance of PRAS on the prediction of AUH regulated targets varies a lot with different reference sites (Fig. 2A), among which PRAS-TSS (AUC = 0.552) and PRAS-TIS (AUC = 0.57) have much worse performance than PRAS-TTS. These results not only indicate that PRAS can capture the functional targets with the appropriate reference site but also suggest the translation termination site is important for the function of AUH in regulating RNA decay.
Figure 1. Diagram of the study design, data structure and analysis.
Figure 2. RNA decay regulators achieve functions by using different reference sites.
(A) The ROC analysis of mRNA targets for the RBP AUH in K562 cells. (B) The heatmap of the AUC values of the ROC analyses for the mRNA decay related RBPs.
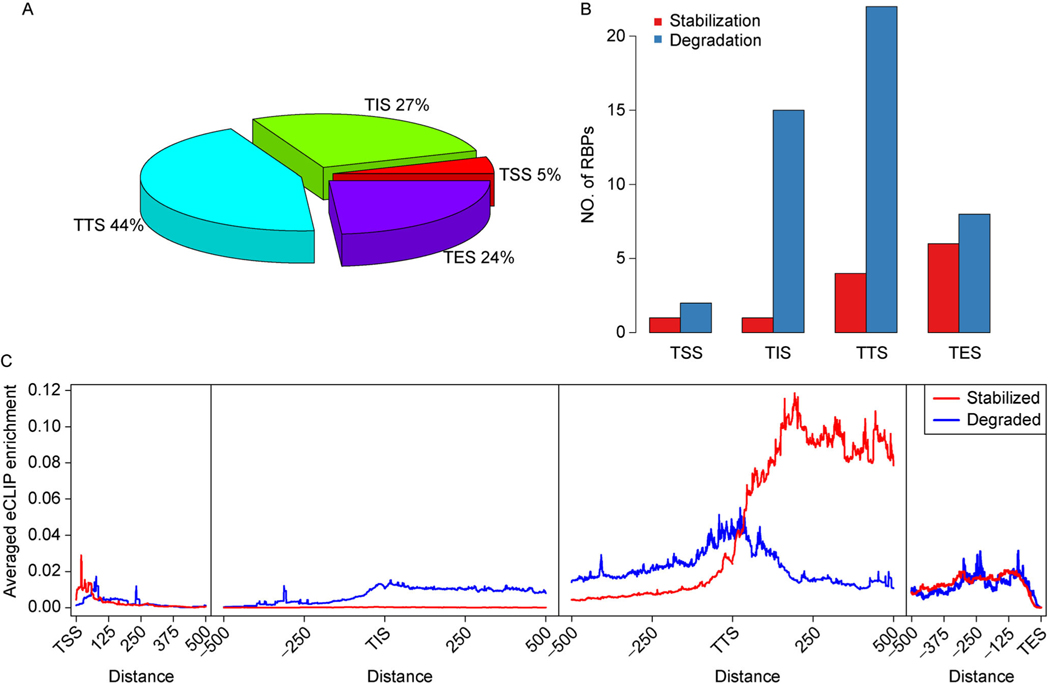
By applying the similar analysis to other known RNA decay regulators, we found PRAS-TTS scores achieved significantly higher AUC compared to PRAS-TSS, PRAS-TIS, and PRAS-TES, with the Wilcoxon signed-rank test’s p-value equal to 7.5e–7, 3.8e–3, and 1.1e–3, respectively. However, the largest value of AUC was not always achieved by using TTS as the reference site (Fig. 2B), which suggests that the RBPs achieved their functions by using different reference sites. By assigning the reference site with the largest AUC value among the PRAS scores to each RBP, we found nearly half of the RBPs (44%) belongs to the class with TTS as the reference site (Fig. 3A). In addition, we examined the reference site usages for the stabilization and degradation functions of RBPs. Following the procedure of Wagnon et al. [28], we further separated the RBPs to two groups: RBPs with stronger change in expression for the stabilized targets than degraded targets are regarded as “stabilization” group, and RBPs with stronger change in expression for the degraded targets than stabilized ones are regarded as the “degradation” group. By comparing the reference site usage in these two groups, we found that the “stabilization” group prefer TES and TTS as the reference site, while the “degradation” group prefer TTS and TIS (Fig. 3B). On one hand, the common usage of the TTS indicates that this position is important to most human RBPs in the RNA decay regulation. On the other hand, the difference between the “stabilization” and “degradation” group of RBPs in their choice of reference site indicates the two directions of regulation is associated with different positions on the transcript. To further investigate the binding around the reference sites for the two regulation groups, we performed the meta-gene analysis on the eCLIP data of the RBPs. We calculated the eCLIP enrichment as as suggested by Van Nostrand et al. [26], where ri is the IP read count and ci is the input read count from the eCLIP experiments [26]. In this way, a positive and a negative peak intensity represents the enriched and the depleted eCLIP signal compared to the input experiment, respectively. We found that both the “stabilization” and “degradation” RBPs have an enrichment of binding close to the TTS compared to the other reference sites (Fig. 3C). However, the “degradation” RBPs achieve the strongest binding at the TTS while the “stabilization” RBPs’ binding peak is around 200 nt downstream to the TTS. Even though RBPs in the “stabilization” group prefer TES as the reference site, the binding intensities around TES is not comparable to those around TTS. In addition, the binding intensities of the “degradation” RBPs around TIS is much lower than those around TTS, regardless of the fact that TIS is the second choice as the reference site for “degradation” RBPs. All these results suggest that the TTS is essential for RBP’s binding to regulate the RNA fate.
Figure 3. The translation termination site is important for the regulations of RNA decay related RBPs.
(A) Pie chart of the selected reference sites in the ROC analyses for the mRNA decay related RBP. (B) The distribution of the selected reference sites for mRNA decay related RBPs. (C) Meta-gene analysis of the eCLIP enrichment for the mRNA decay related RBPs.
We sought to test whether the pattern of the reference site usage holds in the ROC analysis between RBP-stabilized vs. RBP-degraded targets selected based on different rigorousness. Specifically, we first set a sequence of cutoffs as the quantiles (10%, 30%, and 50%) of the distribution of the absolute value of the expression LFCs. Then, for each cutoff, we extracted a subset of genes whose absolute expression LFC is larger or equal to the cutoff. Third, for each subset of potential RBP targets, we calculated the AUC in the ROC analysis of the PRAS scores with all four reference sites. Finally, we assigned the reference site with the largest AUC value to the corresponding RBP. We observed that the proportion of RBPs with TTS as the reference site is relatively consistent (~50%) across different expression LFC cutoff (Supplementary Fig. S1). The results suggest that TTS that is selected by PRAS for most RNA decay regulators is essential to the RBPs’ binding to achieve their functions.
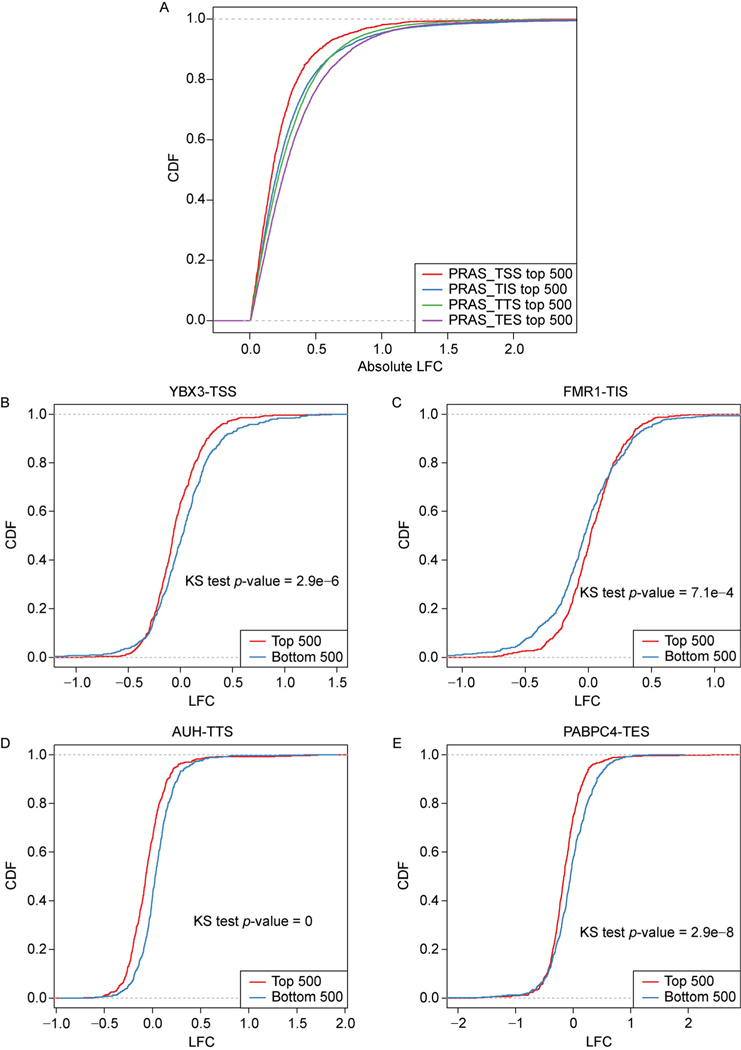
We then evaluated the strength of the RBPs’ regulation by examining the absolute value of expression LFC in the RBP KD condition over wild-type of their top ranked targets. We found that the top 500 targets of the “TTS” group have significantly higher absolute value of expression LFC than those of the “TSS” group with the Kolmogorov–Smirnov test (KS-test) p-value less than 2.2e–16 (Fig. 4A). Surprisingly, we found that the “TES” group targets also have significantly higher absolute value of expression LFC than those of the “TSS” groups with the KS-test p-value less than 2.2e–16. Since TTS and TES are the boundaries of the 3′UTR of RNA, these results indicate the essential association between the 3′UTR of transcripts and the regulation of their expression level by RBPs. We then selected four representative examples with the largest AUC value from each reference site group, respectively. By examining the difference in the absolute gene expression LFC between the top 500 and bottom 500 ranked target genes by their corresponding PRAS scores, we found that AUH in the TTS group obtained larger difference between the top and bottom ranked genes (Fig. 4C, KS test p-value equal to 0), compared to YBX3 in the TSS group (Fig. 4A, KS test p-value equal to 2.9e–6), FMR1 in the TIS group (Fig. 4B, KS test p-value equal to 7.1e–4) and PABPC4 in the TES group (Fig. 4D, KS test p-value equal to 2.9e–8). The two examples from the TTS and TES groups again show larger difference between top and bottom ranked targets than TSS and TIS groups, which confirms the importance of the 3′UTR for RBPs’ binding in RNA decay regulation.
Figure 4. Examples of the four groups of RBPs’ regulations in gene expression.
(A) The cumulative distribution functions (CDFs) of the absolute gene expression LFCs for the top 500 and bottom 500 ranked targets based on the PRAS scores for the mRNA decay related RBPs. (B–E) Same as (A) but for the gene expression LFCs in specific RBPs.
Cell type specific regulation is a typical characteristic of RBP
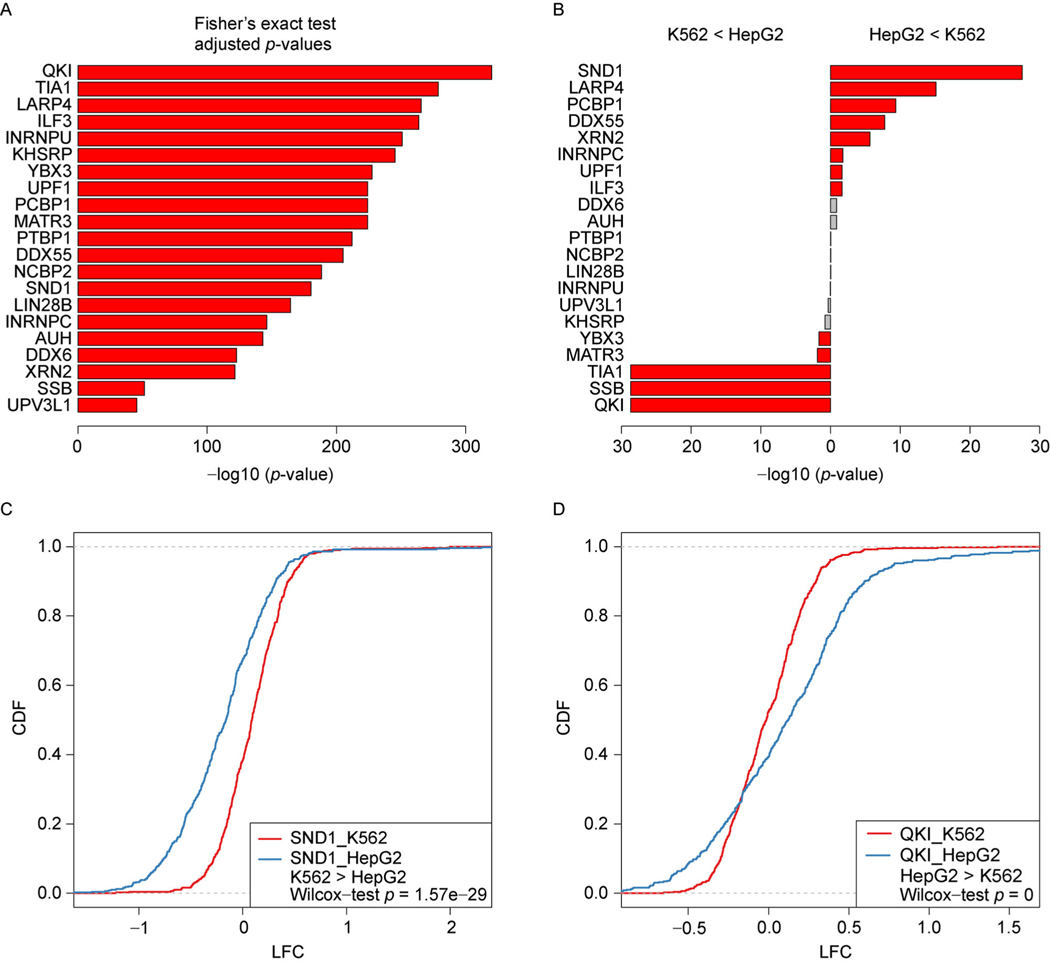
We then examined the difference in the RBPs’ regulation between two cell types, K562 and HepG2. First, we found that the majority of the RBPs (62%) have different reference site usage in their RNA decay regulation (Supplementary Fig. S2). To study the RBP’s regulation difference in the target genes between two cell types, we analyzed the overlap of the top 500 ranked targets between the two cell types for each RBP. We found that the regulated group of genes are significantly overlapping with each other between K562 and HepG2 for all the 21 studied RBPs, with the adjusted Fisher’s Exact test p-values plotted in Fig. 5A. This result indicates that the RBPs tend to target the similar group of genes in different cell types. However, by comparing the LFC of expression value in the KD condition between the top 500 targets in K562 and those in HepG2, we found large difference between the two cell types in the RNA decay regulation by the RBPs. Specifically, 13 out of the 21 studied RBPs have shown significant difference in the gene expression LFC between the top 500 ranked targets in K562 and those in HepG2 (Fig. 5B), which suggests that the stabilization and degradation function can vary across cell types even though the RBPs can target the similar group of genes. For example, Staphylococcal Nuclease and tudor Domain containing 1 (SND1) have significantly overlapping functional targets in the two cell types, with the Fisher’s Exact test p-value equal to 4.9e–182 (Fig. 5A). We found that 336 out of the top 500 targets (67.2%) of SND1 in HepG2 obtained negative LFC value in gene expression between the SND1 KD and wild-type condition, which sugggests that the targets were stabilized by SND1 in the wild-type condition. However, SND1 degraded most of its targets (309 out of the top 500, 61.8%) in K562, in which the expression LFC is significantly different comparing to that in HepG2, with the Wilcoxon rank sum test p-value equal to 1.57e–29 (Fig. 5C). Another RBP, Protein Quaking (QKI) that is associated with RNA stability [29], showed opposite pattern to SND1 between the two cell types (Fig. 5B), where the top 500 ranked targets in HepG2 were significantly degraded comparing to those in K562, with the Wilcoxon rank sum test p-value equal to 0 (Fig. 5D). The results of using the top 200 ranked targets provided the similar pattern as those of top 500 targets (Supplementary Fig. S3). These results suggest that the regulation of RBPs being studied follows a cell type specific pattern.
Figure 5. Cell type-specific regulation of RBPs.
(A) The overlap between K562 and HepG2 on the top 500 ranked targets based on the PRAS scores for the mRNA decay related RBPs. (B) Statistical significance of the difference of the gene expression LFCs between the top 500 ranked targets based on the PRAS scores in K562 and HepG2. (C) The CDFs of the gene expression LFCs for the top 500 ranked targets based on the PRAS scores in K562 and HepG2 for SND1. (D) Same as (C) for QK1.
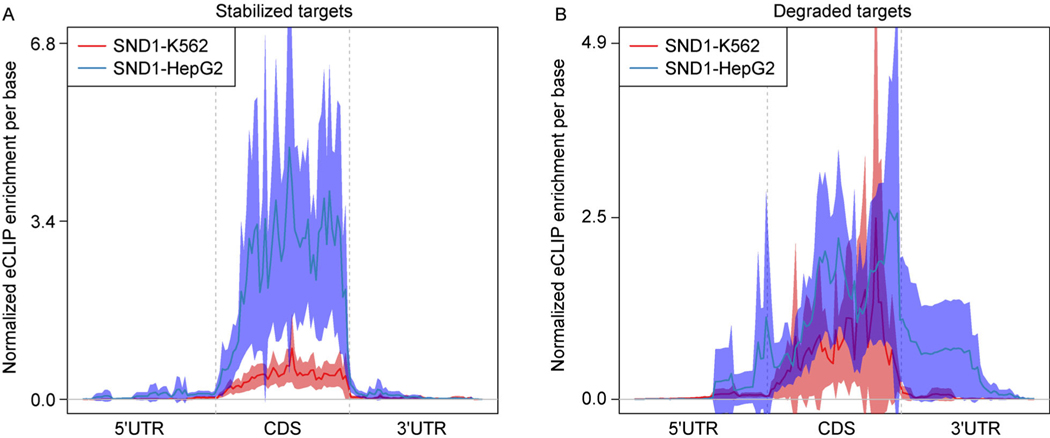
To further characterize the potential causes of the cell type specific RBP regulation, we examined the binding profiles in the two cell types for each RBP. We extracted the DE genes (adjusted p-value<= 0.05) of SND1 and divided them as the SND1-stabilized and SND1-degraded targets based on the direction of the gene expression LFC. We did the meta-gene analysis of the SND1 eCLIP enrichment (computed as above) for both stabilized and degraded targets in the two cell types (Fig. 6). We found that in HepG2, SND1-stabilized genes and SND1-degraded genes had different binding strength: while the SND1-stabilized genes were strongly enriched in coding sequence (CDS) region (Fig. 6A), the SND1-degraded genes were only weakly enriched in CDS (Fig. 6B). In addition, we found that SND1-stabilized targets showed distinctly stronger enrichment on CDS in HepG2 compared to that in K562 (Fig. 6A). However, the difference between the two cell types was subtle for SND1-degraded targets (Fig. 6B). These results of the example RBP, SND1, suggest that the different regulation between HepG2 and K562 by the same RBP is associated with the difference of the binding strength between the two cell types.
Figure 6. SND1’s binding pattern in K562 and HepG2 cell lines.
(A) Cell type specific meta-gene analysis of the eCLIP enrichment for SND1 stabilized targets in K562 and HepG2 cells. (B) Same as (A) for SND1 degraded targets.
CONCLUSIONS AND DISCUSSIONS
In this study, through evaluating the performance of PRAS with different reference sites, we demonstrated that TTS, followed by TES and TIS, plays relatively more important roles for RNA decay regulation of RBPs. The comparison in RBP regulation between K562 and HepG2 cells informed us that the cell type-specific binding strength and functions are typical features for RBPs. These findings not only extended our knowledge in the regulation of RBPs but also made it possible to investigate either a single RBP or multiple RBPs’ binding patterns. Our study also threw light on the RBP regulatory networks in the future by showing that the position-specific binding of RBPs are closely related to their functions.
The fact that many RBPs bind to the 3′UTR to play an important role in regulating RNA stability has been reported in a wide range of studies. For example, a KH domain-containing ARE-binding protein (KSRP), is demonstrated to be an essential factor for mRNA decay via the 3′UTR [30]. The underlying mechanisms were disclosed as that the ability of KSRP to promote mRNA decay correlates with the ability of binding to the ARE [30]. Another RBP named HuR has been reported to bind mainly to the 3′UTR and to regulate the degradation of thousands of target genes [31]. It was found that the KD of HuR triggers the upregulation of miR-7 that is a microRNA promoting mRNA decay [31]. It is demonstrated in another study that UPF1 can sense the length of 3′UTR and accelerate the decay of mRNAs with relatively longer 3′UTRs [32]. It was also shown that the translational readthrough around the translation termination site affects the binding of UPF1, which results in the inhibition of mRNA decay [32]. Our large-scale analysis not only confirms the importance of 3′UTR for RBPs’ binding and regulation of mRNA decay, but also provides a refined list of candidates for further experimental validation.
The RBP binding and regulation differences between K562 and HepG2 suggest the cell type-specific mechanisms of mRNA stability regulation. Admittedly, other potential factors should also be taken into consideration. For instance, the RBPs’ regulatory activity and their targets could be modulated through cell type-specific gene expression [26]. The difference of gene expression level across cell types can result in the variation of IP efficiency as well [26]. In addition, the RBP knockdown efficiency may also differ, which makes the differential gene expression analysis less comparable across cell lines. However, by connecting the cell type-specific function with cell type-specific binding preferences, our analysis provides a refined list of RBP candidates for further experimental validation to understand the mechanisms.
MATERIALS AND METHODS
Data collection
We collected the eCLIP data and differential expression analysis results from the ENCODE Consortium [33,34]. We included the accession numbers in the Supplementary Materials 1 and Supplementary Materials 2 for eCLIP data and RNA-seq data, respectively.
PRAS
PRAS is a newly developed tool for eCLIP-seq analysis, which integrates the intensities and positions of the binding peaks of RBPs for functional mRNA targets prediction [22]. Specifically, PRAS has three major steps to perform the functional targets prediction. First, PRAS merges the significant cross-linking sites that are within a small interval of each other (20 nt is the default setting). If the binding peaks are provided, PRAS will use them directly. Second, PRAS assign a reference site for the RBP score calculation. The reference site can be provided by the user is there is existing knowledge about the RBP; or it is automatically calculated by PRAS based on the binding intensities of the peaks. Third, PRAS scores the genes based on the intensities and distances to the reference site of the peaks. The gene list ranked by the PRAS score will be generated.
RBPs’ functional targets prediction
We applied PRAS to predict the functional targets of RBPs. Four reference sites were used: TSS, TIS, TTS, and TES. We set d0=500 nt as suggested by Lin et al. [22]. We only considered mature mRNAs but not the pre-mRNAs throughout the analysis.
Supplementary Material
ACKNOWLEDGEMENTS
We thank members of the Ouyang Lab for discussions. We thank the ENCODE Consortium and Gene Yeo’s Lab from UCSD for generating the eCLIP data and Brenton Graveley’s Lab from UConn for generating the shRNA knockdown followed by RNA-seq data. Z.O. acknowledges the National Institute of General Medical Sciences (https://www.nigms.nih.gov/) grant R35GM124998. The funder had no role in study design, data collection and analysis, decision to publish, or preparation of the manuscript.
Footnotes
COMPLIANCE WITH ETHICS GUIDELINES
The authors Jianan Lin and Zhengqing Ouyang declare that they have no conflict of interests.
All procedures performed in studies were in accordance with the ethical standards of the institution or practice at which the studies were conducted, and with the 1964 Helsinki declaration and its later amendments or comparable ethical standards.
SUPPLEMENTARY MATERIALS
The supplementary materials can be found online with this article at https://10.1007/s40484-020-0206-5.
REFERENCES
- 1.Keene JD (2007) RNA regulons: coordination of post-transcriptional events. Nat. Rev. Genet, 8, 533–543 [DOI] [PubMed] [Google Scholar]
- 2.Licatalosi DD, Mele A, Fak JJ, Ule J, Kayikci M, Chi SW, Clark TA, Schweitzer AC, Blume JE, Wang X, et al. (2008) HITS-CLIP yields genome-wide insights into brain alternative RNA processing. Nature, 456, 464–469 [DOI] [PMC free article] [PubMed] [Google Scholar]
- 3.Kao DI, Aldridge GM, Weiler IJ and Greenough WT (2010) Altered mRNA transport, docking, and protein translation in neurons lacking fragile X mental retardation protein. Proc. Natl. Acad. Sci. USA, 107, 15601–15606 [DOI] [PMC free article] [PubMed] [Google Scholar]
- 4.King OD, Gitler AD and Shorter J. (2012) The tip of the iceberg: RNA-binding proteins with prion-like domains in neurodegenerative disease. Brain Res, 1462, 61–80 [DOI] [PMC free article] [PubMed] [Google Scholar]
- 5.Lagier-Tourenne C, Polymenidou M. and Cleveland DW (2010) TDP-43 and FUS/TLS: emerging roles in RNA processing and neurodegeneration. Hum. Mol. Genet, 19, R46–R64 [DOI] [PMC free article] [PubMed] [Google Scholar]
- 6.Lukong KE, Chang KW, Khandjian EW and Richard S. (2008) RNA-binding proteins in human genetic disease. Trends Genet, 24, 416–425 [DOI] [PubMed] [Google Scholar]
- 7.König J, Zarnack K, Luscombe NM and Ule J. (2012) Protein-RNA interactions: new genomic technologies and perspectives. Nat. Rev. Genet, 13, 77–83 [DOI] [PubMed] [Google Scholar]
- 8.Hafner M, Landthaler M, Burger L, Khorshid M, Hausser J, Berninger P, Rothballer A, Ascano M Jr, Jungkamp AC, Munschauer M, et al. (2010) Transcriptome-wide identification of RNA-binding protein and microRNA target sites by PAR-CLIP. Cell, 141, 129–141 [DOI] [PMC free article] [PubMed] [Google Scholar]
- 9.König J, Zarnack K, Rot G, Curk T, Kayikci M, Zupan B, Turner DJ, Luscombe NM and Ule J. (2010) iCLIP reveals the function of hnRNP particles in splicing at individual nucleotide resolution. Nat. Struct. Mol. Biol, 17, 909–915 [DOI] [PMC free article] [PubMed] [Google Scholar]
- 10.Cook KB, Hughes TR and Morris QD (2015) High-throughput characterization of protein-RNA interactions. Brief. Funct. Genomics, 14, 74–89 [DOI] [PMC free article] [PubMed] [Google Scholar]
- 11.Chen B, Yun J, Kim MS, Mendell JT and Xie Y. (2014) PIPE-CLIP: a comprehensive online tool for CLIP-seq data analysis. Genome Biol, 15, R18. [DOI] [PMC free article] [PubMed] [Google Scholar]
- 12.Wang T, Xie Y. and Xiao G. (2014) dCLIP: a computational approach for comparative CLIP-seq analyses. Genome Biol, 15, R11. [DOI] [PMC free article] [PubMed] [Google Scholar]
- 13.Wang T, Chen B, Kim M, Xie Y. and Xiao G. (2014) A model-based approach to identify binding sites in CLIP-Seq data. PLoS One, 9, e93248 [DOI] [PMC free article] [PubMed] [Google Scholar]
- 14.Lovci MT, Ghanem D, Marr H, Arnold J, Gee S, Parra M, Liang TY, Stark TJ, Gehman LT, Hoon S, et al. (2013) Rbfox proteins regulate alternative mRNA splicing through evolutionarily conserved RNA bridges. Nat. Struct. Mol. Biol, 20, 1434–1442 [DOI] [PMC free article] [PubMed] [Google Scholar]
- 15.Althammer S, González-Vallinas J, Ballaré C, Beato M. and Eyras E. (2011) Pyicos: a versatile toolkit for the analysis of high-throughput sequencing data. Bioinformatics, 27, 3333–3340 [DOI] [PMC free article] [PubMed] [Google Scholar]
- 16.Uren PJ, Bahrami-Samani E, Burns SC, Qiao M, Karginov FV, Hodges E, Hannon GJ, Sanford JR, Penalva LO and Smith AD (2012) Site identification in high-throughput RNA-protein interaction data. Bioinformatics, 28, 3013–3020 [DOI] [PMC free article] [PubMed] [Google Scholar]
- 17.Comoglio F, Sievers C. and Paro R. (2015) Sensitive and highly resolved identification of RNA-protein interaction sites in PAR-CLIP data. BMC Bioinformatics, 16, 32. [DOI] [PMC free article] [PubMed] [Google Scholar]
- 18.Corcoran DL, Georgiev S, Mukherjee N, Gottwein E, Skalsky RL, Keene JD and Ohler U. (2011) PARalyzer: definition of RNA binding sites from PAR-CLIP short-read sequence data. Genome Biol, 12, R79. [DOI] [PMC free article] [PubMed] [Google Scholar]
- 19.Moore MJ, Zhang C, Gantman EC, Mele A, Darnell JC and Darnell RB (2014) Mapping Argonaute and conventional RNA-binding protein interactions with RNA at single-nucleotide resolution using HITS-CLIP and CIMS analysis. Nat. Protoc, 9, 263–293 [DOI] [PMC free article] [PubMed] [Google Scholar]
- 20.Shah A, Qian Y, Weyn-Vanhentenryck SM and Zhang C.(2017) CLIP Tool Kit (CTK): a flexible and robust pipeline to analyze CLIP sequencing data. Bioinformatics, 33, 566–567 [DOI] [PMC free article] [PubMed] [Google Scholar]
- 21.Erhard F, Dölken L, Jaskiewicz L. and Zimmer R. (2013) PARma: identification of microRNA target sites in AGO-PAR-CLIP data. Genome Biol, 14, R79. [DOI] [PMC free article] [PubMed] [Google Scholar]
- 22.Lin J, Zhang Y, Frankel WN and Ouyang Z. (2019) PRAS: Predicting functional targets of RNA binding proteins based on CLIP-seq peaks. PLOS Comput. Biol, 15, e1007227 [DOI] [PMC free article] [PubMed] [Google Scholar]
- 23.Rot G, Wang Z, Huppertz I, Modic M, Lenče T, Hallegger M, Haberman N, Curk T, von Mering C. and Ule J. (2017) High-resolution RNA maps suggest common principles of splicing and polyadenylation regulation by TDP-43. Cell Reports, 19, 1056–1067 [DOI] [PMC free article] [PubMed] [Google Scholar]
- 24.Wang ET, Ward AJ, Cherone JM, Giudice J, Wang TT, Treacy DJ, Lambert NJ, Freese P, Saxena T, Cooper TA, et al. (2015) Antagonistic regulation of mRNA expression and splicing by CELF and MBNL proteins. Genome Res, 25, 858–871 [DOI] [PMC free article] [PubMed] [Google Scholar]
- 25.Van Nostrand EL, Pratt GA, Shishkin AA, Gelboin-Burkhart C, Fang MY, Sundararaman B, Blue SM, Nguyen TB, Surka C, Elkins K, et al. (2016) Robust transcriptome-wide discovery of RNA-binding protein binding sites with enhanced CLIP (eCLIP). Nat. Methods, 13, 508–514 [DOI] [PMC free article] [PubMed] [Google Scholar]
- 26.Van Nostrand EL, Freese P, Pratt GA, Wang X, Wei X, Xiao R, Blue SM, Chen J-Y, Cody NAL, Dominguez D, et al. (2018) A large-scale binding and functional map of human RNA binding proteins. bioRxiv, 179648 [DOI] [PMC free article] [PubMed] [Google Scholar]
- 27.Love MI, Huber W. and Anders S. (2014) Moderated estimation of fold change and dispersion for RNA-seq data with DESeq2. Genome Biol, 15, 550. [DOI] [PMC free article] [PubMed] [Google Scholar]
- 28.Wagnon JL, Briese M, Sun W, Mahaffey CL, Curk T, Rot G, Ule J. and Frankel WN (2012) CELF4 regulates translation and local abundance of a vast set of mRNAs, including genes associated with regulation of synaptic function. PLoS Genet, 8, e1003067 [DOI] [PMC free article] [PubMed] [Google Scholar]
- 29.Chénard CA and Richard S. (2008) New implications for the QUAKING RNA binding protein in human disease. J. Neurosci. Res, 86, 233–242 [DOI] [PubMed] [Google Scholar]
- 30.Gherzi R, Lee K-Y, Briata P, Wegmüller D, Moroni C, Karin M. and Chen C-Y (2004) A KH domain RNA binding protein, KSRP, promotes ARE-directed mRNA turnover by recruiting the degradation machinery. Mol. Cell, 14, 571–583 [DOI] [PubMed] [Google Scholar]
- 31.Lebedeva S, Jens M, Theil K, Schwanhäusser B, Selbach M, Landthaler M. and Rajewsky N. (2011) Transcriptome-wide analysis of regulatory interactions of the RNA-binding protein HuR. Mol. Cell, 43, 340–352 [DOI] [PubMed] [Google Scholar]
- 32.Hogg JR. and Goff SP (2010) Upf1 senses 3′ UTR length to potentiate mRNA decay. Cell, 143, 379–389 [DOI] [PMC free article] [PubMed] [Google Scholar]
- 33.The ENCODE Project Consortium (2012) An integrated encyclopedia of DNA elements in the human genome. Nature, 489,57–74 [DOI] [PMC free article] [PubMed] [Google Scholar]
- 34.Davis CA, Hitz BC, Sloan CA, Chan ET, Davidson JM, Gabdank I, Hilton JA, Jain K, Baymuradov UK, Narayanan AK, et al. (2018) The Encyclopedia of DNA elements (ENCODE): data portal update. Nucleic Acids Res, 46, D794–D801 [DOI] [PMC free article] [PubMed] [Google Scholar]
Associated Data
This section collects any data citations, data availability statements, or supplementary materials included in this article.


