

Abstract
Background and aims
Several reports have documented risk factors for opioid use following treatment discharge, yet few have assessed sex differences, and no study has assessed risk using contemporary machine learning approaches. The goal of the present paper was to inform treatments for opioid use disorder (OUD) by exploring individual factors for each sex that are most strongly associated with opioid use following treatment.
Design
Secondary analysis of Global Appraisal of Individual Needs (GAIN) database with follow-ups at 3, 6 and 12 months post-OUD treatment discharge, exploring demographic, psychological and behavioral variables that predict post-treatment opioid use.
Setting
One hundred and thity-seven treatment sites across the United States.
Participants
Adolescents (26.9%), young adults (40.8%) and adults (32.3%) in treatment for OUD. The sample (n = 1,126) was 54.9% male, 66.1% white, 20% Hispanic, 9.8% multi-race/ethnicity, 2.8% African American and 1.3% other.
Measurement
Primary outcome was latency to opioid use over 1 year following treatment admission.
Results
For women, regularized Cox regression indicated that greater withdrawal symptoms [hazard ratio (HR) = 1.31], younger age (HR = 0.88), prior substance use disorder (SUD) treatment (HR = 1.11) and treatment resistance (HR = 1.11) presented the largest hazard for post-treatment opioid use, while a random survival forest identified and ranked substance use problems [variable importance (VI) = 0.007], criminal justice involvement (VI = 0.006), younger age (VI = 0.005) and greater withdrawal symptoms (VI = 0.004) as the greatest risk factors. For men, Cox regression indicated greater conduct disorder symptoms (HR = 1.34), younger age (HR = 0.76) and multiple SUDs (HR = 1.27) were most strongly associated with post-treatment opioid use, while a random survival forests ranked younger age (VI = 0.023), greater conduct disorder symptoms (VI = 0.010), having multiple substance use disorders (VI = 0.010) and criminal justice involvement (VI = 0.006) as the greatest risk factors.
Conclusion
Risk factors for relapse to opioid use following opioid use disorder treatment appear to be, for women, greater substance use problems and withdrawal symptoms and, for men, younger age and histories of conduct disorder and multiple substance use disorder.
Keywords: Adolescents, machine learning, opioid use disorder, opioids, risk factors, trauma, treatment
INTRODUCTION
Opioid use, defined as use of heroin or prescription opioids, exacts a prodigious personal and societal burden across the globe [1]. In the United States alone, more than 40 000 opioid-related deaths were reported in 2017, with an annual domestic economic burden of nearly $80 billion in costs, including treatment, loss of productivity and criminal justice involvement [2,3]. While many individuals with opioid use disorder (OUD) access treatment, achieving and sustaining opioid abstinence remains a persistent challenge, even among those with considerable treatment experience and high motivation to recover [4]. Prior work has suggested that severity of OUD diagnosis [5,6], coping styles [7] and characteristics of individuals’ social networks are key predictors of post-treatment return to use [8–10] while, conversely, a handful of studies have failed to identify risk factors [11,12]. Identifying factors that may heighten risk for opioid use following treatment remains a top research priority.
Numerous sex differences have been observed in the antecedents of OUD and its sequelae. For instance, women are more likely to have experienced childhood sexual abuse, while men are more likely to have experienced physical abuse [13]. Additionally, women are more likely than men to report familial and social problems related to their opioid use [14,15]. Women also appear to have substantially greater functional impairment as a result of OUD [14,16,17] and progress faster than men from the onset of opioid use to diagnosable OUD [16,18,19]. This faster progression may be attributable to the fact that women who use or misuse opioids are more likely to have co-occurring psychiatric disorders than men, with mood and anxiety disorders being especially prominent [14,15,20–22]. In terms of treatment outcomes, results are mixed among men and women [23–25]. For example, in a clinical trial for adults with opioid dependence, no sex differences were observed in terms of opioid use outcomes; however, women reported greater functional impairment, greater psychiatric severity, and were more likely to endorse opioid use to cope with negative affect [24]. Further, in one of the only studies investigating treatment effects among adolescents and young adults, results indicated differential effects of treatment by age and sex [25].
To date, few studies have considered sex differences in risk factors for post-treatment opioid use, and existing studies have several key limitations. First, prior research has primarily been conducted on small samples of individuals receiving OUD medications, which limits (a) statistical power to detect relevant predictors of post-treatment opioid use and (b) generalizability to the population of people seeking various forms of treatment for OUD. Secondly, research on this topic has typically tested a small number of predictors, which limits our ability to understand which factors convey the most relative risk. Thirdly, to our knowledge, no study has applied machine learning methods to concurrently test a large set of predictors to identify which contribute most to return to opioid use. These methods permit the generation of models that can be used to understand an individual patient’s risk for returning to opioid use as a function of multiple, specific, risk factors.
To address these gaps, the current study sought to identify the factors most predictive of post-treatment opioid use for both women and men, using a combination of regularized Cox regression and decision tree machine learning methods. Machine learning approaches learn from, and model, large data sets with a large number of predictors. Machine learning approaches can also determine rank order of importance in predictors in explaining an outcome, predict who is most at risk for the outcome of interest, and model complex interactions between predictors and outcomes [26,27]. Further, machine learning ‘decision trees’ output the most important predictors for an outcome, making results easy to interpret and apply in clinical contexts. Given the large number of variables explored in this study, and the mixed literature to date identifying sex differences among risk factors for return to opioid use, we did not begin with any a priori hypotheses. Rather, we took an inductive, exploratory approach to drive future hypothesis-driven research exploring potential moderators and mediators of OUD treatment outcomes.
METHODS
Design
This was a secondary analysis of the Global Appraisal of Individual Need (GAIN) data set [28], which includes individuals aged ≥ 12 in outpatient treatment for OUD. We utilized Cox regression and random survival forests machine learning models to identify demographic, psychological and behavioral measures predicting latency of return to opioid use following treatment. Analyses were not pre-registered and results of this study should be considered exploratory.
Participants and procedures
The study sample included all individuals (n = 1,126) entering treatment for OUD between 2002 and 2013 (4.25% of the entire data set). GAIN data were obtained from 137 sites with funding from the Center for Substance Abuse Treatment Substance Abuse and Mental Health Services Administration (SAMHSA) block grants to improve and expand existing substance use treatment services and support the adoption of evidence-based treatments [28]. Each individual completed a baseline assessment at treatment entry, received treatment (with behavioral treatment type varying by site) and completed follow-up assessments at 3, 6 and 12 months. On average, participants were in treatment for 45 days [standard deviation (SD) = 70.0].
Measures
Dependent variable (opioid use)
Number of days to first opioid use episode (either opioids such as herion or prescription opioids taken without a prescription or taking more than prescribed) following treatment was assessed using participants’ retrospective self-report at follow-up assessments. Specifically, if participants used opioids over a follow-up period, they were asked to indicate how many days since their last assessment had passed before opioid use. Participants responded with a value from 0 (indicating they used that very day) to 90 or more (indicating that they did not use at all during the follow-up period). Data were combined across follow-up periods to create a single variable that indicates the day each participant reported using opioids. Thus, lower values indicate a more rapid return to opioid use. This event variable allowed us to model survival functions for every day in the year following treatment entry.
Independent variables (risk factors)
The grouping variable was participant self-reported sex. To retain nuance, we used ordinal versions of our predictor variables (where available) that were provided by the GAIN coordinating center. In the GAIN data set, variables are categorized as ‘low’, ‘moderate’ and ‘high’ based on the distribution of the variable and normative data collected within age groups. Age groups in the GAIN data set are defined as 12–17 (adolescence), 18–25 (young adulthood) and 26+ (adult). Diagnostic and Statistical Manual of Mental Disorder IV (DSM-IV) diagnostic criteria [29] are used for all disorder-specific assessments, with severity categorized as follows: low (below diagnostic criteria), moderate (above diagnostic criteria to moderate; e.g. mild OUD) and high (sufficient for high severity; e.g. moderate to high OUD). Normally distributed variables are split as follows: low (bottom 50%), moderate (next 40%) and high (top 10%). Zero saturated or right-skewed variables are split as follows: low (=0), and moderate to high (=1; based on the median split of 1 + the distribution). Table 1 shows each item/measure with a short description, proportion of participants in each category and percentage missing.
Table 1.
Description of independent variables used in machine learning models
| Variable | Description | n | Type | Category n | Missing % |
|---|---|---|---|---|---|
| Sex | Self-reported sex (men/women) | 1120 | Binary | 616/504 | 0.0% |
| Race/ethnicity | Non-white race/ethnicity (non-white/white) | 1120 | Binary | 741/379 | 0.0% |
| Unemployment | Currently employed or laid off (employed/laid off) | 1117 | Binary | 559/558 | 0.3% |
| No insurance | Insurance status (insured/not insured) | 754 | Binary | 318/436 | 32.7% |
| Prior SUD treatment | Any prior substance use disorder treatment (yes/no) | 1118 | Binary | 424/694 | 0.2% |
| Total treatment needs | Number of needs to be addressed during treatment planning | 1120 | Continuous | 3–32 | 0.0% |
| Treatment resistance index | Number of difficulties being treated or resisting substance use (low/moderate/high) | 1102 | Quartiles | 401/628/73 | 1.6% |
| Victimization | Count of types of victimization and traumagenic factors experienced by the respondent (low/moderate/high) | 1115 | Quartiles | 278/186/651 | 0.4% |
| PTSD | Post-traumatic stress disorder diagnosis (yes/no) | 1117 | Binary | 653/464 | 0.3% |
| Age of onset < 15 | Substance use debut prior to age 15 (yes/no) | 1106 | Binary | 354/752 | 1.3% |
| Current withdrawal symptoms | Count of substance withdrawal symptoms (past 2 weeks) (low/moderate/high) | 1119 | Quartiles | 879/110/130 | 0.1% |
| Substance use problems | Count of substance use problems and consequences (past 90 days) (low/moderate/high) | 1120 | Quartiles | 62/423/635 | 0.0% |
| Multiple substance use disorder diagnoses | Multiple substance use disorder diagnoses (past year; yes/no) | 1120 | Binary | 151/969 | 0.0% |
| Dual diagnosis | Dual-diagnosis (past year; yes/no) | 918 | Binary | 23/895 | 18.0% |
| Pressure to be in treatment | Any pressure to be in treatment at intake (yes/no) | 796 | Binary | 293/503 | 28.9% |
| Depression symptoms | DSM-IV depressive symptom count (past year; low/moderate/high) | 1118 | Quartiles | 267/369/482 | 0.2% |
| Emotional Problem scale | Days bothered by emotional problems, memories, and problems with self-control due to emotional problems. (low/moderate/high) | 1118 | Quartiles | 294/591/233 | 0.2% |
| ADHD | DSM-IV attention deficit hyperactivity disorder symptom count. (low/moderate/high) | 1118 | Quartiles | 425/308/385 | 0.2% |
| Conduct disorder | DSM-IV conduct disorder symptom count (past year) (low/moderate/high) | 1117 | Quartiles | 570/420/127 | 0.3% |
| Suicide problems | Any suicide problems reported (past year; yes/no) | 1118 | Binary | 962/156 | 0.2% |
| Criminal justice involvement | Days of criminal justice system involvement (past 90 days; low/moderate/high) | 1079 | Quartiles | 340/292/447 | 3.7% |
| Living risk index | Number of people respondent lives with that are involved with illegal activities, substance use or treatment, or are in recovery (past 90 days; low/moderate/high) |
1097 | Quartiles | 14/553/530 | 2.1% |
| Social risk index | Number of respondent’s social network that are involved with illegal activities, substance use or treatment, or are in recovery (past 90 days; low/moderate/high) |
1081 | Quartiles | 11/375/695 | 3.5% |
| Homelessness experience | Ever considered self to be homeless (life-time; yes/no) | 1116 | Binary | 788/328 | 0.4% |
| Attend mutual-help meeting | Ever attended mutual-help group (AA, NA, etc.; yes/no) | 1118 | Binary | 384/734 | 0.2% |
| Personal sources of stress | Count of the number of stressors related to personal relationship issues such as birth, death, health problems, arguing, etc. (low/moderate/high) | 765 | Quartiles | 310/401/54 | 31.7% |
| Recovery environment | Percentage of days going to mutual-help meetings and involvement in structured substance-free activities (past 90 days; low/moderate/high) | 731 | Quartiles | 355/296/80 | 34.7% |
| Peers in recovery | Participant is not close to anyone in recovery (yes/no) | 1092 | Binary | 428/664 | 2.5% |
| Age group | 12–17, 18–25, 26+ | 1120 | Factor | 300/408/412 | 0.0% |
Quartiles include low/moderate/high as categories. Factors include, adolescent/young/old as categories. Bold type indicates variables that have more than 25% missing and, thus, were not included in models. DSM-IV = Diagnostic and Statistical Manual of Mental Disorder IV SUD = substance use disorder; PTSD = post-traumatic stress disorder; ADHD = attention deficit hyperactive disorder.
Analytical plan
We utilized regularized Cox regression and random survival forests [26] to identify predictors of return to opioid use. Regularized Cox regression produces the relative magnitude of effects [i.e. hazard ratios HRs)], whereas random survival forests produce the rank order of importance (i.e. how much each predictor improves model fit). Utilizing both of these methods allowed us to compare how traditional regression performs against a newer machine learning approach, and how these two sets of results can provide a more nuanced picture of opioid use following treatment discharge.
First, regularized Cox regression was used to identify the basic linear associations of variables with return to use. Specifically, the regularization method least absolute shrinkage and selection operator (LASSO) was implemented [30]. Here, variables which do not provide significant prediction of the outcome are penalized, limiting results to only variables with statistical non-zero estimated effects. We implemented an elastic net method to select between the two extremes of regularized regression, LASSO and ridge regression, which focuses on shrinking estimated effects without performing variable selection [31,32]. This method, however, produces biased estimates of coefficients in implementing shrinkage factors to winnow the covariate pool [33]. These estimates should be identified as starting-points in future studies, informing direction and relative impact versus other predictors. This process reduces overfitting of the model, leaving only variables that are related to our survival probability.
Following regularized regression, a random survival forest method was implemented to identify and rank order important variables [34]. The random forest design randomly samples cases from the data for each decision tree and at each decision node a random subset of variables is tested to segment the data [35]. Then, using a random survival forests framework, segmented variables are compared using the log-rank method, where more impactful variables (i.e. those with larger log-rank values) are selected more frequently [36]. Using R packages glmnet and randomForestSRC [34,37], our methods for assessing random forests included: (1) variable importance (VI) and (2) depth threshold. The VI metric identifies a forest’s predicted survival accuracy when each variable was randomly shuffled across trees. The more impactful a variable is through all trees in the forest, the higher the relative VI value associated with that variable compared to others. Depth threshold is calculated as the distance from root node, where smaller values indicate variables found closer to the beginning of the segmenting process. Variables which are only impactful further from the top of a particular tree have a smaller impact on the overall model (i.e. fewer rows of data are segmented and influenced by these variables). These calculations are used in combination to identify impactful and relevant variables within a random forest solution.
Missing data
Variables with more than 75% available data were first sorted by level of care (inpatient, outpatient, intensive outpatient), sex, race and age. Then, the 10 cases before and after each missing value were used to compute the mode for imputing a value [38].
RESULTS
The sample, on average, was aged 24.5 (SD = 9.67) years; 26.9% were 12–17, 40.8% were 18–25 and 32.3% were 26+. Slightly more than 45% of participants were women (n = 508). More than two-thirds (66.1%) of participants identified as white (n = 744), with 20% (n = 225) identifying as Hispanic, 9.8% (n = 110) as multi-race/ethnicity, 2.8% (n = 32) as African American and 1.3% (n = 15) as other. Approximately half of participants—55.1% of women and 51.5% of men—had an opioid use episode during the 1-year observation window. See Table 1 for more information.
The overall plots in Fig. 1 indicate similar survival rates over time between women and men. This is further supported by testing the between group effect within the Cox framework [hazard ratio (HR) = 1.08, 95% confidence interval (CI) = 0.92, 1.2 7]. The median number of days to opioid use following treatment was 64 days for women and 60 days for men.
Figure 1.
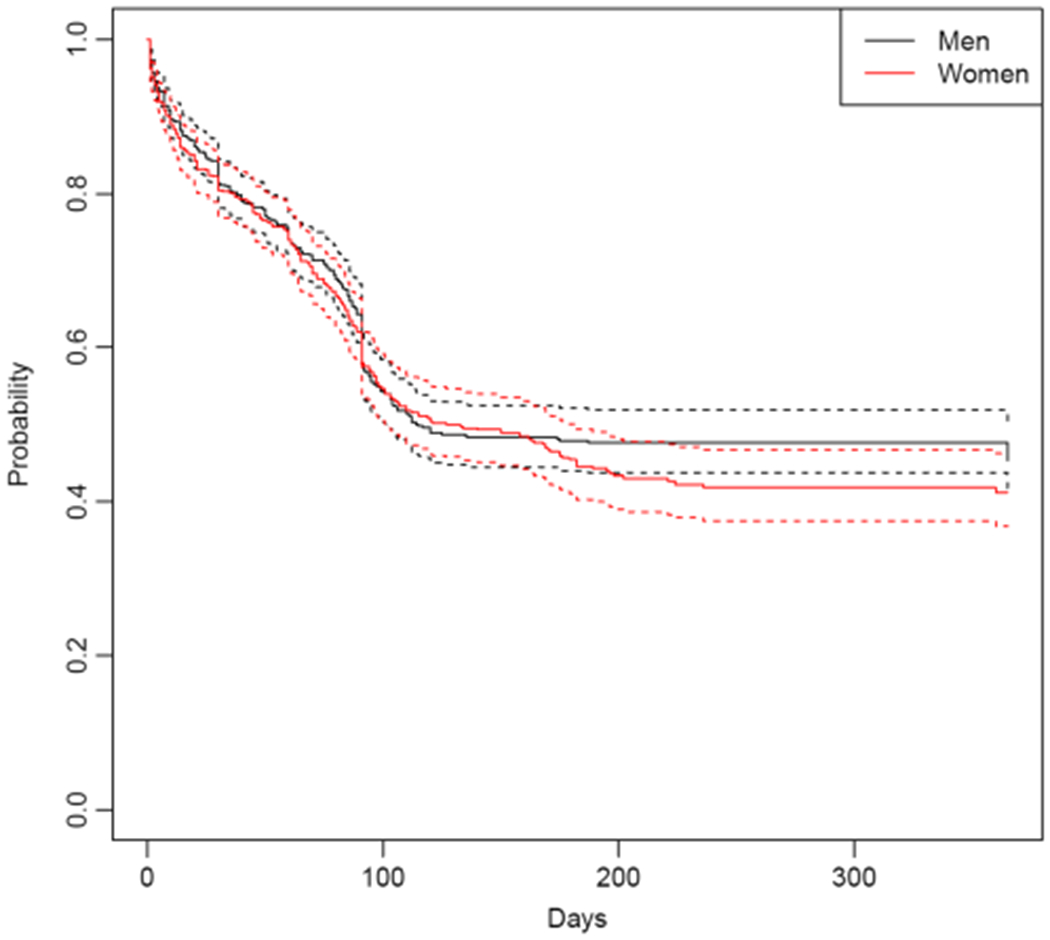
Overall return to opioid use suivival curves for men and women (solid lines), with confidence intervals (dotted lines)
Regularized Cox regression
Elastic net models were built separately for women and men. For each sample, 10-fold cross-validation samples were identified and used to select both the shrinkage factor (λ) and mixture of ridge/LASSO (α). The shrinkage factor reduces the impact of each covariate in the model. Selection of a ridge versus LASSO model identifies the degree to which variable selection occurs in order to drop variables that are not influential in predicting survival.
For the women-only model (Fig. 2, bottom) the tuning stage showed a pure LASSO method (α =1) and associated minimum shrinkage value (λ = 0.042). A 10-fold cross-validation sample was used to produce tuning specifics for the group, where α = 1, and the minimum shrinkage value was λ = 0.03 7. For women, the following variables remained significant in predicting survival (highest to lowest): withdrawal symptoms (HR = 1.31; high versus low), age group (HR = 0.88; 26+ versus 12–17), prior substance use disorder treatment (HR = 1.11; yes versus no), treatment resistance (HR = 1.11; high versus low), depression (HR = 1.10; high versus low), conduct disorder symptoms (HR = 1.05; high versus low), post-traumatic stress disorder (PTSD) diagnosis (HR = 1.03; yes versus no), victimization (HR = 0.98; high versus low) and criminal justice involvement (HR = 0.87; high versus low). Days of substance use at baseline was also retained but not included here, as it was included in modeling to control for baseline behavior.
Figure 2.
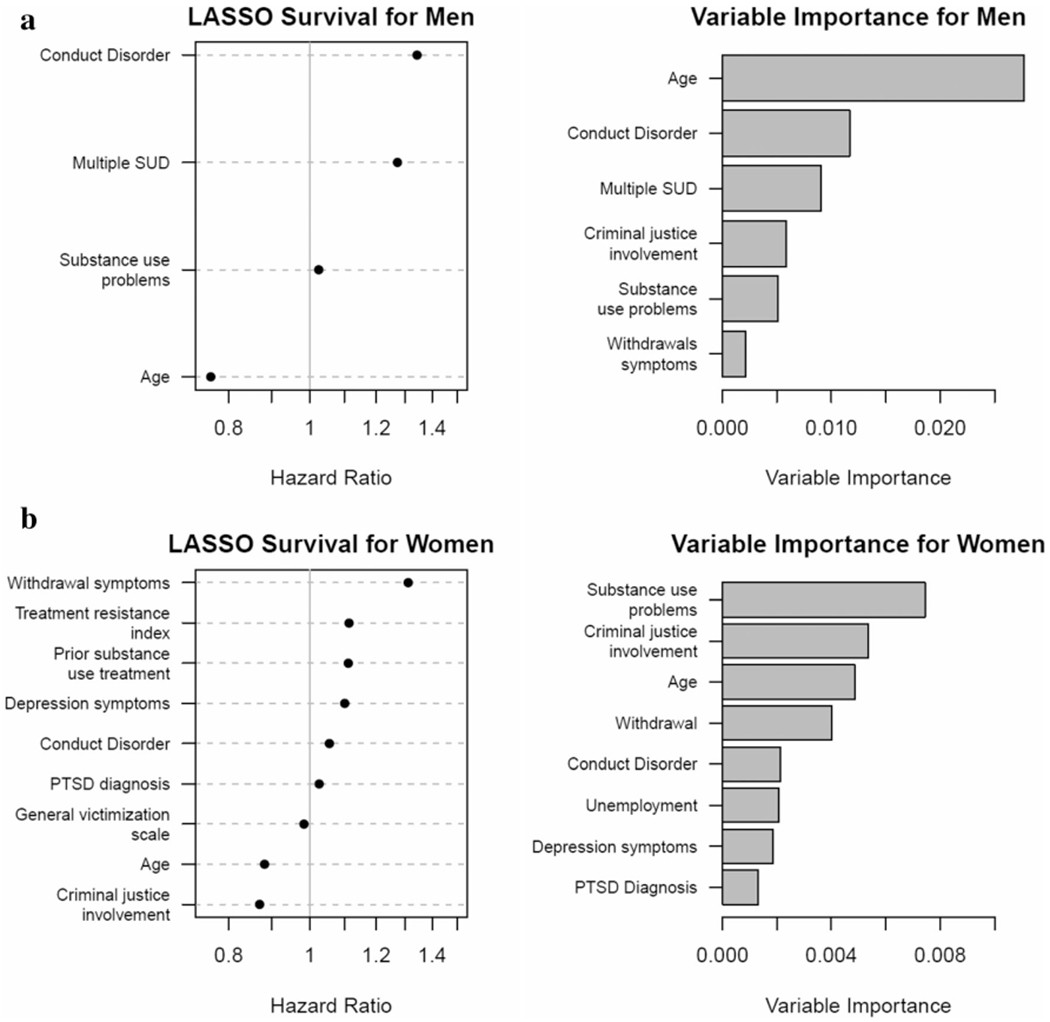
Hazard ratios (LASSO) and rank order variable importance (random forest model) for men (a, top), and women (b, bottom). PTSD = post traumatic stress disorder; SUD = substance use disorder
Based on this selected tuning, four variables were retained for the men-only model (Fig. 2, top). HRs for return to opioid use for the Cox regression models indicated (from highest to lowest): conduct disorder symptoms (HR = 1.34; high versus low), age (HR = 0.76; 26+ versus 12–17), multiple substance use disorders (HR = 1.27; yes versus no) and substance use problems (HR = 1.02; high versus low).
Random survival forests
Random survival forests were then fitted for both women and men separately. As with regularized Cox regression models, a tuning process was first undertaken to identify hyperparameters for fitting a random forest; we varied the number of trees estimated, the minimum number of people per node and how many variables were randomly selected at each node. For both men and women, stability in out-of-bag error rates was observed after a minimum of 250 trees was imposed.
For women, a minimum terminal node of 15 individuals and a random subset of five variables were selected for each node with 900 trees. The random forest prediction error rate from out-of-bag cases was 43.2% (accuracy = 56.8%), a minor improvement over the observed base rate of relapse. In other words, the sample relapse probability was found to be slightly less accurate than using predicted relapse probabilities generated from the random survival forest.
For men, minimum terminal node of 25 individuals and a random subset of seven variables were selected for each node with 700 trees. The final random forest had an error rate from out-of-bag cases of 37.7% (accuracy = 62.3%), improving on the overall rate of relapse observed in the sample of men. Put another way, using the sample relapse probability would yield less accurate relapse predictions versus predictions presented with the random survival forest.
The sex-specific random forests were then aggregated to identify the rank order of variable importance in classifying and predicting relapse hazards by sex. In the women-specific model (see Fig. 2, bottom) the top predictors of opioid use following treatment were, in order: substance use problems (VI = 0.007), criminal justice involvement (VI = 0.006), age (VI = 0.005), withdrawal symptoms (VI = 0.004), conduct disorder symptoms (VI = 0.003), unemployment (VI = 0.002), depression symptoms (VI = 0.002) and PTSD symptoms (VI = 0.002). In addition to rank order of importance, variables that had the lowest (to highest) depth (threshold = 4.39; i.e. those variables that emerged at the top of our trees, thus imposing more influence in splitting the data) were: age, substance use problems, withdrawal symptoms, criminal justice involvement, depression and treatment resistance.
For men (see Fig. 2b, right) the top predictors of return to opioid use following treatment were, in order: age (VI = 0.023), conduct disorder symptoms (VI = 0.010), presence of multiple substance use disorders (VI = 0.010), criminal justice involvement (VI = 0.006), substance use problems (VI = 0.005) and withdrawal symptoms (VI = 0.002). In addition to rank order of importance, variables that had the lowest (to highest) depth (threshold = 4.61) were: age, conduct disorder symptoms, multiple substance use disorder diagnoses, criminal justice involvement and substance use problems.
Separately, an analysis of random survival forest interactions between variables was performed on the five most influential variables for each sex. This tests model error when the pair of variables is randomly versus individually perturbed [39]. As shown in Supporting information, Table S1, there are no paired combinations where there are significantly large values in either direction, meaning no interactions were detected.
As a visual example of how results of our models could be applied by clinicians to understand individual patient risk, we present prototypical plots of combinations for rank-ordered predictors of return to opioid use for both women and men (Fig. 3a,b), which show how identified risk factors dynamically interact to influence return to opioid use.
Figure 3.
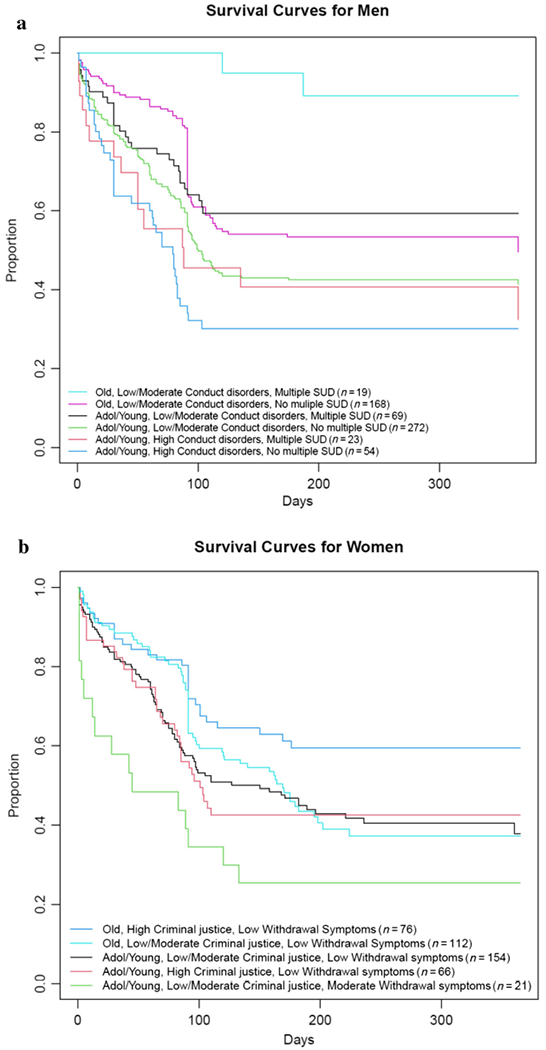
Prototypical survival curves for combinations of the top three predictors of latency of return to opioid use from the random forest variable importance models for men (a, top) and women (b, bottom). Among women, those with the quickest return to opioid use are adolescent/young adult women, with low levels of criminal justice involvement (this was a protective factor for women in our models) and at least moderate levels of withdrawal symptoms. Those with the lowest risk of return to use are women aged 26+ with high levels of criminal justice involvement and no withdrawal symptoms. For men, those with the quickest return to use are adolescents/young adults who endorse high levels of conduct disorders with fewer substance use disorder (SUD) diagnoses. For men, the group with the lowest risk are adults aged 26+ with low conduct disorder symptoms and multiple substance use disorders. These are just two examples; survival plots can be created for any combination of factors from the random forest models, thus providing an individualized risk profile for each person
DISCUSSION
In light of the current OUD crisis, it is critical to identify individual factors that portend post-treatment opioid use in order to inform tailored treatments to buffer individuals against OUD relapse. Although a number of studies have assessed predictors of opioid use following treatment [7,40] few have investigated sex differences, and much of this research has utilized traditional linear regression methods with a circumscribed number of predictors [41–43]. To address this gap, we compared the valence of a large set of demographic, psychological and behavioral predictors on post-treatment opioid use using regularized Cox regression with LASSO, as well as rank order of importance using random survival forest models, with special consideration given to sex as a grouping variable. Overall, results from the current study indicate convergent and unique results across participant sex and across models.
Across participant sex, younger women and younger men had a higher risk of return to opioid use compared to older women and older men; however, based on HR size, age appeared to confer more risk for men. Previous work has shown that age is a key risk factor for substance use disorder relapse when sex is taken into consideration [44,45]. This may be because adolescents and young adults are less inclined to see their substance use as problematic, and/or a poor fit of traditional addiction treatment approaches [25] and limited availability of developmentally appropriate recovery supports. Other work has noted that motives for opioid use change over the life-course. For instance, youth are more likely to endorse substance-effect-related motives (e.g. to get high) [46,47], while pain motives for prescription opioid misuse increases with age [48]. The present findings suggest that youth is an important risk factor for both women and men, but this individual factor should be given more weight in treatment planning for men.
Conduct disorder symptoms were also a risk factor for both men and women in regularized Cox regression models, but appeared to confer an approximately 30% higher risk for men. This observation builds upon previous work linking conduct disorder to substance use disorder [49,50] and shows that, in addition to being more common in men [51], conduct disorder also confers more risk for return to opioid use following treatment. For example, prior studies have reported that men with OUD, compared to women, have more arrests and externalizing problems, spend a larger amount of time in jail and are more likely to be on parole [52].
Several unique risk factors were identified for men in regularized Cox regression models. Results revealed that men reporting the presence of multiple substance use disorders and more substance use problems had the greatest hazard for post-treatment opioid use. Others have suggested that men with OUD, compared to women, are more likely to report multiple substance use disorder, especially among men who report psychological health problems [22].
Women’s greatest risk factor for return to opioid use was withdrawal symptoms. This should be interpreted in conjunction with the other identified unique factors, including treatment resistance, greater prior treatment experience and PTSD diagnosis. While proper medical management of opioid withdrawal is always important in the context of OUD treatment, these results suggest that withdrawal may be particularly important to address to prevent OUD relapse in women. In contrast, whereas withdrawal symptoms did not emerge as a unique predictor for men. One potential explanation is the way in which withdrawal was measured. Prior work has noted greater heterogeneity in the association between withdrawal and return to opioid use when withdrawal is assessed using fear of withdrawal and craving components [53]. It is possible that men are more attuned to the psychological effects of withdrawal (fear and craving), whereas women are more attuned to withdrawal’s physiological effects.
One of the more compelling aspects of the current study is the convergent and divergent findings across the LASSO and random forest models. While contradictory results are typically viewed as problematic, results from the current study represent an opportunity to harness the strengths of distinct analytic approaches to begin to form a consensus about individual factors that contribute most to post-treatment opioid use. Notably, for women, the most important variable from the LASSO model—substance use problems—was not a significant predictor of opioid use in the random forest model. Further, the largest effect (withdrawal symptoms) landed fourth on the variables of importance list, behind age and criminal justice involvement. This does not necessarily indicate that one model is less accurate or provides more confidence than the other. On the contrary, these results reflect the complexity of determining risk for post-treatment opioid use, and future research would benefit from including multiple methods to explore both valence and importance of effects. For example, one of the more clinically useful aspects of random forest models is the ability to visualize prototypical survival curves using available data inputs. Figure 3 plots opioid abstinence survival by sex using three indices found to robustly predict earlier return to opioid use for women (age, criminal justice involvement and withdrawal) and men (age, conduct disorder, multiple substance use disorders). A logical extension of these models would be the development of algorithms that can generate an index of real-time risk for relapse for patients receiving treatment for OUD that leverages data derived from standard clinical measures administered through the course of OUD care.
Strengths and limitations
This study has several notable strengths, including its use of a machine learning approach that simultaneously tested multiple relevant variables. In addition, we tested variables’ multiple levels of analysis, including various aspects of participants’ social ecology. However, findings from this study should be interpreted in light of its limitations. First, while prior work has noted that self-report data on substance use concurs with results from biological data [54], participant recall bias and social desirability may influence self-reported data. Secondly, while our modeling approach included a large number of variables, we were unable to include several potentially relevant higher-level predictors, such as treatment site-specific risk, utilization of OUD medications, neighborhood risk, level of care (majority of participants were in an outpatient facility) and policy-level predictors. Future research may wish to include these factors in a machine learning context to determine if they emerge as important predictors over and above individual-level risk. Finally, our modeling approach is exploratory and does not infer causality. Future work should replicate findings using a priori confirmatory modeling approaches.
CONCLUSION
Converging evidence from the two modeling approaches utilized in this study suggests that for women, greater withdrawal, depression, conduct disorder symptoms, PTSD diagnosis and younger age appear to confer the most risk. For men, younger age, greater conduct disorder symptoms, multiple substance use disorders (SUDs), greater substance use-related problems and possibly criminal justice system involvement are the greatest risk factors for opioid use following OUD treatment. It is particularly notable that for men, risk loads much more heavily on substance use problem severity and personality factors, whereas for women, affective factors and comorbid psychological disorders confer the most risk, with younger age being a risk factor for both men and women [55]. Although further replication is needed to confirm the robustness of the risk indicators observed here, taken together these results highlight the need for tailored, sex-specific OUD treatments. Women would particularly benefit from treatments that aggressively address withdrawal symptoms and emphasize management of negative affect with appropriate medications and cognitive behavioral approaches. Conversely, men would probably benefit most from cognitive–behavioral and mutual-help interventions that directly target substance use behaviors and support development of prosocial behaviors. Future relapse prevention treatment research should explore ways to mitigate these key vulnerabilities. Ultimately, machine learning methods such as the one described here could be used to drive relapse risk classifier algorithms that can leverage patient data derived from standard survey measures delivered in the clinic to generate a running risk index for patients receiving treatment for OUD and other substance use disorders.
Supplementary Material
Acknowledgements
Manuscript preparation for this article was supported by National Institute of Alcohol Abuse and Alcoholism (NIAAA) grants K23AA027577-01A1 (Principle Investigator: D.E.) and R00AA026317 (Principle Investigator: E.R.D.). The views expressed in this article are those of the authors and do not necessarily reflect the positions or policies of the NIAAA.
Footnotes
Declaration of interests
None.
Supporting Information
Additional supporting information may be found online in the Supporting Information section at the end of the article.
Table S1 Interaction of top 5 most important variables by male and female random survival forests.
Table S2 Variables retained by each method and level of influence within final model.
References
- 1.Degenhardt L, Charlson F, Mathers B, Hall WD, Flaxman AD, Johns N, et al. The global epidemiology and burden of opioid dependence: results from the Global Burden of Disease 2010 study. Addiction 2014; 109: 1320–33. [DOI] [PubMed] [Google Scholar]
- 2.Florence CS, Zhou C, Luo F, Xu L The economic burden of prescription opioid overdose, abuse, and dependence in the United States, 2013. Med Care 2016; 54: 901–6. [DOI] [PMC free article] [PubMed] [Google Scholar]
- 3.2017 Drug Overdose Death Rates. CDC Injury Center. Available at: https://www.cdc.gov/drugoverdose/data/state-deaths/drug-overdose-death-2017.html (Accessed 8 January 2020).
- 4.Cornelius JR, Maisto SA, Pollock NK, Martin CS, Salloum IM, Lynch KG, et al. Rapid relapse generally follows treatment for substance use disorders among adolescents. Addict Behav 2003; 28: 381–6. [DOI] [PubMed] [Google Scholar]
- 5.Coviello DM, Zanis DA, Wesnoski SA, Lynch KG, Drapkin M Characteristics and 9-month outcomes of discharged methadone maintenance clients. J Subst Abuse Treat 2011; 40: 165–74. [DOI] [PMC free article] [PubMed] [Google Scholar]
- 6.Gossop M, Marsden J, Stewart D, Treacy S Outcomes after methadone maintenance and methadone reduction treatments: two-year follow-up results from the National Treatment Outcome Research Study. Drug Alcohol Depend 2001; 62: 255–64. [DOI] [PubMed] [Google Scholar]
- 7.Gossop M, Stewart D, Browne N, Marsden J Factors associated with abstinence, lapse or relapse to heroin use after residential treatment: protective effect of coping responses. Addiction 2002; 97: 1259–67. [DOI] [PubMed] [Google Scholar]
- 8.Senbanjo R, Wolff K, Marshall EJ, Strang J Persistence of heroin use despite methadone treatment: poor coping self-efficacy predicts continued heroin use. Drug Alcohol Rev 2009; 28: 608–15. [DOI] [PubMed] [Google Scholar]
- 9.Gogineni A, Stein MD, Friedmann P D Social relationships and intravenous drug use among methadone maintenance patients. Drug Alcohol Depend 2001; 64: 47–53. [DOI] [PubMed] [Google Scholar]
- 10.Lions C, Carrieri MP, Michel L, Mora M, Marcellin F, Morel A, et al. Predictors of non-prescribed opioid use after one year of methadone treatment: an attributable-risk approach (ANRS–Methaville trial). Drug Alcohol Depend 2014; 135: 1–8. [DOI] [PubMed] [Google Scholar]
- 11.Chalana H, Kundal T, Gupta V, Malhari AS Predictors of relapse after inpatient opioid detoxification during 1-year follow-up. J Addict 2016; 2016: 1–7. [DOI] [PMC free article] [PubMed] [Google Scholar]
- 12.Tkacz J, Severt J, Cacciola J, Ruetsch C Compliance with buprenorphine medication-assisted treatment and relapse to opioid use. Am J Addict 2012; 21: 55–62. [DOI] [PubMed] [Google Scholar]
- 13.Conroy E, Degenhardt L, Mattick RP, Nelson EC Child maltreatment as a risk factor for opioid dependence: comparison of family characteristics and type and severity of child maltreatment with a matched control group. Child Abuse Negl 2009; 33: 343–52. [DOI] [PMC free article] [PubMed] [Google Scholar]
- 14.Wu LT, Woody GE, Yang C, Blazer DG Subtypes of non-medical opioid users: results from the national epidemiologic survey on alcohol and related conditions. Drug Alcohol Depend 2010; 112: 69–80. [DOI] [PMC free article] [PubMed] [Google Scholar]
- 15.Vigna-Taglianti FD, Burroni P, Mathis F, Versino E, Beccaria F, Rotelli M, et al. Gender differences in heroin addiction and treatment: results from the VEdeTTE cohort. Subst Use Misuse 2016; 51: 295–309. [DOI] [PubMed] [Google Scholar]
- 16.Hernandez-Avila CA, Rounsaville BJ, Kranzler HR Opioid-, cannabis- and alcohol-dependent women show more rapid progression to substance abuse treatment. Drug Alcohol Depend 2004; 74: 265–72. [DOI] [PubMed] [Google Scholar]
- 17.Back SE, Payne RL, Wahlquist AH, Carter RE, Stroud Z, Haynes L, et al. Comparative profiles of men and women with opioid dependence: results from a national multisite effectiveness trial. Am J Drug Alcohol Abuse 2011; 37: 313–23. [DOI] [PMC free article] [PubMed] [Google Scholar]
- 18.McCrady BS, Epstein EE, Cook S, Jensen N, Hildebrandt T A randomized trial of individual and couple behavioral alcohol treatment for women. J Consult Clin Psychol 2009; 77: 243–56. [DOI] [PMC free article] [PubMed] [Google Scholar]
- 19.Back SE, Lawson KM, Singleton LM, Brady KT Characteristics and correlates of men and women with prescription opioid dependence. Addict Behav 2011; 36: 829–34. [DOI] [PMC free article] [PubMed] [Google Scholar]
- 20.Grella CE, Karno MP, Warda US, Niv N, Moore AA Gender and comorbidity among individuals with opioid use disorders in the NESARC study. Addict Behav 2009; 34: 498–504. [DOI] [PMC free article] [PubMed] [Google Scholar]
- 21.Tetrault JM, Desai RA, Becker WC, Fiellin DA, Concato J, Sullivan LE Gender and non-medical use of prescription opioids: results from a national US survey. Addiction 2008; 103: 258–68. [DOI] [PubMed] [Google Scholar]
- 22.Shand FL, Degenhardt L, Slade T, Nelson EC Sex differences amongst dependent heroin users: histories, clinical characteristics and predictors of other substance dependence. Addict Behav 2011; 36: 27–36. [DOI] [PMC free article] [PubMed] [Google Scholar]
- 23.Palis H, Marchand K, Guh D, Brissette S, Lock K, MacDonald S, et al. Men’s and women’s response to treatment and perceptions of outcomes in a randomized controlled trial of injectable opioid assisted treatment for severe opioid use disorder. Subst Abuse Treat Prev Policy 2017; 12: 25. [DOI] [PMC free article] [PubMed] [Google Scholar]
- 24.McHugh RK, DeVito EE, Dodd D, Carroll KM, Potter JS, Greenfield SF Gender differences in a clinical trial for prescription opioid dependence. J Subst Abuse Treat 2013; 45: 38–43. [DOI] [PMC free article] [PubMed] [Google Scholar]
- 25.Davis JP, Prindle JJ, Eddie D, Pedersen ER, Dumas TM, Christie NC Addressing the opioid epidemic with behavioral interventions for adolescents and young adults: a quasi-experimental design. J Consult Clin Psychol 2019; 87: 941–51. [DOI] [PubMed] [Google Scholar]
- 26.Coombes KR, Qiu YH, Yoo SY, Zhang N, Bernstam EV, Kornblau SM Survival prediction in high dimensional datasets—comparative evaluation of Lasso regularization and random survival forests. Blood 2013; 122: 1728. [Google Scholar]
- 27.Hassan SS, Farhan M, Mangayil R, Huttunen H, Aho T Bioprocess data mining using regularized regression and random forests. BMC Syst Biol 2013; 7: S5. [DOI] [PMC free article] [PubMed] [Google Scholar]
- 28.Dennis ML, Titus JC, White MK, Unsicker JI, Hodgkins D Global Appraisal of Individual Needs: Administration Guide for the GAIN and Related Measures. Bloomington, IL: Chestnut Health Systems; 2003. [Google Scholar]
- 29.American Psychiatric Association American Psychiatric Association: Diagnostic and Statistical Manual of Mental Disorders, 4th edition, text revision. Philadelphia, PA: American Psychiatric Association; 2000. [Google Scholar]
- 30.Tibshirani R Regression shrinkage and selection via the Lasso. J R Stat Soc Ser B 1996; 58: 267–88. [Google Scholar]
- 31.le Cessie S, van Houwelingen JC Ridge estimators in logistic regression. Appl Stat 1992; 10.2307/2347628 [DOI] [Google Scholar]
- 32.Zou H, Hastie T Regularization and variable selection via the elastic net. J R Stat Soc Ser B-Stat Methodol 2005; 67: 301. [Google Scholar]
- 33.Goeman JJ L1 penalized estimation in the Cox proportional hazards model. Biomet J 2010; 10.1002/bimj.200900028 [DOI] [PubMed] [Google Scholar]
- 34.Ishwaran H, Kogalur UB, Chen X, Minn AJ Random survival forests for high-dimensional data. Stat Anal Data Min 2011; 4: 115–32. [Google Scholar]
- 35.Breiman L Random forests. Mach Learn 2001; 45: 5–32. [Google Scholar]
- 36.Segal MR Regression trees for censored data. Biometrics 1988; 43: 35. [Google Scholar]
- 37.Simon N, Friedman J, Hastie T, Tibshirani R Regularization paths for Cox’ s proportional hazards model via coordinate descent. J Stat Softw 2011; 39: 1–13. [DOI] [PMC free article] [PubMed] [Google Scholar]
- 38.Mcdermeit M, Funk R, Dennis M LI Analysis Training Series Data Cleaning and Replacement of Missing Values. Available at: www.gaincc.org (accessed 2 November 2020).
- 39.Ishwaran H Variable importance in binary regression trees and forests. Electron J Stat 2007; 1: 519–37. [Google Scholar]
- 40.Fatseas M, Denis C, Massida Z, Verger M, Franques-Rénéric P, Auriacombe M Cue-induced reactivity, cortisol response and substance use outcome in treated heroin dependent individuals. Biol Psychiatry 2011; 70: 720–7. [DOI] [PubMed] [Google Scholar]
- 41.Teesson M, Ross J, Darke S, Lynskey M, Ali R, Ritter A, et al. One year outcomes for heroin dependence: findings from the Australian treatment outcome study (ATOS). Drug Alcohol Depend 2006; 83: 174–80. [DOI] [PubMed] [Google Scholar]
- 42.Back SE, Payne RL, Simpson AN, Brady KT Gender and prescription opioids: findings from the National Survey on drug use and health. Addict Behav 2010; 35: 1001–7. [DOI] [PMC free article] [PubMed] [Google Scholar]
- 43.Levine AR, Lundahl LH, Ledgerwood DM, Lisieski M, Rhodes GL, Greenwald MK Gender-specific predictors of retention and opioid abstinence during methadone maintenance treatment. J Subst Abuse Treat 2015; 54: 37–43. [DOI] [PubMed] [Google Scholar]
- 44.Chassin L, Flora DB, King KM Trajectories of alcohol and drug use and dependence from adolescence to adulthood: the effects of familial alcoholism and personality. J Abnorm Psychol 2004; 113: 483–98. [DOI] [PubMed] [Google Scholar]
- 45.Smyth BP, Barry J, Keenan E, Ducray K Lapse and relapse following inpatient treatment of opiate dependence. Ir Med J 2010; 103: 176–9. [PubMed] [Google Scholar]
- 46.Han B, Compton WM, Blanco C, Jones CM Correlates of prescription opioid use, misuse, use disorders, and motivations for misuse among US adults. J Clin Psychiatry 2018; 79; 10.4088/JCP.17m11973 [DOI] [PubMed] [Google Scholar]
- 47.McCabe SE, West BT, Boyd CJ Motives for medical misuse of prescription opioids among adolescents. J Pain 2013; 14: 1208–16. [DOI] [PMC free article] [PubMed] [Google Scholar]
- 48.Schepis TS, Wastila L, Ammerman B, McCabe VV, McCabe SE Prescription opioid misuse motives in US older adults. Pain Med 2019; 21: 2237–43. [DOI] [PMC free article] [PubMed] [Google Scholar]
- 49.Schubiner H, Tzelepis A, Milberger S, Lockhart N, Kruger M, Kelley BJ, et al. Prevalence of attention-deficit/hyperactivity disorder and conduct disorder among substance abusers. J Clin Psychiatry 2000; 61: 244–51. [DOI] [PubMed] [Google Scholar]
- 50.Rosenström T, Torvik FA, Ystrom E, Czajkowski NO, Gillespie NA, Aggen SH, et al. Prediction of alcohol use disorder using personality disorder traits: a twin study. Addiction 2018; 113: 15–24. [DOI] [PMC free article] [PubMed] [Google Scholar]
- 51.Nock MK, Kazdin AE, Hiripi E, Kessler RC Prevalence, subtypes, and correlates of DSM-IV conduct disorder in the National Comorbidity Survey Replication. Psychol Med 2006; 36: 699–710. [DOI] [PMC free article] [PubMed] [Google Scholar]
- 52.Hölscher E, Reissner V, di Furia L., Room R, Schinfano E, Stohler R, et al. Differences between men and women in the course of opiate dependence: is there a telescoping effect? Eur Arch Psychiatry Clin Neurosci 2010; 260: 235–41. [DOI] [PubMed] [Google Scholar]
- 53.Baxley C, Weinstock J, Lustman PJ, Garner AA The influence of anxiety sensitivity on opioid use disorder treatment outcomes. Exp Clin Psychopharmacol 2019; 27: 64–77. [DOI] [PubMed] [Google Scholar]
- 54.Wilcox CE, Bogenschutz MP, Nakazawa M, Woody G Concordance between self-report and urine drug screen data in adolescent opioid dependent clinical trial participants. Addict Behav 2013; 38: 2568–74. [DOI] [PMC free article] [PubMed] [Google Scholar]
- 55.Kelly JF, Bergman BG, Fallah-Sohy N Mechanisms of behavior change in 12-step approaches to recovery in young adults. Curr Addict Reports 2018; 5: 134–45. [DOI] [PMC free article] [PubMed] [Google Scholar]
Associated Data
This section collects any data citations, data availability statements, or supplementary materials included in this article.