Fig. 1.
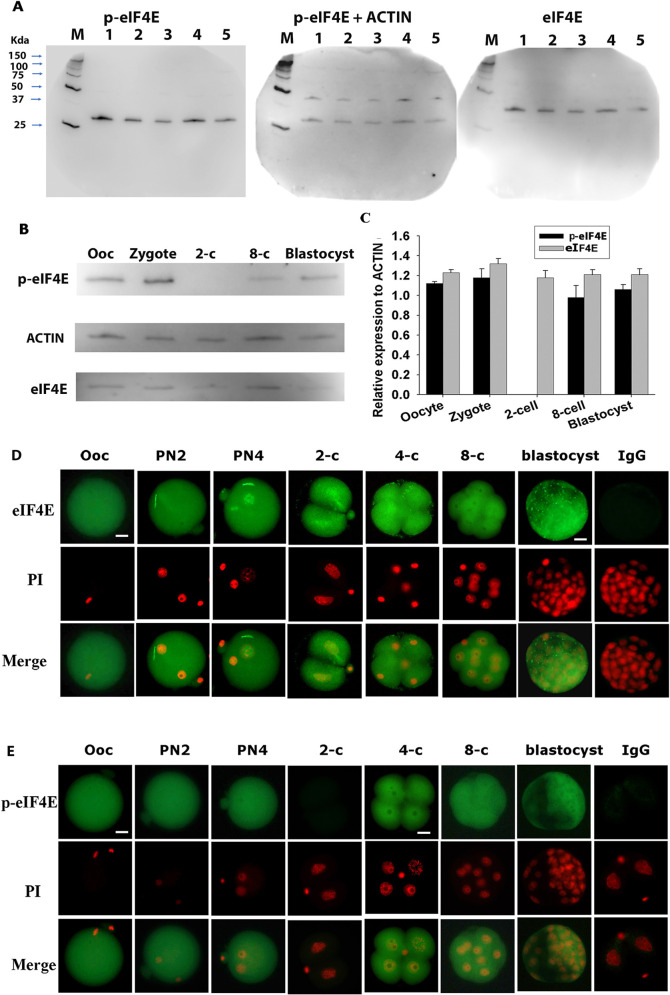
eIF4E and p-eIF4E in mouse gametes and preimplantation embryos. (A) Western blot analyses of p-eIF4E, actin and eIF4E. Lanes 1-5 indicate independent repeats of 50 zygotes for each lane. Images are representative gels of four replicates. (B) Representative images of three replicates of western blot analyses of p-eIF4E, eIF4E and actin in oocytes and preimplantation embryos. (C) Relative fold changes in p-eIF4E and eIF4E relative to actin in oocytes and preimplantation embryos. Each sample contained 50 oocytes or embryos. Mean±s.e.m. of the molecular weights of eIF4E, p-eIF4E and actin were 32.98±0.13, 28.05±0.16 and 40.82±0.5 kDa, respectively, determined by comparison with a prestained protein ladder. (D,E) Whole sections of oocytes and preimplantation embryos epifluorescent-stained for eIF4E (D) and p-eIF4E (E) and counter-stained with propidium iodine (PI). Images are representative of more than 30 embryos at each developmental stage. Negative controls were stained with non-reactive IgG and generated no signal at any developmental stage. Scale bars: 10 µm. M, molecular weight standards.

