Abstract
Background
Clear cell renal cell carcinoma (ccRCC), derived from renal tubular epithelial cells, is the most common malignant tumor of the kidney. The study of key genes related to the pathogenesis of ccRCC has become important for gene target therapy.
Methods
Bioinformatics analysis of The Cancer Genome Atlas (TCGA), the NCBI Gene Expression Omnibus (GEO) database, USUC Xena database, cBioPortal for Cancer Genomics, and MethSurv were performed to examine the aberrant genetic pattern and prognostic significance of leucine-rich repeat kinase 2 (LRRK2) expression and its relationship to clinical parameters. Immunohistochemistry and Western blot were performed to verify LRRK2 expression. The regulation of ccRCC tumor cell lines proliferation by LRRK2 was examined by CCK8 assay.
Results
Bioinformatics analysis showed that LRRK2 expression was up-regulated and largely correlated with DNA methylation in ccRCC. The up-regulation of LRRK2 was confirmed in ccRCC tissue immunohistochemically and by protein analysis. The level of expression was related to gender, pathological grade, stage, and metastatic status of ccRCC patients. Meanwhile, Kaplan–Meier analysis showed that high expression of LRRK2 correlates to a better prognosis; knockdown of LRRK2 expression attenuated the proliferation ability of ccRCC tumor cell lines; protein–protein interaction network analysis showed that LRRK2 interacts with HIF1A and EGFR.
Conclusion
We found that LRRK2 may play an important role in the tumorigenesis and progression of ccRCC. Our findings provided a potential predictor and therapeutic target in ccRCC.
Supplementary Information
The online version contains supplementary material available at 10.1186/s12935-021-02047-y.
Keywords: LRRK2, Clear cell renal cell carcinoma, Bioinformatic analysis, Prognosis biomarker, HIF1A, EGFR, Tumorigenesis, Pathology
Background
Renal cell carcinoma (RCC) represents a highly heterogeneous group of tumor, with clear cell renal cell carcinoma (ccRCC) being the most common histologic subtype [1]. Other subtypes include papillary RCC, chromophobe RCC, clear cell papillary RCC, and several other rare types. ccRCC is believed to derive from the proximal convoluted renal tubules. Its incidence increases with age, so it is more prevalent in the elderly, more common in male patients [2]. The common clinical manifestations of ccRCC are hematuria, pain, and renal mass. Histologically, ccRCC is characterized by high glycogen and lipid-rich cytoplasm. There is a genetic predisposition or hereditary factor associated with its tumorigenesis, with smoking, obesity, hypertension, chronic kidney disease, and other environmental factors being contributory [3, 4]. Although molecular genetic studies have shown that mutations of several genes are associated with the pathogenesis of ccRCC, including von Hippel-Lindau (VHL), set domain-containing 2 (SETD2), BRCA1-associated protein-1 (BAP1), polybromo-1 (PBRM1), and lysine-specific histone demethylase 5C (KDM5C) [5–8], additional genes are being identified to be related to RCC from cancer genomic studies, which may have prognostic, predictive and therapeutic relevance [9]. It has been shown that loss of the short arm of chromosome 3 is closely related to ccRCC, and the central molecular signature is the inactivation of the tumor suppressor VHL gene [5, 10]. Also, Myo-inositol monophosphatase 2 (IMPA2) downregulation is correlated with poor prognosis for ccRCC, and miR-25-mediated IMPA2 downregulation may be a potential therapeutic target for preventing the progression and metastatic of ccRCC [11].
Considering the high morbidity and mortality associated with ccRCC, it is essential to identify more molecular biomarkers that have diagnostic and prognostic value. In the present study, we aim to explore the expression of differential genes in renal cell carcinoma by analyzing data from independent public databases, and verifying the putative candidate by analyzing tumor and non-tumor control tissues. Our results show that leucine-rich repeat kinase 2 (LRRK2) is a prognostic biomarker for ccRCC.
Materials and methods
Data collection and bioinformatic analysis
All relevant data are available from the public domain databases. The RNA-seq FPKM data and corresponding clinicopathological data of 611 samples with renal clear cell carcinoma were obtained from The Cancer Genome Atlas databases (TCGA, https://portal.gdc.cancer.gov/). All of the 191 ccRCC sample series matrix files were downloaded from the NCBI Gene Expression Omnibus databases (GEO, https://www.ncbi.nlm.nih.gov/geo/), including 2 gene microarray datasets (GSE53757 and GSE71963). The background correction and normalization were performed using the Robust Multi-array Average (RMA) algorithm in R package “Affy”. Online genetic variation tool predictors USUC Xena (http://xena.ucsc.edu/) and cBioPortal for Cancer Genomics (http://www.cbioportal.org/) based on TCGA cohorts were used to analyze the RNA-seq data, somatic mutations, copy number alteration, and 450 K methylation array of LRRK2 in ccRCC. The survival analysis of DNA methylation of LRRK2 was carried out in MethSurv (https://biit.cs.ut.ee/methsurv/).
Screening for hub genes
For the two GEO datasets, the R package “limma” was applied to identify differentially expressed genes (DEGs). The R package “EdgeR” was used to screen out DEGs based on the TCGA RNA-seq FPKM data. All DEGs were filtered by setting for p < 0.05 and |logFC| > 1 as cut-off criteria. The adjacency matrix was converted to topological overlap matrix (TOM) dissimilarity matrix (1-TOM) by “tomlikeity” arithmetic, and a scale-free topology of gene co-expression network was constructed through the R package “WGCNA” based on genes from the GSE71963 dataset. Correlation between the module eigengenes (MEs) and the clinical trait was calculated by Pearson’s correlation analysis to identify clinically significant modules. Subsequently, hub genes were considered those highly correlated with clinical traits as well as both the DEGs of GEO and TCGA datasets.
Prognostic analysis was performed by using the R package “survival” based on TCGA-KIRC clinicopathological data of 539 tumor and 72 normal samples. A univariate Cox regression analysis was used to evaluate the association between the hub gene expression and overall survival; prognostic-related genes were defined with a p < 0.001 cutoff. STRING (https://string-db.org/) was used to construct the protein–protein interaction (PPI) networks related to prognostically-related genes expressed with the retrieval condition of Organism: Homo sapiens, and a minimum required interaction score of medium confidence (0.400). Subsequently, a simple tabular text exported from STRING was input to the Cytoscape v3.7.1 to obtain the top10 nodes with the “betweenness” ranking method performed by cytoHubba, which were finally defined as key hub genes.
Gene ontology (GO) terms and KEGG pathways
To further investigate the functional annotation and pathways of the prognostic-related genes, the R package “clusterProfiler” was adopted to carry out GO terms and KEGG pathway analyses, identified based on a threshold of adjusted p < 0.05.
Validations through other online databases
An extensive search in PubMed about the key hub genes and ccRCC was conducted to exclude genes that had been previously reported. The remaining candidate genes were validated with the Human Protein Altas (HPA, https://www.proteinatlas.org/) by comparing the expression specificity and expression levels.
Gene set enrichment analysis (GSEA)
Gene set enrichment analysis (GSEA) version 3.0 was used to predict the LRRK2 expression enriched pathways in ccRCC using the TCGA-KIRC datasets. ccRCC samples were divided into high and low expression level groups according to the median expression of LRRK2. The GeneChip matrix was analyzed after normalization and the number of random combinations was set to 1000. The functional annotation dataset c2.cp.kegg.v7.1.symbols.gmt was downloaded from the molecular signatures database (MsigDB, https://www.gsea-msigdb.org/gsea/msigdb) as a reference.
Cell lines and culture
The human ccRCC cell line Caki-1 and human embryonic kidney cell line HEK-293T were purchased from the Cell Bank of the Chinese Academy of Sciences (Shanghai, China), the HK2, ACHN, A498 and 786-O cell lines were purchased from Procell Life Science & Technology Co., Ltd (Wuhan, China). These cell lines were authenticated via STR profiling and no mycoplasma contamination. The cell lines were incubated in McCoy’s 5A Medium (Gibco), Dulbecco’s modified Eagle’s medium (HyClone), RPMI 1640 medium (Hyclone) and minimal essential medium (MEM, Gibco), respectively, supplemented with 10% fetal bovine serum (Gibco) and 1% penicillin–streptomycin (Gibco) at 37 °C in 5% CO2 humidified atmosphere.
Western blotting
Cells and tissues were lysed in lysis buffer supplemented with proteinase inhibitors. Protein samples were separated on SDS-PAGE and transferred to the PVDF membrane (Millipore, USA). The membranes were blocked with 5% non-fat milk for 1 h and incubated with the primary LRRK2 antibody (1:10,000, rabbit, ab133474, Abcam, USA) or GAPDH antibody (rabbit, 5174T, CST, USA) at 4 °C overnight, followed by washing and incubation with HRP-conjugated goat anti-rabbit antibody (1:40,000, ab205718, Abcam, USA) for 60 min at room temperature. The ECL western blotting detection kit (WBKLS0100, Millipore, USA) was used to detect the resultant bands. All experiments were performed in triplicate at least.
RNA interference and cell growth assay
The lentiviral short hairpin RNA (shRNA) sequence targeting LRRK2 was purchased from Genechem Co., Ltd (Shanghai, China). Stable knockdown lines in A498 and 786-O cells were created by lentiviral particles containing shRNAs. 48 h post-infection, cells were passaged and selected with 2.0 μg/mL puromycin, and the stable lines were routinely used for all assays. Cell proliferation ability was measured by the cell count kit-8 (BS350A, Biosharp, China). Cells were seeded at a density of 5 × 10³ cells per well in a 96-well plate. After 24 h culture, 10 μL CCK8 solution was added to each well, and plate incubated for additional 4 h before measuring the absorbance at 450 nm wavelength using a microplate reader.
Immunohistochemical staining
Formalin-fixed paraffin-embedded (FFPE) ccRCC and adjacent non-tumor tissues were obtained from our pathology archives, from September 2019 to August 2020 (detailed information in Additional file 1: Table S1). Sections in 5-μm-thickness were prepared from each tissue block for immunohistochemistry (IHC). Briefly, the paraffin sections were dewaxed and rehydrate for antigen retrieval and following elimination of the endogenous peroxidase activity, and then were blocked in 5% goat serum fluid for 1 h at room temperature. Next, the sections were incubated with primary LRRK2 antibody (1:500, rabbit, ab133474, Abcam, USA) at 4 °C overnight followed by visualization with the Dako EnVision DAB (Dako Diagnostics AG, Switzerland). For LRRK2 protein, staining localized in the cytoplasm is considered positive. Images were captured using an Olympus BX51 microscope equipped with a DP74 digital camera. Image-Pro Plus software (version 6.0) was used to assess the area and density of the stained regions, and the integrated optical density (IOD) value was obtained. The mean densitometry of the digital image (magnification, 20×) was designated as representative LRRK2 staining intensity. The signal density of the tissue areas from five randomly selected fields was counted in a blinded manner and subjected to statistical analysis.
Statistical analysis
Bioinformatic statistics analyses were carried out by using R v 4.0.2. Wilcox test, Wilcoxon rank-sum test, and logistic regression analysis were used to examine the correlation between LRRK2 expression level and clinicopathological parameters of the TCGA ccRCC samples. Kaplan–Meier survival analysis and log-rank test were performed to draw the survival curve to evaluate the effect of LRRK2 on overall survival, with a 95% confidence interval and logarithmic rank p-value. Univariate and multivariate Cox regression analyses were applied to the comparison between LRRK2 expression and other clinicopathological parameters (age, gender, grade, and TNM stage) and to predict the independent prognostic-related hazard factors. Western blotting data were analyzed using the Image J software. Experimental statistics analyses were performed using Graphpad prism 8.
Results
Screening of differentially expressed genes in ccRCC
Identification of LRRK2 in ccRCC
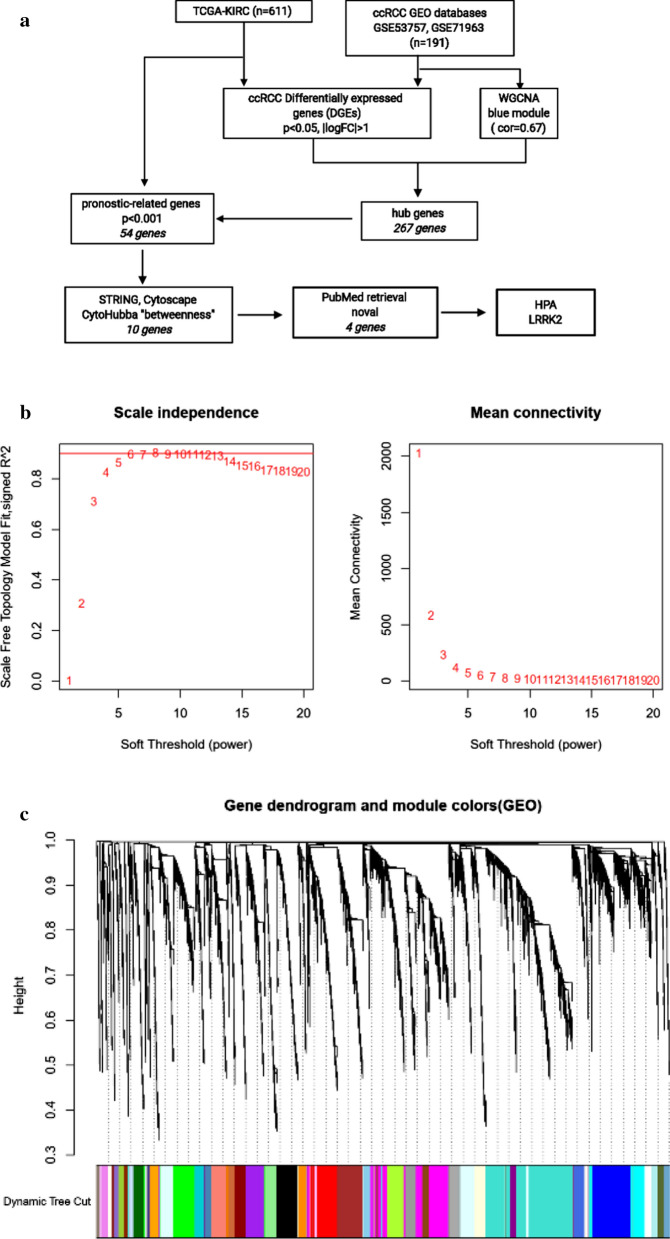
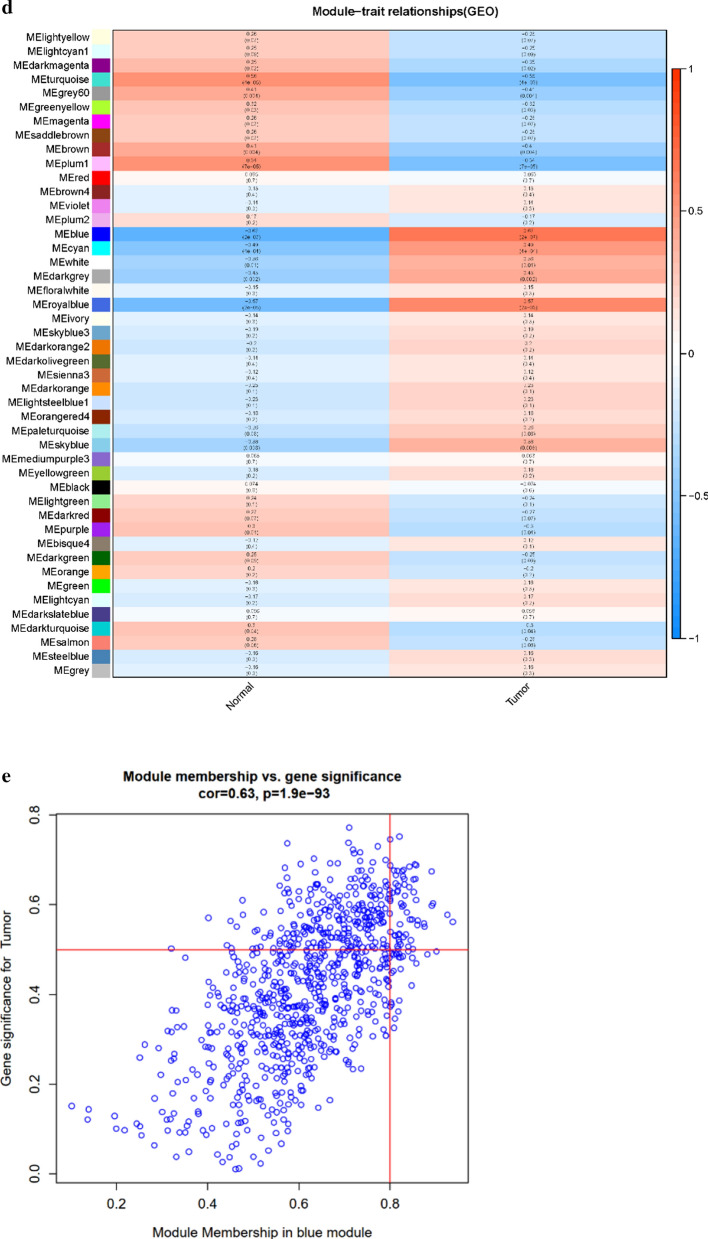
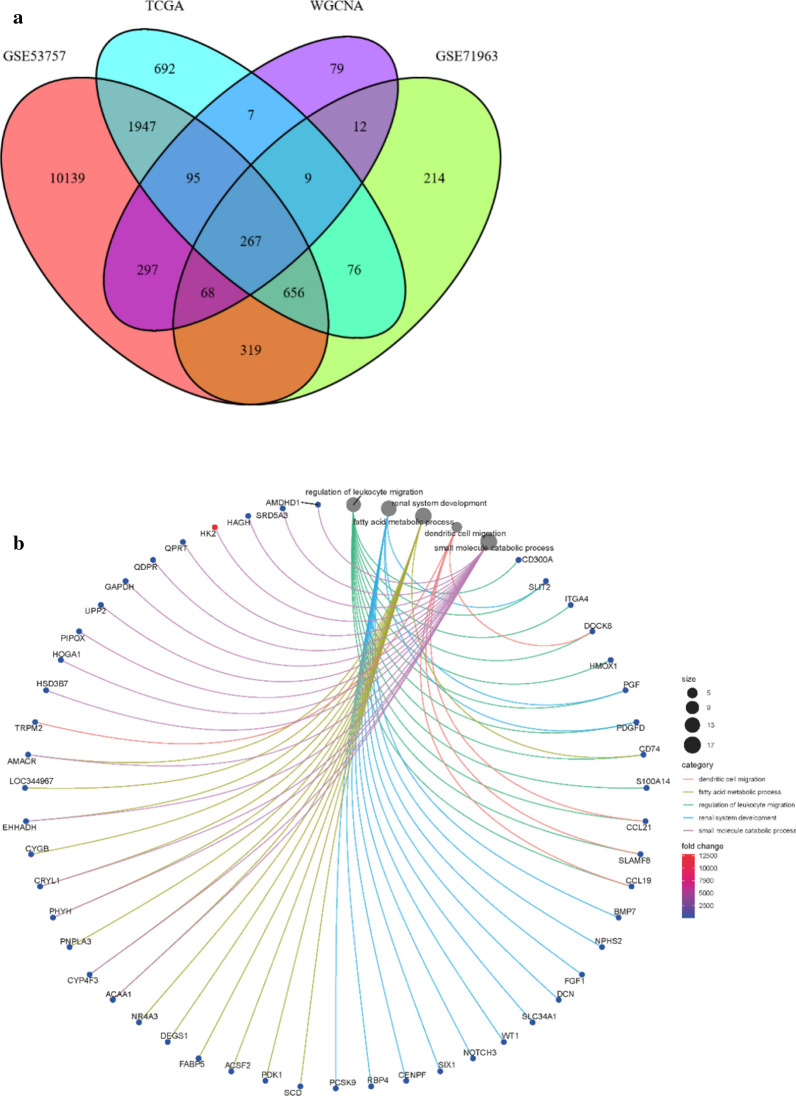
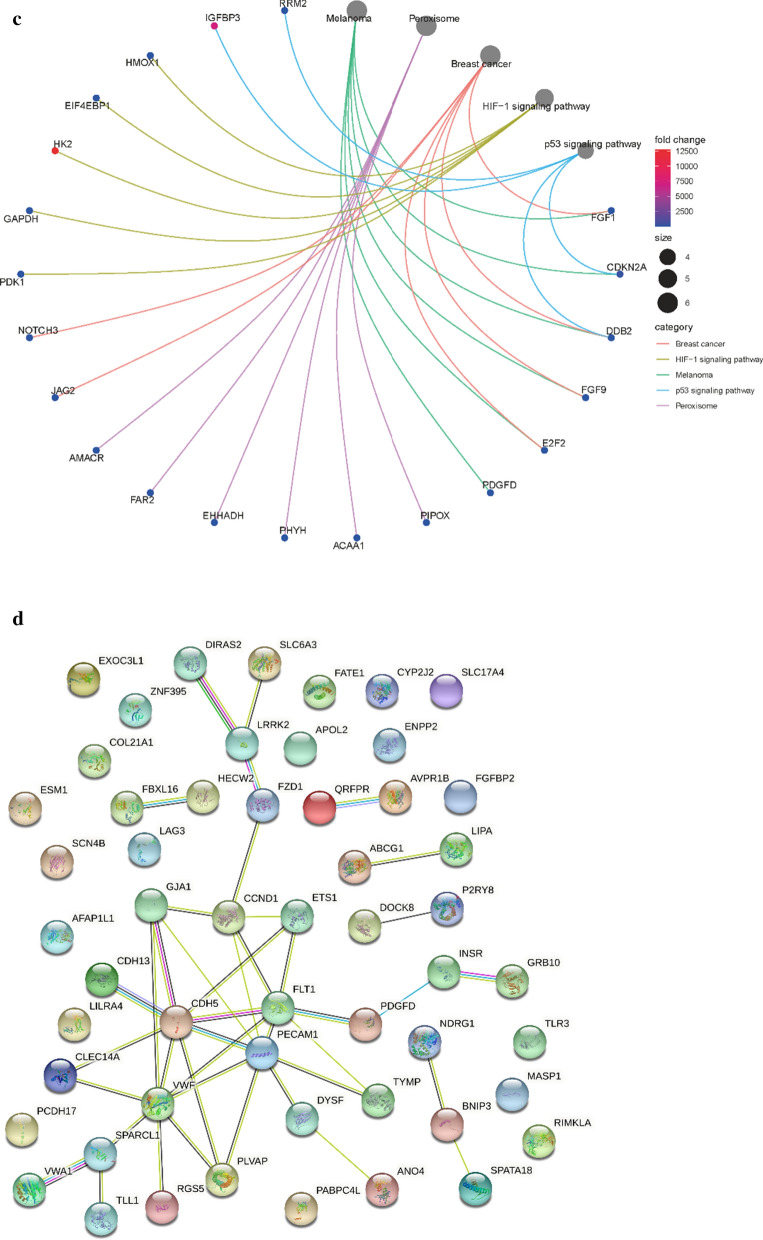
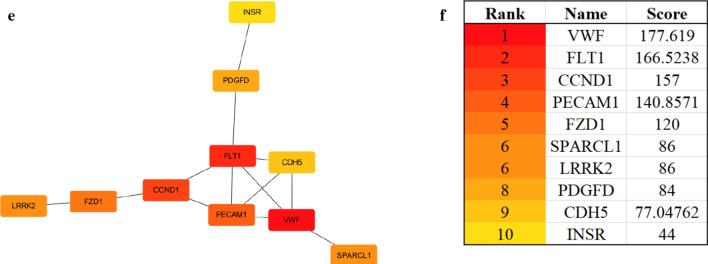
Bioinformatic approaches as described above were used to identify the target genes; the workflow of analysis is shown in Fig. 1a. First, DEGs of ccRCC were obtained from the two GEO datasets and TCGA-KIRC, with a total of 929 genes. Second, a soft threshold parameter β = 20 was selected (Fig. 1b) and a hierarchical clustering tree constructed by the correlation co-efficiency between genes from GSE71963, and different branches of clustering tree representing different gene modules in various colors (Fig. 1c). Based on the weighted correlation coefficient of genes, the genes were classified according to the expression patterns, and genes with similar patterns were classified as a module. In this way, we detected genes in the blue module exhibiting the most positive correlation with the tumor (Fig. 1d, e). Finally, with the intersection of the above- predicted genes, 267 hub genes were included in genes of both the blue module by WGCNA and DEGs in ccRCC (Fig. 2a). To further explore the pathway functional enrichment of the identified hub genes, we performed GO terms and KEGG pathways analyses. Based on GO annotations, functions of the hub genes were related to dendritic cell migration, fatty acid metabolic process, regulation of leukocyte migration, renal system development, and small molecule catabolic process. In addition, the top KEGG pathway enrichment included breast cancer, HIF-1 signaling pathway, melanoma, p53 signaling pathway, and peroxisomes (Fig. 2b, c). For the 267 hub genes, univariate regression analysis was performed with a p-value cut-off of 0.001, and 54 genes were filtered out as prognostic-related genes, which were mapped to the PPI network revealing 54 nodes and 42 edges (Fig. 2d). The top10 nodes were found based on the node degree calculated by cytoHubba in Cytoscape as the key hub genes (Fig. 2e, f).
Fig. 1.
Modules of co-expressed genes in ccRCC. a Procedure for the selection and validation of the prognosis biomarkers in ccRCC; b identification of soft threshold power (β) for the scale-free network by using the “pickSoftThreshold” function; c cluster dendrogram of genes based on topological overlap matrix (TOM); d identification of modules associated with clinical traits; e scatter plot of module gene significance (GS)/module membership (MM) in the blue module
Fig. 2.
The screening procedures for key hub genes. a Venn diagram among TCGA DEGs, GEO DEGs, and genes from the blue module by WGCNA; b, c gene ontology terms and functional pathways of KEGG for identified intersected genes; d STRING analysis of prognostic-related genes; e top 10 nodes in STRING network ranked by “Betweenness” arithmetic; f the rank of 10 nodes. TGCA The Cancer Genome Atlas, DEGs differentially expressed genes, GEO Gene Expression Omnibus, WGCNA weighted gene co-expression network analysis, KEGG Kyoto Encyclopedia of Genes and Genomes, STRING search tool for recurring instances of neighboring genes
Subsequently, PubMed searches for these 10 key hub genes and ccRCC allow us to exclude 8 genes, namely VWF, FLT1, CCND1, PECAM1, SPARCL1, FZD1, CDH5, and INSR, as already known to be associated with ccRCC. The remaining 2 genes, LRRK2 and PDGFD were considered as candidate novel prognosis-related differentially expressed genes for ccRCC. Validation of both LRRK2 and PDGFD were performed in the HPA database for expression specificity and expression levels. The LRRK2 expression is higher than PDGFD. Therefore, LRRK2 was chosen as a target gene for further study.
LRRK2 overexpression and genomic alteration in ccRCC
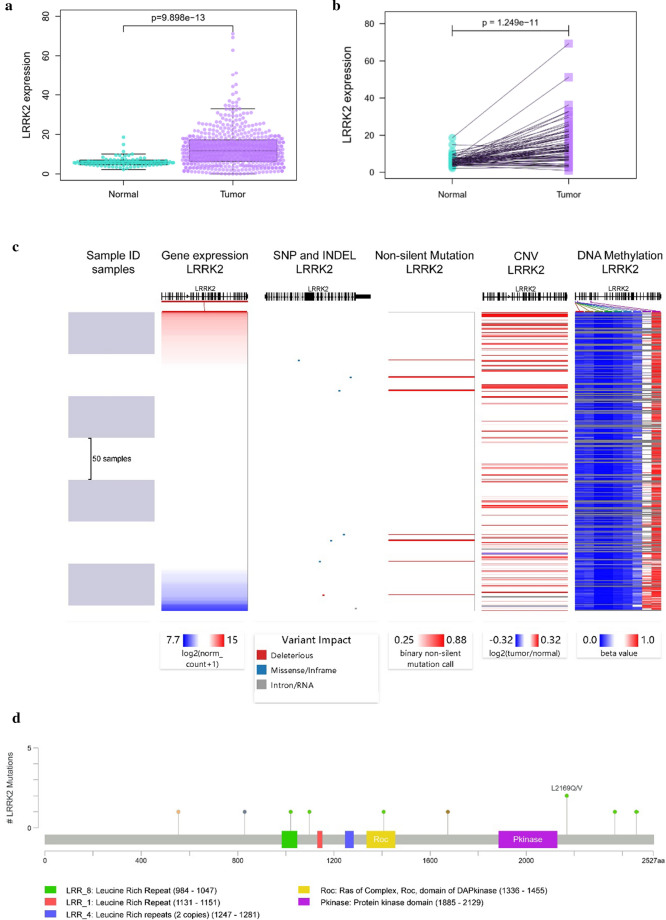
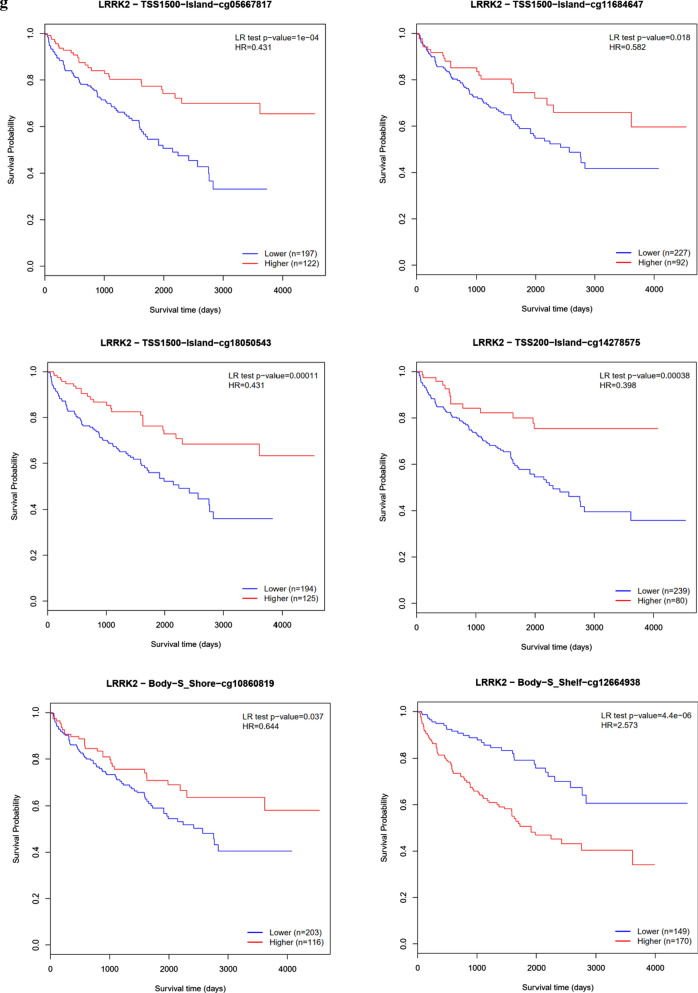
As described above, analyses from the TCGA RNA-seq data revealed LRRK2 to be significantly overexpressed in ccRCC as compared to that of non-tumor controls (p < 0.001). An example of the differentially expressed levels is shown in Fig. 3a, b. For further understanding the potential mechanisms of LRRK2 dysregulation, we examined for somatic mutations, including single nucleotide polymorphisms (SNPs), insertion–deletion (INDEL), copy number variation (CNV), and DNA methylation. Based on the genomic data of 260 ccRCC patients in the UCSC Xena database, we found that expression of LRRK2 is not significantly related to somatic mutations or CNV, but related to DNA methylation (Fig. 3c). With the cBioPortal, we conducted a more in-depth genomic analysis of 537 ccRCC patients for mutation sites of LRRK2 in tumor tissues (Fig. 3d) and found that LRRK2 tends to be slightly amplified (Fig. 3e), and confirmed that there is a negative correlation between LRRK2 expression and DNA methylation (Fig. 3f). According to the MethSurv, we found that the following six LRRK2 methylation sites are highly correlated with the survival of KIRC patients: cg05667817, cg11684647, cg18050543, cg14278575, cg10860819, and cg12664938. Therefore, DNA methylation is most likely involved in the aberrant expression of LRRK2 (Fig. 3g).
Fig. 3.
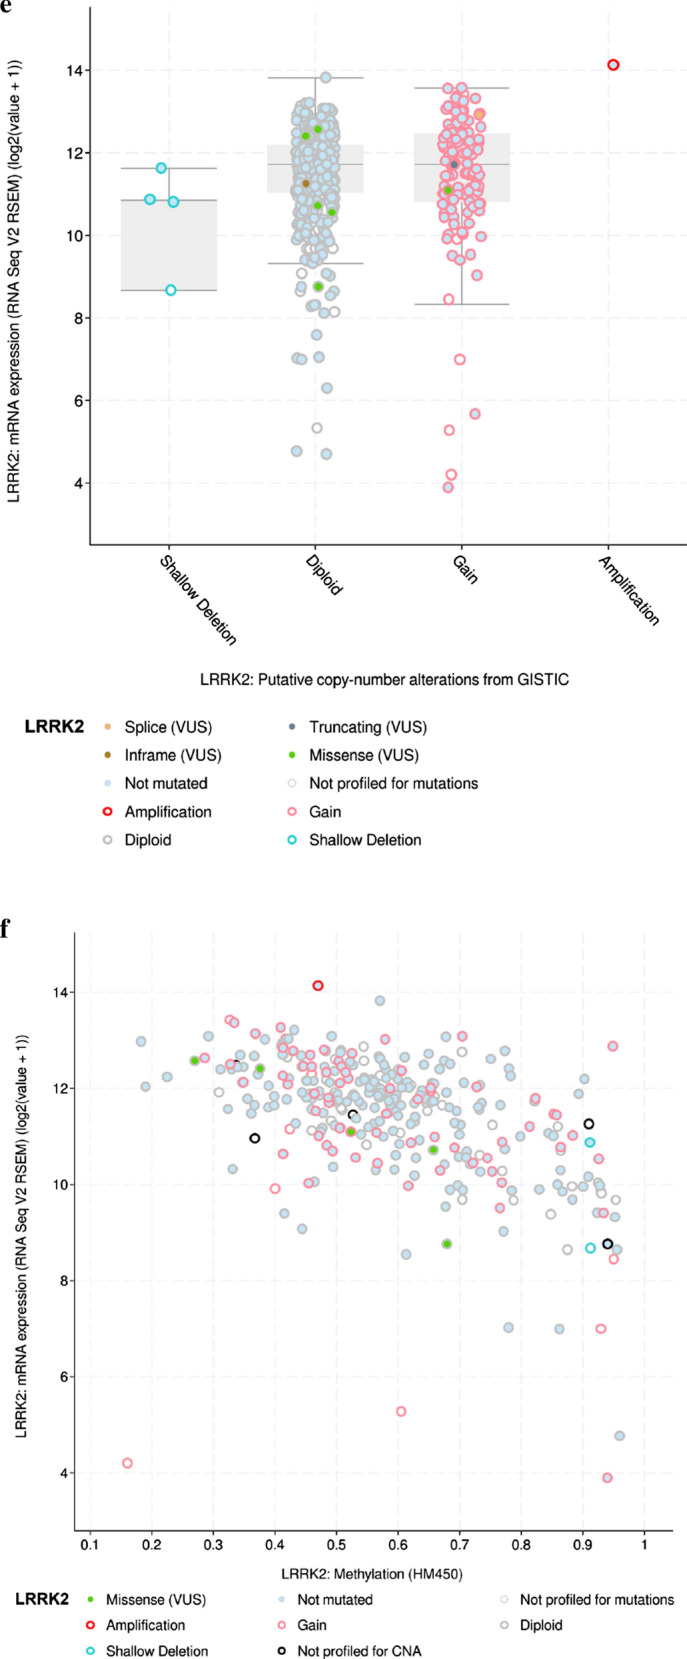
LRRK2 differential expression and genomic alteration in ccRCC tissues compared with normal control. a LRRK2 expression level in both tumor and normal tissues based on TCGA-KIRC datasets; b LRRK2 expression level in ccRCC tissues and paired adjacent non-tumor tissue. c The gene expression, somatic mutation, copy number variation (CNV), and DNA methylation from USUC Xena databases. d The mutation sites of LRRK2 in ccRCC patients. e The LRRK2 putative copy-number alterations according to cBioPortal for Cancer Genomics. f Negative correlations between the expression of LRRK2 and DNA methylation. g The survival curves of 6 methylated sites of LRRK2 in ccRCC patients. ccRCC clear cell renal cell carcinoma, KIRC kidney renal clear cell carcinoma
The correlation between LRRK2 and clinicopathological characteristics
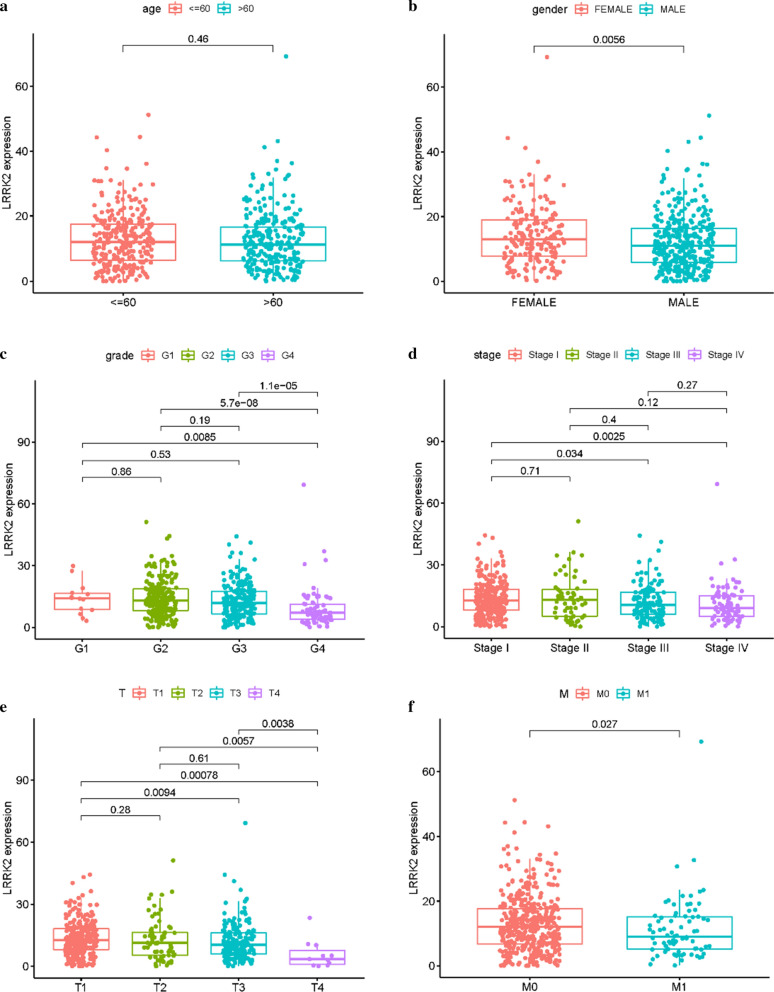
A Wilcoxon signed-rank test and logistic regression analysis were used to analyze the correlation between LRRK2 expression and clinicopathological characteristics. The results suggest that the upregulation of LRRK2 expression is related to lower tumor grade, stage, and TMN, and LRRK2 overexpression is more frequently seen in women (Fig. 4). Logistic regression analysis showed that LRRK2 expression is associated with gender (male vs. female, OR = 0.67, 95% CI 0.47–0.96), grade (G1 vs. G4, OR = 0.16, 95% CI 0.04–0.53), stage (I vs. III, OR = 0.55, 95% CI 0.36–0.85; I vs. IV, OR = 0.44, 95% CI 0.26–0.72), T (T1 vs. T3, OR = 0.51, 95% CI 0.35–0.75; T1 vs. T4, OR = 0.07, 95% CI 0.00–0.39), M (M0 vs. M1, OR = 0.54, 95% CI 0.32–0.88) (Table 1).
Fig. 4.
Relationship between LRRK2 expression and clinical characteristics. a Age (≤ 60 y and > 60 y); b gender; c grade; d stage; e tumor size and local growth (T); f occurrence of distant metastases (M)
Table 1.
Logistic regression analysis of the relationship between LRRK2 expression and clinical characteristics
| Clinical characteristics | Samples | OR (odd ratio) | p-value |
|---|---|---|---|
| Age (continuous) | 537 | 0.99 (0.98–1.01) | 0.214 |
| Gender (female vs. male) | 537 | 0.67 (0.47–0.96) | 0.029* |
| Grade (G1 vs. G4) | 520 | 0.16 (0.04–0.53) | 0.004* |
| Stage (I vs. III) | 534 | 0.55 (0.36–0.85) | 0.007* |
| (I vs. IV) | 534 | 0.44 (0.26–0.72) | 0.001* |
| T (T1 vs. T3) | 537 | 0.51 (0.35–0.75) | 0.001* |
| (T1 vs. T4) | 537 | 0.07 (0.00–0.39) | 0.013* |
| M (M0 vs. M1) | 505 | 0.54 (0.32–0.88) | 0.015* |
Prognostic value of LRRK2 based on TCGA-KIRC large cohorts
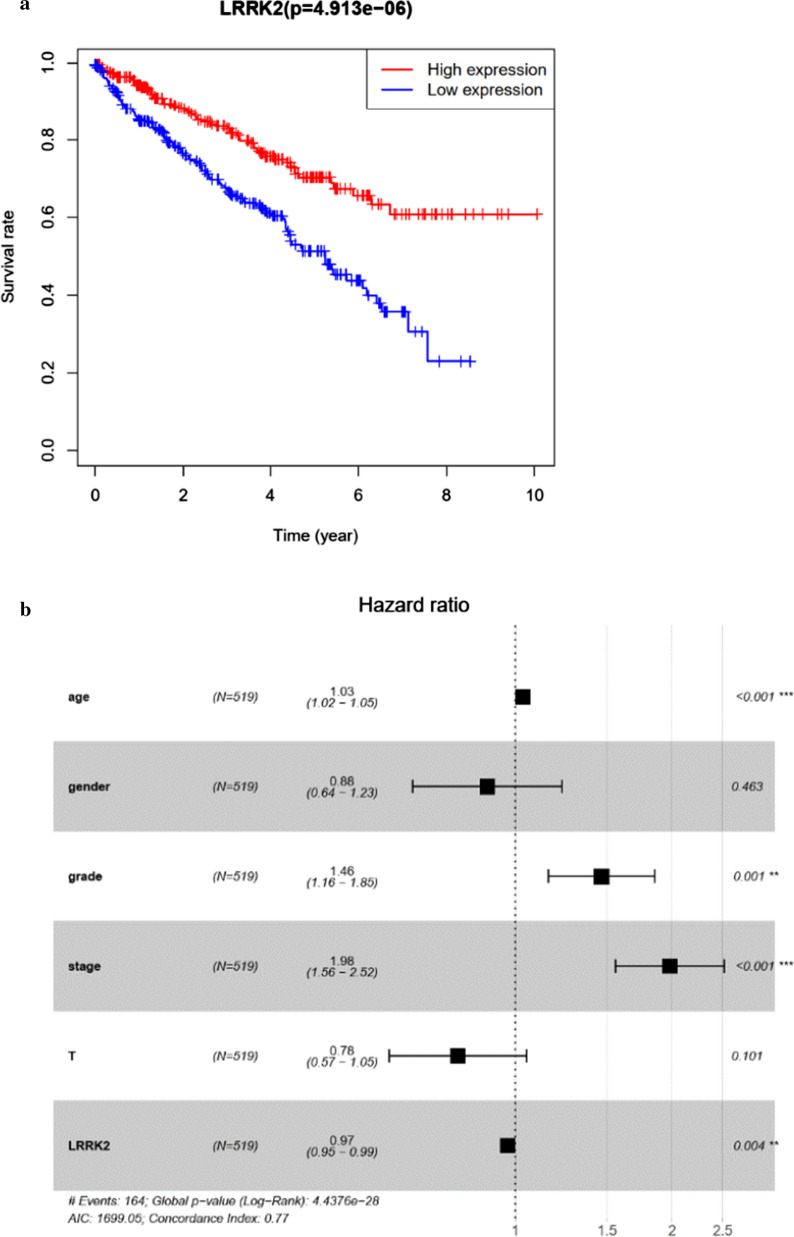
Kaplan–Meier survival curve from TCGA cohorts revealed that higher LRRK2 expression is associated with better prognosis in ccRCC patients (Fig. 5a). In multivariate regression analysis, the hazard ratio (HR) of LRRK2 expression (HR = 0.97, 95% CI 0.95–0.99) is less than 1, suggesting that higher LRRK2 expression correlates with better prognosis as improved overall survival (OS). In contrast, patient age (HR = 1.03, 95% CI 1.02–1.05), tumor grade (HR = 1.46, 95% CI 1.16–1.85) and stage (HR = 1.98, 95% CI 1.56–2.52) are correlated with poor prognosis, as can be expected (Fig. 5b, Table 2).
Fig. 5.
Prognostic analyses based on LRRK2 expression and overall survival. a Kaplan–Meier survival curve plotted based on a total of 530 patients; b multivariate Cox regression analysis of OS in TCGA cohorts grouped by the median of LRRK2 expression. OS overall survival
Table 2.
Univariate and multivariate Cox regression analysis of overall survival in patients with ccRCC
| Clinical parameter | Univariate Cox regression | Multivariate Cox regression | ||||||
|---|---|---|---|---|---|---|---|---|
| HR | 95% CI | p | HR | 95% CI | p | |||
| Age | 1.03 | 1.02 | 1.05 | 0.000 | 1.03 | 1.02 | 1.05 | 0.000 |
| Gender | 0.95 | 0.69 | 1.31 | 0.773 | 0.88 | 0.64 | 1.23 | 0.463 |
| Grade | 2.32 | 1.88 | 2.86 | 0.000 | 1.46 | 1.16 | 1.85 | 0.001 |
| Stage | 1.90 | 1.67 | 2.18 | 0.000 | 1.98 | 1.56 | 2.52 | 0.000 |
| T | 1.95 | 1.65 | 2.31 | 0.000 | 0.78 | 0.57 | 1.05 | 0.101 |
| LRRK2 | 0.95 | 0.93 | 0.97 | 0.000 | 0.97 | 0.95 | 0.99 | 0.004 |
HR hazard ratio, CI confidence interval
Gene set enrichment analysis (GSEA) for LRRK2
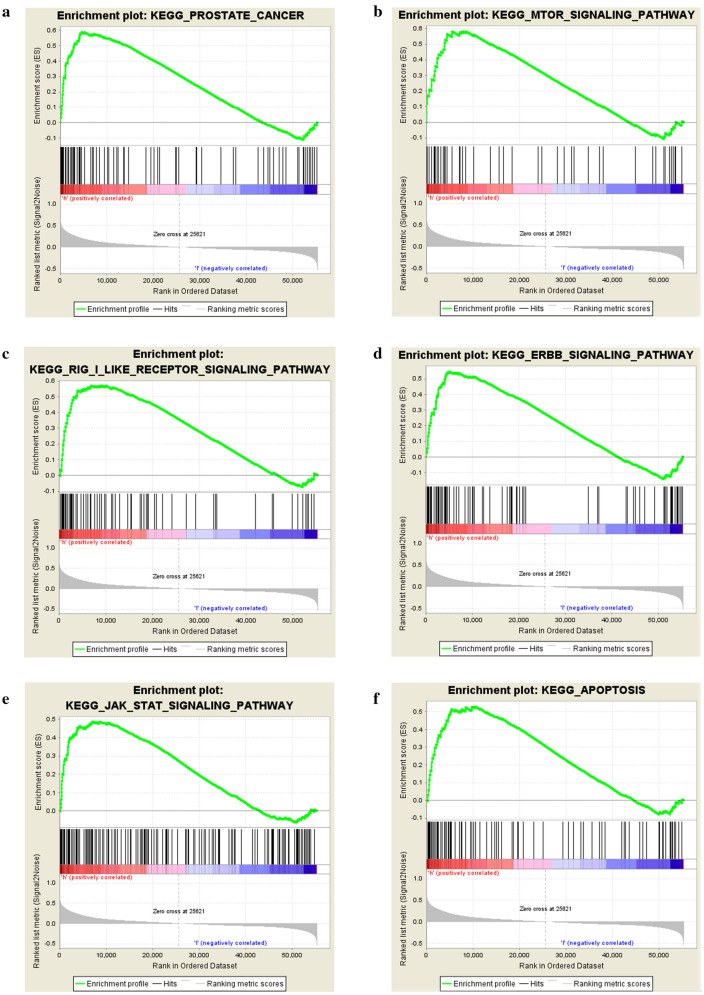
GSEA was conducted between two groups, the high LRRK2 expression and low LRRK2 expression, by calculating normalized enrichment score (NES) and selecting high LRRK2 expression enriched pathways (NOM p-val < 0.05, FDR q-val < 0.25). We identified “Prostate Cancer”, “MTOR signaling pathway”, “RIG-I-like receptor signaling pathway”, “ERBB signaling pathway”, “JAK-STAT signaling pathway” and “Apoptosis” as the potential functional enriched pathways modulated by LRRK2 (Table 3 and Fig. 6).
Table 3.
Gene sets enriched in phenotype high
| MSigDB collection | Gene set name | NES | NOM p-val | FDR q-val |
|---|---|---|---|---|
| c2.cp.kegg.v7.1.symbols.gmt | Prostate cancer | 2.16 | 0.006 | 0.093 |
| MTOR signaling pathway | 2.12 | 0.000 | 0.068 | |
| RIG-I-like receptor signaling pathway | 2.11 | 0.002 | 0.047 | |
| ERBB signaling pathway | 2.10 | 0.002 | 0.030 | |
| JAK-STATE signaling pathway | 2.06 | 0.002 | 0.031 | |
| Apoptosis | 1.99 | 0.011 | 0.032 |
MSigDB molecular signatures database, NES Normalized Enrichment Score, FDR false discovery rate
Fig. 6.
Six important enriched pathways involving LRRK2 in ccRCC according to GSEA. a Prostate cancer pathway; b mTOR signaling pathway; c RIG-I-like receptor signaling pathway; d ERBB signaling pathway; e JAK-STAT signaling pathway; f apoptosis pathway. GSEA Gene Set Enrichment Analysis
The expression of LRRK2 is highly upregulated in patients with ccRCC tissue and cell lines
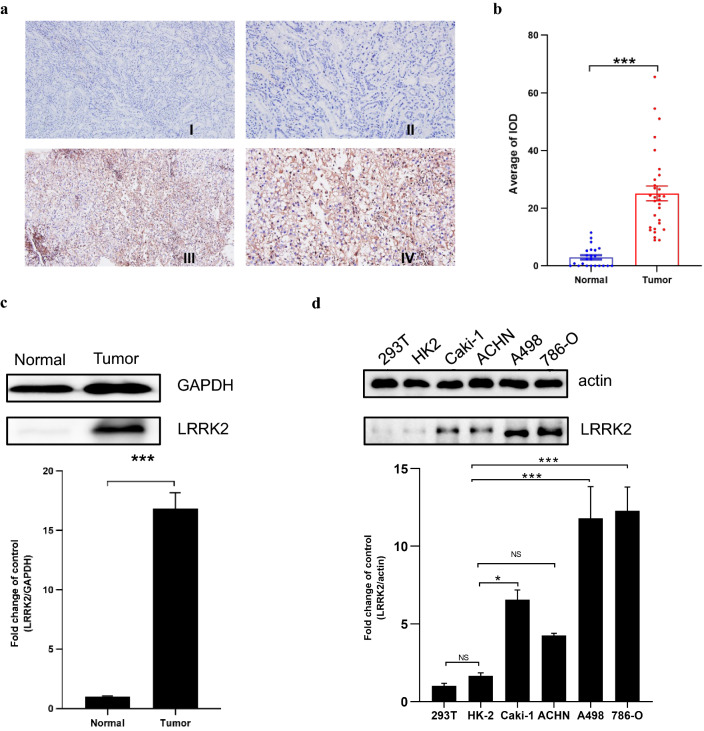
To verify the findings from the above databases studies, we conducted a series of experimental validations. Overall, 30 cases of ccRCC were retrieved from the pathology archives, from 22 (73%) male and 8 (27%) female patients. The median age is 62 years (range 44–91 years). Immunohistochemically, as shown in Fig. 7a, LRRK2 is highly expressed in ccRCC, but hardly expressed in the adjacent non-tumor tissue. Based on the intensity and density of IHC staining, the LRRK2 IHC score of tumor tissue is significantly higher than that of the controls (Fig. 7b). Likewise, Western blotting results showed that the expression level of LRRK2 in ccRCC tissues was significantly higher than that in adjacent non-tumor tissues (Fig. 7c).
Fig. 7.
Expression in kidney tissue and cell lines. a Immunohistochemical (IHC) staining of LRRK2 in paired non-tumor tissue (n = 23, I. ×10 and II. ×20) and clear cell renal cell carcinoma tissues (n = 30, III. ×10 and IV. ×20); b IHC analysis of LRRK2 in non-tumor control and tumor tissues by image pro plus; c LRRK2 expression in ccRCC tissues and paired adjacent non-tumor tissue by western blotting (n = 3); d LRRK2 expression in HEK293T, HK-2 and ccRCC tumor cell lines by western blotting (n = 3)
We further validated the expression of LRRK2 in the ccRCC cell lines by western blotting. Compared with the normal renal epithelial cell line HEK293T and HK2, the expression of LRRK2 is significantly upregulated in the ccRCC cell lines, including Caki-1, A498 and 786-O. The expression of LRRK2 in ACHN cell line showed similar trend, but the differences were not statistically significant (Fig. 7d).
LRRK2 knockdown disrupts tumor cell proliferation
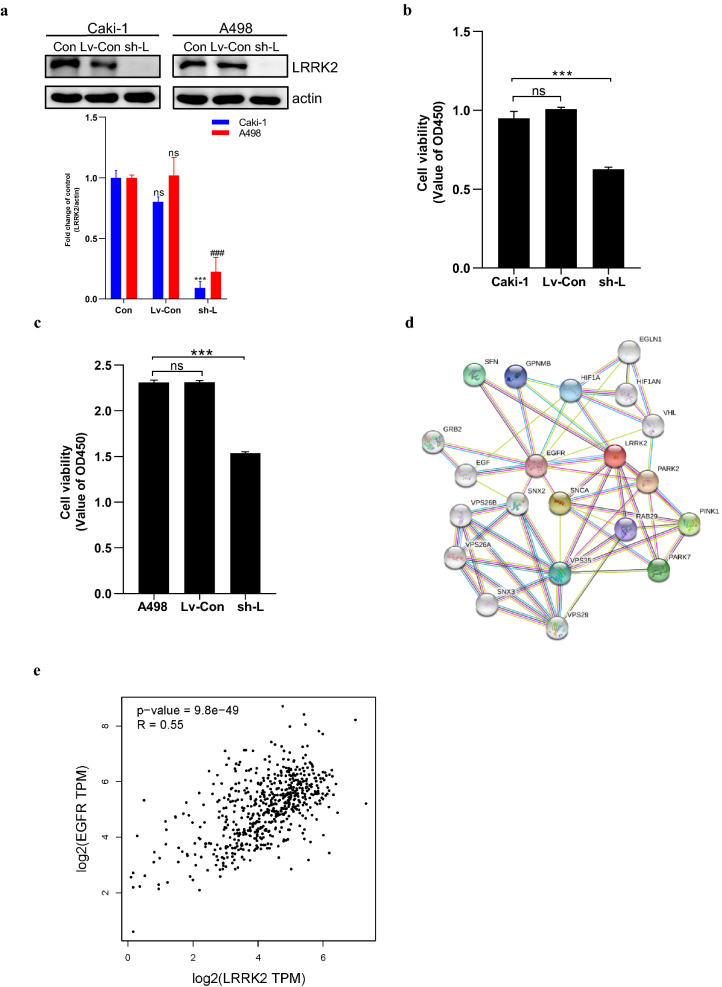
We used a loss-of-function strategy in culture A498 and 786-O cells, using lentiviral RNA to determine the functional role of LRRK2 in ccRCC. The shRNA diminished LRRK2 protein levels in ccRCC tumor cell lines (Fig. 8a). Analysis of cell growth after stable knockdown LRRK2 demonstrates a restraint in cell growth compared with a control shRNA (Fig. 8b, c).
Fig. 8.
The function of LRRK2 in ccRCC tumor cell lines and protein–protein interaction of LRRK2. a Western blotting for LRRK2 expression in stable knockdown ccRCC tumor cell lines, Caki-1 and A498 cells were stably infected with lentiviral shRNA targeting LRRK2 (sh-L) or with a nontargeting control shRNA (Lv-Con). Values are expressed as mean ± SEM (n = 3). Within each group, values significantly different from control (Con) (p < 0.05) are indicated with an asterisk or pound key; b the proliferation ability of stable knockdown Caki-1 was uncovered by CCK8 assay; c the proliferation ability of stable knockdown A498 was uncovered by CCK8 assay; d the protein–protein interaction network of LRRK2 by STRING database; e correlation between LRRK2 and EGFR in ccRCC using the Gene Expression Profiling Interactive Analysis (GEPIA) database
Protein–protein interaction (PPI) network of LRRK2
Previous studies have shown that in addition to the loss of chromosome arm 3p, there can be loss of chromosome 14q in ccRCC. The latter contains HIF1A [12]. The PPI network prediction analysis using the STRING database showed that there is a potential interaction between LRRK2 and HIF1A (score = 0.941), indicating that LRRK2 may play a vital role in the pathogenesis of ccRCC (Fig. 8d). In addition, the PPI network prediction analysis showed a potential interaction between LRRK2 and EGFR (score = 0.921), and the interaction of LRRK2 and EGFR was analyzed using the Gene Expression Profiling Interactive Analysis (GEPIA) database, suggesting the positive correlation between them (Fig. 8e).
Discussion
The prognosis of renal cell carcinoma (RCC) is difficult to predict. Therefore, it is essential to identify more reliable biomarkers to guide clinical management. In this study, we found that LRRK2 is upregulated in ccRCC, and high LRRK2 expression is associated with patient outcomes.
LRRK2 is a kinase encoded by the LRRK2 gene. It has a complex structure with multiple domains: a Ras of complex GTPase domain (ROC), a C-terminal of ROC domain (COR), and a Ser/Thr kinase domain [13]. The HPA database shows that LRRK2 protein is mainly expressed in renal tubular epithelial cells and immune cells. The biological functions of LRRK2 include protein translation, regulation of autophagy, and axonal degeneration induced by α-synuclein [13, 14]. By analyzing multiple databases for the expression of individual proteins, and confirming in clinical specimens as well as cell lines, we have found that LRRK2 is over-expressed in ccRCC. We speculate that LRRK2 can be a novel prognostic biomarker of renal cell carcinoma. Analysis of the TCGA datasets has shown that high expression of LRRK2 is related to the gender of the patients, tumor grade, stage, metastatic status, and prognosis of ccRCC patients.
Previously, research on LRRK2 were mainly focused on its role in Parkinson’s disease. A study showed that LRRK2 is amplified and overexpressed in papillary renal carcinoma, and down-regulation of LRRK2 in cultured tumor cells compromises cellular mesenchymal–epithelial transition factor (c-MET) signaling activation, which affects the growth and survival of tumor cells [15], but the expression of LRRK2 in clear cell renal cell carcinoma had not been studied. Our data showed that knockdown of LRRK2 expression attenuats the proliferative ability of ccRCC tumor cell lines, indicating that LRRK2 has a critical role in ccRCC tumor cell growth and proliferation, but the specific mechanisms needs further investigation. The protein–protein interaction network (PPI) analysis of the STRING database has shown that LRRK2 interacts with EGFR and HIF1A. The epidermal growth factor receptor (EGFR) signaling pathway plays a critical role in the pathogenesis and progression of renal cell carcinoma [16, 17], suggested that LRRK2 may play an important role in ccRCC as well. Moreover, HIF1A is a transcription factor that regulates the expression of several hypoxia-responsive genes, including vascular endothelial growth factor (VEGF) [18], platelet-derived growth factor (PDGF) [19], and glucose transporters GLUT1 and GLUT4 [20]. Hypoxia is a key step in the occurrence and development of renal cell carcinoma, which is mainly regulated by the tumor suppressor gene VHL, and the VHL-HIF1A-VEGFA protein axis is involved in the occurrence and development of renal cell carcinoma [21]. VHL mutation and inactivation can lead to the accumulation of HIF1A transcription factors, which can trigger VEGFA transcription to promote angiogenesis and play a key role in tumorigenesis and development [21, 22]. HIF1A is detected in about 70% of ccRCC and is closely related to patient survival [23]. In addition, HIF1A is necessary for the clear cell phenotype [22, 24]. Overall, we suspect that LRRK2 may play a role in the occurrence of, and influence the development of RCC by regulating HIF1A, and ultimately affect the survival of ccRCC patients. However, the exact mechanisms need to be further studied.
In conclusion, our results show that LRRK2 is expressed and up-regulated in ccRCC as identified by bioinformatics analysis and confirmed in tissue specimens, suggesting that LRRK2 may be a potential target for ccRCC treatment. However, additional studies are necessary for further elucidation of the mechanisms.
Supplementary Information
Additional file 1: Table S1. Detailed information of ccRCC patients is listed.
Acknowledgements
Not applicable.
Abbreviations
- ccRCC
Clear cell renal cell carcinoma
- TCGA
The Cancer Genome Atlas
- GEO
Gene Expression Omnibus
- LRRK2
Leucine-rich repeat kinase 2
- GEPIA
Gene Expression Profiling Interactive Analysis
- VHL
Von Hippel-Lindau
- SETD2
Set domain-containing 2
- BAP1
BRCA1-associated protein-1
- PBRM1
Polybromo-1
- KDM5C
Lysine-specific histone demethylase 5C
- IMPA2
Myo-inositol monophosphatase 2
- RMA
Robust Multi-array Average
- DEGs
Differentially expressed genes
- TOM
Topological overlap matrix
- WGCNA
Weighted gene co-expression network analysis
- KIRC
Kidney renal clear cell carcinoma
- MEs
Module eigengenes
- STRING
Search tool for recurring instances of neighboring genes
- PPI
Protein–protein interaction
- GO
Gene Ontology
- KEGG
Kyoto Encyclopedia of Genes and Genomes
- HPA
Human Protein Altas
- GSEA
Gene set enrichment analysis
- MsigDB
Molecular signatures database
- FFPE
Formalin-fixed paraffin-embedded
- IHC
Immunohistochemistry
- IOD
Integrated optical density
- SNPs
Single nucleotide polymorphisms
- INDEL
Insertion–deletion
- CNV
Copy number variation
- HR
Hazard ratio
- OS
Overall survival
- RCC
Renal cell carcinoma
- ROC
RAS of complex GTPase domain
- COR
C-terminal of ROC domain
- c-MET
Cellular mesenchymal–epithelial transition factor
- EGFR
Epidermal growth factor receptor
- VEGF
Vascular endothelial growth factor
- PDGF
Platelet derived growth factor
Authors’ contributions
CY and JP: literature design and writing (these authors contributed equally). CY, JP, and HP: experiment conduction, acquisition, statistical analysis, and verification of data. All authors: technical and material support. YL: histopathological review and guidance of the tissue analysis. SYX: design, writing, editing, and final proof. All authors read and approved the final manuscript.
Funding
This work was supported by Zhongnan Hospital of Wuhan University Science, Technology and Innovation Seed Fund (znpy2019092).
Availability of data and materials
The datasets generated during the current study are available in the Gene Expression Omnibus (GEO) database (https://www.ncbi.nlm.nih.gov/geo/), the cancer genome atlas (TCGA) database (https://portal.gdc.cancer.gov/), Gene Expression Profiling Interactive Analysis (GEPIA) database (http://gepia2.cancer-pku.cn/#index), and STRING database (https://string-db.org/).
Declarations
Ethics approval and consent to participate
This study was reviewed and approved by the Medical Ethical Committee of Zhongnan hospital.
Consent for publication
Not applicable.
Competing interests
The authors have no conflicts of interest to declare.
Footnotes
Publisher's Note
Springer Nature remains neutral with regard to jurisdictional claims in published maps and institutional affiliations.
Chunxiu Yang and Jingjing Pang—co-first authors
References
- 1.Parikh M, Lara PN., Jr Modern systemic therapy for metastatic renal cell carcinoma of the clear cell type. Annu Rev Med. 2018;69:209–221. doi: 10.1146/annurev-med-041916-124132. [DOI] [PubMed] [Google Scholar]
- 2.Hsieh JJ, Purdue MP, Signoretti S, Swanton C, Albiges L, Schmidinger M, Heng DY, Larkin J, Ficarra V. Renal cell carcinoma. Nat Rev Dis Prim. 2017;3:17009. doi: 10.1038/nrdp.2017.9. [DOI] [PMC free article] [PubMed] [Google Scholar]
- 3.Capitanio U, Bensalah K, Bex A, Boorjian SA, Bray F, Coleman J, Gore JL, Sun M, Wood C, Russo P. Epidemiology of renal cell carcinoma. Eur Urol. 2019;75(1):74–84. doi: 10.1016/j.eururo.2018.08.036. [DOI] [PMC free article] [PubMed] [Google Scholar]
- 4.Petejova N, Martinek A. Renal cell carcinoma: Review of etiology, pathophysiology and risk factors. Biomed Pap Med Fac Univ Palacky Olomouc Czech Repub. 2016;160(2):183–194. doi: 10.5507/bp.2015.050. [DOI] [PubMed] [Google Scholar]
- 5.Gossage L, Eisen T, Maher ER. VHL, the story of a tumour suppressor gene. Nat Rev Cancer. 2015;15(1):55–64. doi: 10.1038/nrc3844. [DOI] [PubMed] [Google Scholar]
- 6.Piva F, Santoni M, Matrana MR, Satti S, Giulietti M, Occhipinti G, Massari F, Cheng L, Lopez-Beltran A, Scarpelli M, et al. BAP1, PBRM1 and SETD2 in clear-cell renal cell carcinoma: molecular diagnostics and possible targets for personalized therapies. Expert Rev Mol Diagn. 2015;15(9):1201–1210. doi: 10.1586/14737159.2015.1068122. [DOI] [PubMed] [Google Scholar]
- 7.Sato Y, Yoshizato T, Shiraishi Y, Maekawa S, Okuno Y, Kamura T, Shimamura T, Sato-Otsubo A, Nagae G, Suzuki H, et al. Integrated molecular analysis of clear-cell renal cell carcinoma. Nat Genet. 2013;45(8):860–867. doi: 10.1038/ng.2699. [DOI] [PubMed] [Google Scholar]
- 8.Dalgliesh GL, Furge K, Greenman C, Chen L, Bignell G, Butler A, Davies H, Edkins S, Hardy C, Latimer C, et al. Systematic sequencing of renal carcinoma reveals inactivation of histone modifying genes. Nature. 2010;463(7279):360–363. doi: 10.1038/nature08672. [DOI] [PMC free article] [PubMed] [Google Scholar]
- 9.Morris MR, Latif F. The epigenetic landscape of renal cancer. Nat Rev Nephrol. 2017;13(1):47–60. doi: 10.1038/nrneph.2016.168. [DOI] [PubMed] [Google Scholar]
- 10.Zbar B, Brauch H, Talmadge C, Linehan M. Loss of alleles of loci on the short arm of chromosome 3 in renal cell carcinoma. Nature. 1987;327(6124):721–724. doi: 10.1038/327721a0. [DOI] [PubMed] [Google Scholar]
- 11.Lin YF, Chou JL, Chang JS, Chiu IJ, Chiu HW, Lin YF. Dysregulation of the miR-25-IMPA2 axis promotes metastatic progression in clear cell renal cell carcinoma. EBioMedicine. 2019;45:220–230. doi: 10.1016/j.ebiom.2019.06.006. [DOI] [PMC free article] [PubMed] [Google Scholar]
- 12.Linehan WM, Ricketts CJ. The Cancer Genome Atlas of renal cell carcinoma: findings and clinical implications. Nat Rev Urol. 2019;16(9):539–552. doi: 10.1038/s41585-019-0211-5. [DOI] [PubMed] [Google Scholar]
- 13.Liu Z, Lenardo MJ. The role of LRRK2 in inflammatory bowel disease. Cell Res. 2012;22(7):1092–1094. doi: 10.1038/cr.2012.42. [DOI] [PMC free article] [PubMed] [Google Scholar]
- 14.Lin CH, Tsai PI, Wu RM, Chien CT. LRRK2 Parkinson’s disease: from animal models to cellular mechanisms. Rev Neurosci. 2011;22(4):411–418. doi: 10.1515/rns.2011.036. [DOI] [PubMed] [Google Scholar]
- 15.Looyenga BD, Furge KA, Dykema KJ, Koeman J, Swiatek PJ, Giordano TJ, West AB, Resau JH, Teh BT, MacKeigan JP. Chromosomal amplification of leucine-rich repeat kinase-2 (LRRK2) is required for oncogenic MET signaling in papillary renal and thyroid carcinomas. Proc Natl Acad Sci USA. 2011;108(4):1439–1444. doi: 10.1073/pnas.1012500108. [DOI] [PMC free article] [PubMed] [Google Scholar]
- 16.Liu C, Liu L, Wang K, Li XF, Ge LY, Ma RZ, Fan YD, Li LC, Liu ZF, Qiu M, et al. VHL-HIF-2alpha axis-induced SMYD3 upregulation drives renal cell carcinoma progression via direct trans-activation of EGFR. Oncogene. 2020;39(21):4286–4298. doi: 10.1038/s41388-020-1291-7. [DOI] [PubMed] [Google Scholar]
- 17.Wang S, Yu ZH, Chai KQ. Identification of EGFR as a novel key gene in clear cell renal cell carcinoma (ccRCC) through bioinformatics analysis and meta-analysis. Biomed Res Int. 2019;2019:6480865. doi: 10.1155/2019/6480865. [DOI] [PMC free article] [PubMed] [Google Scholar]
- 18.Chen X, Liu J, He B, Li Y, Liu S, Wu B, Wang S, Zhang S, Xu X, Wang J. Vascular endothelial growth factor (VEGF) regulation by hypoxia inducible factor-1 alpha (HIF1A) starts and peaks during endometrial breakdown, not repair, in a mouse menstrual-like model. Hum Reprod. 2015;30(9):2160–2170. doi: 10.1093/humrep/dev156. [DOI] [PubMed] [Google Scholar]
- 19.Chen J, Cui X, Qian Z, Li Y, Kang K, Qu J, Li L, Gou D. Multi-omics analysis reveals regulators of the response to PDGF-BB treatment in pulmonary artery smooth muscle cells. BMC Genom. 2016;17(1):781. doi: 10.1186/s12864-016-3122-3. [DOI] [PMC free article] [PubMed] [Google Scholar]
- 20.Hong J, Kim Y, Yanpallewar S, Lin PC. The Rho/Rac guanine nucleotide exchange factor Vav1 regulates Hif-1alpha and Glut-1 expression and glucose uptake in the brain. Int J Mol Sci. 2020;21(4):1341. doi: 10.3390/ijms21041341. [DOI] [PMC free article] [PubMed] [Google Scholar]
- 21.Wierzbicki PM, Klacz J, Kotulak-Chrzaszcz A, Wronska A, Stanislawowski M, Rybarczyk A, Ludziejewska A, Kmiec Z, Matuszewski M. Prognostic significance of VHL, HIF1A, HIF2A, VEGFA and p53 expression in patients with clearcell renal cell carcinoma treated with sunitinib as firstline treatment. Int J Oncol. 2019;55(2):371–390. doi: 10.3892/ijo.2019.4830. [DOI] [PMC free article] [PubMed] [Google Scholar]
- 22.Hoefflin R, Harlander S, Schafer S, Metzger P, Kuo F, Schonenberger D, Adlesic M, Peighambari A, Seidel P, Chen CY, et al. HIF-1alpha and HIF-2alpha differently regulate tumour development and inflammation of clear cell renal cell carcinoma in mice. Nat Commun. 2020;11(1):4111. doi: 10.1038/s41467-020-17873-3. [DOI] [PMC free article] [PubMed] [Google Scholar]
- 23.Fu L, Wang G, Shevchuk MM, Nanus DM, Gudas LJ. Generation of a mouse model of Von Hippel-Lindau kidney disease leading to renal cancers by expression of a constitutively active mutant of HIF1alpha. Can Res. 2011;71(21):6848–6856. doi: 10.1158/0008-5472.CAN-11-1745. [DOI] [PMC free article] [PubMed] [Google Scholar]
- 24.Gudas LJ, Fu L, Minton DR, Mongan NP, Nanus DM. The role of HIF1alpha in renal cell carcinoma tumorigenesis. J Mol Med. 2014;92(8):825–836. doi: 10.1007/s00109-014-1180-z. [DOI] [PMC free article] [PubMed] [Google Scholar]
Associated Data
This section collects any data citations, data availability statements, or supplementary materials included in this article.
Supplementary Materials
Additional file 1: Table S1. Detailed information of ccRCC patients is listed.
Data Availability Statement
The datasets generated during the current study are available in the Gene Expression Omnibus (GEO) database (https://www.ncbi.nlm.nih.gov/geo/), the cancer genome atlas (TCGA) database (https://portal.gdc.cancer.gov/), Gene Expression Profiling Interactive Analysis (GEPIA) database (http://gepia2.cancer-pku.cn/#index), and STRING database (https://string-db.org/).


