

Abstract
Agarose, a strongly gelling polysaccharide, is a common ingredient used to optimize the viscoelastic properties of a multitude of food products. Through aggregation of double helices via hydrogen bonds while cooling under quiescent conditions it forms firm and brittle gels. However, this behavior can be altered by manipulating the processing conditions viz shear. For example, gelation under shear leads to microgel particles with large surface area, which in turn leads to completely different rheological properties and texture. Such fluid gels are shown to play an important role in texture modification of foods and beverages for dysphagia patients. In this study, different concentration of agarose fluid gel (0.5 % wt, 1 % wt and 2 % wt) were considered. Rheological measurements of the microgel particles showed an increase of storage and loss modulus with increasing concentration. However, 1 % wt fluid gel exhibited the lowest viscosity in the low shear range and the shortest LVE range. Furthermore, the effect on the microstructure and size of gel particles were also investigated by using light microscopy and particle size analysis. It was observed that as the concentration of agarose increased the particle size and unordered chains present at the particle surface decreases. Based on our results, we propose specific models suggesting the impact of the particle size, the concentration and the “hairy” projections on the rheological and tribological properties that could help in understanding the differences in characteristics of fluid gels.
Keywords: Agarose, Fluid/sheared gels, Microgel particles, Physical gelation, Rheology, Friction coefficient
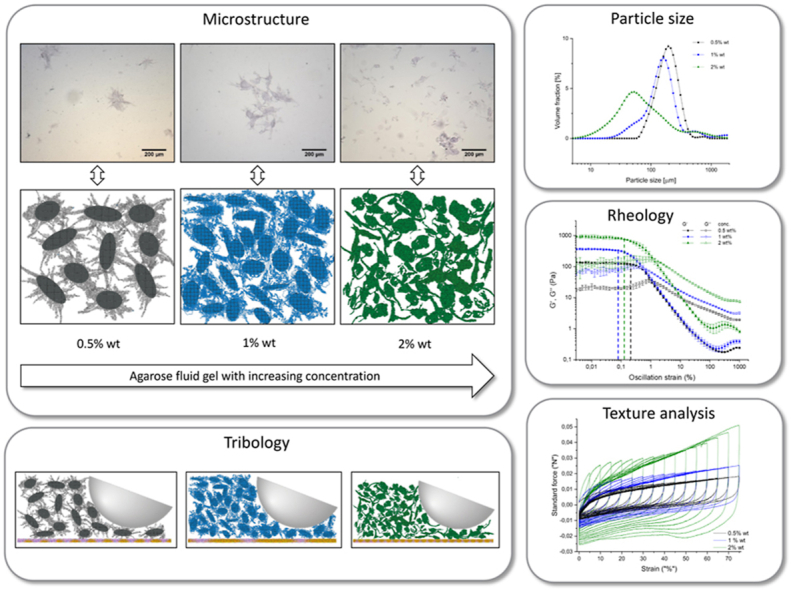
Graphical abstract
Highlights
-
•
Formation of agarose fluid gels in dependence on concentration, temperature and shear rate.
-
•
Competing mechanism during gelation under shear of agarose fluid gels was studied.
-
•
The resulting gel particle structures, their size and shape vary with concentration.
-
•
Network structures, particle size and shape affect the rheological and tribological behavior.
-
•
Fluid gels provide unique properties of friction, viscosity and viscoelastic behavior.
1. Introduction
Hydrocolloids have a wide range of applications in the food, cosmetics and pharmaceutical industries due to their versatile functional properties (Nishinari, Zhang and Ikeda, 2000). To improve the quality and texture of the product, they are mainly used as emulsifiers, stabilizers, thickeners and gelling agents (Saha and Bhattacharya, 2010). Hydrocolloids are in most cases natural biopolymers such as polysaccharides that have a thickening and gelling effect when hydrated in water above a critical concentration and subjected to physico-chemical process. The interest of using polysaccharides in food applications is due to their ability to modify and improve the rheological and textural properties, which results in better mouth feeling by precisely controlling the texture and viscoelastic properties (Li and Nie, 2016; Nishinari et al., 2000).
In the present work, the underlying physico-chemical properties of fluid gels prepared using polysaccharides such as agarose are investigated to study their impacts on rheological, mechanical as well as tribological behavior. At this point, we emphasize that this study here is not motivated by food engineering properties, but rather on the fundamental physical question of soft material in model food systems such as fluid gels in this case. Fluid gels are particulate gel suspension and are formed by applying a shear field to a biopolymer solution while it gels (Farrés et al., 2014; Frith et al., 2002; Gabriele et al., 2010; Norton et al., 1999). Many elastic gel particles become immersed in a water phase and as a result, fluid gels exhibit novel rheological properties. They exhibit structures that remain textured and behave like a solid at rest, but exhibit fluid-like flow behavior above a critical value of applied stress (Norton et al., 1999). This change in formulation and the creation of food materials based on biopolymer gel materials with controlled microstructure enabled an even much broader range of applications in the food industry for potential use as a fat replacer in low energy food products but also for pharmaceutical applications for controlled drug release (Farrés et al., 2014; Mahdi et al., 2014). Furthermore, the fact that different texture properties can be produced from identical biopolymers simply by controlling the process conditions, such as shear, is a major advantage (Norton et al., 2006).
Agarose used in this study is the main gelling agent of agar-agar extracted from red algae (Rhodophyceae) and its linear polymer is composed of (1–3)-linked agarobiose units of β-D-galactopyranose (1–4)-linked to 3,6-anhydro-α-L-galactopyranose (Imeson, 2009). Agarose solution undergoes very quickly a sol-gel transition upon cooling and form a three-dimensional network, due to its molecular structure and physico-chemical properties. During gelation under cooling, the single chains first associate via hydrogen bonds to form double helices. Further cooling leads to aggregation of these double helices (Russ et al., 2013). A two-step gelation mechanism for agarose was proposed: first, the connection of the randomly distributed coils by hydrogen bonds to form a double-helical association, followed by the aggregation of the double helices to form a tight three-dimensional network (Nordqvist and Vilgis, 2011; Russ et al., 2013). Furthermore, the coil to helix transition which takes place while cooling can be described by a mean field Zimm-Bragg approach (Nowak and Vilgis, 2004; Vilgis, 2015; Zimm and Bragg, 1959). Agarose gels are known for their tendency to release water and are susceptible to syneresis, which increases with decreasing of agarose concentration meaning that the water holding capacity increases with increasing agarose concentration. Syneresis in physical aqueous gels has been studied and discussed in detailed by Ako (2017) and Nishinari & Fang (Nishinari & Fang, 2016, 2017) and other workers cited therein. Water was noted to exude out at the surface of the gels and even though it resulted in an increase in concentration due to syneresis, a decrease in elastic modulus was reported due to network loosening and volume contraction (Nishinari & Fang, 2016, 2017). Such tendency of water release can be taken as an indication for the storage stability and is, additional to the texture properties, also of high importance for the mouthfeel (Fiszman and Durán, 1992; Nordqvist and Vilgis, 2011). Due to the dense three-dimensional network and the fast kinetics of the gelling process, agarose forms hard, highly elastic gels that result in poor mouthfeel (Nordqvist and Vilgis, 2011). A way to improve the mouthfeel can be therefore by manipulating the processing condition.
It has been proposed that when biopolymers are subjected to shear during their gelation, a competing mechanism occurs between gelation by physical crosslinking via hydrogen bonds and their breakup by the shear forces (De Carvalho and Djabourov, 1997). Furthermore, the gel structure formed by gelation under shear results from the competition between at least two time scales: shear rates and the molecular dynamics of the agarose chains. Moreover, the entire cascade of the internal modes of the polymer motion as expressed for the Rouse-Zimm model play a role under growing cluster size inside the forming gel particles (Doi and Edwards, 1986). Furthermore, cooling rate: influence first the center of mass of individual polymers, then the center of mass of the cluster, then the growing size slows the cluster dynamics further to smaller time scales and shorter spatial displacements. In addition, it was suggested that particle size and particle volume fraction are shear rate, temperature rate and concentration dependent and predict the properties of the fluid gel (De Carvalho and Djabourov, 1997; Norton et al., 1999). In turn, this led to the assumption that the order rate of the biopolymer is the crucial factor for particle growth. The particle size () dependence on these parameters can be described to lowest order using Einstein diffusion law at low Péclet number. This equation defines a relationship between particle size and viscosity ηs of the sol phase, which is also determined by the shear rate
| (1) |
and kBT is the thermal energy. Furthermore, previous work proposed that the mechanism for the formation of the sheared gel is based on the initial nucleation and growth into spherical gel particles due to either the ‘enrichment’ process from the surrounding non-gelled matrix or due to the agglomeration of the nucleating particles that are forced together in the shear flow. These are then separated by shear forces, which constrain molecular ordering within the discrete particles (Norton et al., 1999). However, eq. (1) can only be viewed as a crude scaling estimate of the size of the gelled particles. The gelling process of agarose gels is a highly non-equilibrium process, as can be seen by the pronounced hysteresis under cooling and heating (refer Vilgis 2015 for a recent review) (Vilgis, 2015). Even at low cooling rates an equilibrium state gel will be reached. Therefore the competition between the time scales imposed by the shear rate during gelation and the broad range of polymer time scales will matter. Before the gelling starts the chains diffuse to lowest approximation according to a Rouse-Zimm model (Doi et al., 1988), suggesting that the center-of-mass diffusion constant DCM of the polymer chains in good solvent behaves as
| (2) |
where N is the average dimensionless chain length of the polymer. Consequently the longest relaxation time τ of the chains is determined by . Under cooling, the time scales change accordingly until the two neighboring chains are close enough to form helices, which introduce much lower time scales. The diffusion of the growing gel clusters slows down further and is again determined by its size, and thus the number of agarose chains involved. In consequence the shape of the particles become irregular, and long, extended excess parts, “tails”, growing from a spherical or ellipsoid center.
Moreover, a detailed study of the lubrication behavior of agarose fluid gels with different concentration was investigated and showed that fluid gel particles with different elasticity influence their rheological and tribological behavior (Gabriele et al., 2010). Additionally, a strong effect of particle shape of blends of different biopolymers on viscosity properties was reported by Wolf et al. (Wolf et al., 2001).
In a recent paper by Holland et al. the formation of the “hairy” agar fluid gel particles was reported by comparing two different agars and concentration prepared by different processes, which resulted in different particle size and shape besides the presence or absence of “tails”. From this study, it was concluded that the “tails” give the particles a much larger hydrodynamic volume than if only the core were present, and thus the effective volume of the “tails” present has an effect on the thermal and rheological behavior. They also conclude a distinct correlation between the dependence of particle size, shape and rheological properties on the type of agar that is used, the preparation method and the concentration (Holland et al., 2018).
Despite many previous studies, a precise gelling mechanism under shear and the resulting physical behavior of fluid gels is not yet fully understood, especially the resulting shapes.
Therefore, our study focuses on finding the detailed gelling mechanism of agarose as a function of concentration and its effect on fluid gel particle size and shape. The agarose fluid gels were prepared in a rheometer using a vane tool geometry for investigating their rheological and tribological properties. Rheological characterization such as: amplitude sweep, frequency sweep and flow sweep was carried out in order to understand in detail effect of concentration on gel network formation. Furthermore, texture analysis of fluid gel was evaluated and compared their results with the lubrication properties at the boundary regime for better assessment of the micro gel particle. Moreover, in order to understand the different behavior, gel particles were examined by microscopy and further reconfirmed by particle size determination. Additionally, scanning electron microscopy was conducted to provide further structural information of the bulk properties. Thus, with aforementioned analysis, we proposed a schematic model which describes the effect of agarose concentration on rheological and tribological properties of fluid gel.
2. Materials and methods
2.1. Materials
Agarose [CAS: 9012-36-6] (Fisher Scientific GmbH Schwerte, Germany) is used in the current study to understand the fluid gel mechanism. According to the manufacturer, the agarose powder has a gelling temperature (Tgel) between 34 and 45 °C and reaches a gel strength of >100 g/cm2.
2.2. Preparation of agarose fluid gels using a rheometer
For the respective concentration of 0.5 % wt, 1 % wt and 2 % wt, agarose was slowly added to Milli-Q water while stirring on a magnetic stirrer (500 rpm). As agarose is only soluble in hot water, the suspension was heated to 85 °C for about 20 min to ensure complete hydration of agarose while stirring in a sealed beaker.
The fluid gels were prepared using the Discovery HR-3 Rheometer (TA Instruments) with a cup (diameter = 30.37 mm) and vane (diameter = 28 mm and length = 42 mm) tool geometry of a concentric cylinder Peltier Jacket which can be electrically heated. The hot agarose solution (30 g) was poured into the cup preheated to 85 °C and then allowed to equilibrate for 5 min before measurements were started. To minimize evaporation during the measurement a two-piece cover was used.
Gelation was performed at a constant shear rate (400 s−1) while cooling to 25 °C at a temperature rate of 1 °C/min and subsequently sheared for another 15 min at 25 °C at the shear rate of 400 s−1. A pourable smooth gel was produced, showing structures that retain their textures at rest and behave like a solid, but exhibit liquid-like flow behavior when subjected to sufficient stress. The samples were then removed from the rheometer and stored at 4 °C for 24 h prior to the further characterization tests.
2.3. Rheological measurements
Dynamic viscoelastic and viscosity measurements of the different concentrations of the agarose fluid gels were performed by a Discovery HR-3 Rheometer (TA Instruments) using a 40 mm diameter parallel plate with a pre-set distance of 500 μm and a solvent trap to prevent evaporation. To avoid disrupting the fluid gel structure, the samples were placed on the geometry with a spoon and overflowing sample material was carefully removed with a spatula. All rheological measurements were performed in triplicate.
Amplitude sweep test was performed to examine the viscoelastic properties of the fluid gels. Using this method, storage (G′) and loss (G″) moduli were measured to describe the deformation behavior of the samples in the non-destructive range defined as the linear-viscoelastic (LVE) range. The limits of the LVE range and the characterization of the behavior after exceeding this range, which is defined as non-linear viscoelastic range, was also evaluated.
The oscillation deformation was applied at constant frequency ƒ = 1 Hz and the storage (G′) and loss (G″) moduli were measured as a function of the strain ranging between 0.001% and 1000% and at a temperature of 25 °C.
Frequency sweeps were performed in the range of 0.1–100 rad/s (0.0159–15.9 Hz) at a constant strain of 0.05%, hence within the LVE range of the amplitude sweep.
For the flow sweep test, rotational steady shear was performed to measure the flow behavior of the fluid gels and the viscosity as a function of the shear rate, increasing from 0.001 to 1000 s−1 before decreasing the shear rate from 1000 to 0.001 s−1. The two-step flow was carried out to examine the extent to which the hysteresis between the two stages, which indicate a change in viscosity, alters. In the present study, only the first step was considered for the viscosity investigation.
2.4. Light microscopy
The microstructure of the gel particles was studied by light microscopy using a Carl Zeiss Axio Scope.A1 microscope (Carl Zeiss AG, Oberkochen, Germany). Images were captured by using transmission bright field microscopy with the objective lenses magnifying 10×, 20×, and 40× and thus total magnifications of 100×, 200 x, 400 x. ImageJ software was used to insert the scale bar. The fluid gel samples have been diluted with Milli-Q water (1:5) after it was carefully transferred on a microscope slide. The diluted sample was stained with toluidine blue solution (0.1 % wt) to enhance contrast.
2.5. Particle size determination
To determine the particle size distributions, static light scattering experiments have been performed with the LS 13320 laser diffraction particle analyzer by Beckmann Coulter, enabling particle size detections in the range of 0.040–2000 μm.
The particle size was analyzed based on the theory of the Fraunhofer model, which is provided by the supplier's software. For this calculation, no additional data such as refractive index or absorption coefficient were needed. In order to avoid multiple scattering, samples were diluted by the particle size analyzer. The sample was pipetted into the measuring cell filled with distilled water until a certain obscuration was reached. Triplicate measurements were performed to determine the average distribution.
2.6. Texture analysis
For the texture analysis, the samples were stored and tested in transparent round boxes (d = 16.5 mm; h = 12 mm; Licefa GmbH & Co. KG, Germany) with airtight sealed lids. The gel strength measurements of the different concentration of the fluid gels were carried out at room temperature (22 °C) in triplicate measurements, using the Z005 AllroundLine texture analyzer by Zwick Roell attached with a 50 N cell.
The texture analyzer set-up was chosen as a cylindrical shaped stainless steel stamp (d = 1 mm), which penetrates the sample at a constant speed of 10 mm/min, with 15 cycles and a strain increase of 5% at the point of load application of each cycle. The plunger first punctured the sample for a strain of 5% of the initial height, returned to its starting position, and moved downwards to puncture the sample again to a strain increased by 5%. The processes were repeated until the sample was finally punctured to 75% strain of the initial height. In addition, deformation cycles were performed with no resting time in between. A trigger force of 0.002 N was set to determine a reproducible zero point.
2.7. Tribology
The friction of the different concentrations of produced fluid gels was measured using a Tribo-Rheometry Accessory available for Discovery HR-3 Rheometers (TA Instruments). The measurements were performed at 25 °C.
In the set-up for the tribology test, a three balls on a plate geometry was used, which for the upper part consisted of three spheres arranged on a circular plate with a radius of 15 mm and a lower plate attached with a silicon substrate. The contact surface of the tribopairs consisted of a stainless steel ball and a silicon rubber with a diameter of 40 mm and a thickness of 0.5 mm. The stainless steel balls provided by the manufacturer of the DHR-3 Rheometer are hemispheres with a diameter of 7.9375 mm (5/16″), which maintain point contact with the silicon surface. The hemispheres can be screwed onto the plate, which is attached to a helical-spring-like aluminum beam coupling suitable for load forces <20 N. This self-aligned design ensures uniform solid-solid contact and axial force distribution between the surfaces. This allows axial compliance to provide uniform axial force control for good alignment between the two surfaces and even distribution of normal force during rotation (specified by Trios manual 2019). For stable temperature control, the lower plate geometry is attached to the Peltier plate of the DHR-3 Rheometer. The tribology measurements were performed at 25 °C and fluid gel samples were carefully placed onto the silicon surface using a spatula. Normal forces of 3 N were used which resembles the normal forces applied during oral processing (He et al., 2018; Laiho et al., 2017; Nguyen et al., 2017), and the sliding speed was conducted from 100 to 1000000 μm/s by rotating the upper three ball geometry while the lower plate geometry is stationary. The tribology tests were carried out in triplicate. Using the trios software the friction force FF and friction coefficient μ were calculated for the three balls on plate geometry, with the torque M as an independent variable (see Table 1). Thus, the friction coefficient was calculated as the ratio of the measured friction force to the normal force FN and is given as a function of the sliding speed (μm/s) for each testing.
Table 1.
The quantities used are FN: normal force (N); FF; friction force (N); M torque (Nm); d: arm length at 0.015 m.
| Friction coefficient μ | |
| Friction force FF | |
| Friction coefficient μ | |
2.8. SEM
Scanning electron microscopy was implemented by using a Hitachi SU 8000 (Hitachi, Krefeld; Germany) with an acceleration voltage of 0.750 kV between 0.487 and 0.750 kV to examine the structure of the network of different concentration of the fluid gels. The fluid gels were cooled rapidly with liquid nitrogen before placing in a freeze dryer (Christ Alpha 1–2 LD plus). After drying overnight, the completely freeze-dried samples were then carefully placed on the SEM sample stubs and transferred to the microscope.
3. Results and discussion
3.1. Formulation and characterization of agarose fluid gels
Agarose fluid gels were prepared by using a rheometer having a cup and a vane geometry in a Peltier concentric cylinder system. The advantage of this “in-situ” method for preparing fluid gels is that gelation takes place at a constant, permanently imposed shear rate, thus ensuring the preparation of fluid gels under controlled conditions such as shear rate and especially temperature rate (De Carvalho and Djabourov, 1997). As agarose is only soluble in hot water it was heated up at 85 °C for 20 min with stirring to ensure complete hydration of agarose. Subsequently, the hot agarose solution was poured into the Peltier cup of the rheometer before measuring.
Fig. 1 exhibits the changes in viscosity for the different fluid gel concentrations of 0.5 % wt, 1 % wt and 2 % wt as the function of the time and the temperature. The sample was cooled from 85 °C to 25 °C at 1 °C/min rate and subsequently held for 15 min with a constant shear rate of 400 s− 1. The red line that shows a linear profile represents the temperature ramp and indicates the decreasing temperature between 85 °C and 25 °C, which was then kept at 25 °C. It can be seen for all agarose concentrations that there is an increase in viscosity with decreasing temperature. All three samples show a similar trend on change in viscosity: initially a gradual increase in viscosity as the temperature decreases; followed by a sharp increase in viscosity (indicated by the ellipse), which is later succeeded by a plateau region. Despite the higher viscosity within the whole measurement of the 2 % wt concentration sample, it also exhibits an earlier sharp increase of the viscosity (at about 33 °C) followed by the 1 % wt (at about 31 °C) and finally the 0.5 % wt (at about 27 °C) agarose sample concentration. The point where sharp increase in viscosity was detected is referred as ‘inflection point’ of the viscosity curve. This point is the one with the largest slope and thus indicates the largest change in viscosity value at a particular temperature. In this process, under imposed flow, a competing mechanism takes place between the gelation by physical cross-linking (via hydrogen bonds) and its breakup by the shear forces (De Carvalho and Djabourov, 1997).
Fig. 1.

Gelation under shear. Viscosity profile during agarose fluid gel production for the three concentrations: 0.5 % wt (black), 1 % wt (blue) and 2 % wt (green). The samples are subjected to a constant applied shear rate of 400 s−1 and were cooled from 85 °C to 25 °C at 1 °C/min and then held for 15 min at 25 °C. The thin red line represents the change of temperature with respect to the time. (For interpretation of the references to colour in this figure legend, the reader is referred to the Web version of this article.)
The region where the viscosity shows a sharp rise and exhibits an inflection point is the temperature at which the polysaccharide molecules undergo a sol-gel transition under shear conditions and begin to gel (De Carvalho and Djabourov, 1997). The gradual increase of the viscosity between 85 °C (0 min) and approximately 55 °C (30 min) corresponds to an Arrhenius behavior, whereas the slight steeper slope between 55 °C and 45 °C (40 min) indicated the beginning of the gelation. Agarose molecules begin to aggregate, forming helices and join to small (nano and micro) networks throughout the sample. This is in agreement with previous publications, the increase in viscosity was attributed to the initial association of individual biopolymer chains and their beginning of ordering to form double helices that begin to aggregate, and subsequently the formation of small gel nuclei which starts around the gelation temperature of the biopolymer (Norton et al., 1999). Further detailed studies on agarose gels with different concentrations and their modification has been done, suggesting a two-step gelation mechanism, by formation of double helices via hydrogen bonds and their aggregation into a three-dimensional network (Nordqvist and Vilgis, 2011). In addition, confocal laser scanning microscopy (CLSM) was used to show for the first time the network structure of different agarose concentrations, densifying with increasing concentration (Russ et al., 2013). In fact, the observation that the gelling temperature increases with increasing agarose concentration is a consequence of faster gelation due to a higher number of particles. Thus, a higher agarose concentration is associated with a higher volume fraction and thus a higher viscosity (Norton et al., 1999).
For the agarose used in this study, the gelling temperature would be between 34 and 35 °C, as stated by the manufacturer. With further decreasing temperature, the starting gel nuclei further grow until an equilibrium particle size is reached, which is controlled by the shear regime. The temperature range in which the rapid viscosity increase occurs, indicated by the ellipse in Fig. 1, represents as mentioned above the aggregation of the multiple helices of the agarose chain polymers, into micro gel cluster.
In addition, fluid gel production with the rheometer was also performed with different shear rates, temperature rates, and other geometries such as parallel-plate and cone-plate geometry (refer the supporting information). It was observed that all these parameters have an effect on viscosity and modulus. As the shear rate decreased (800 s−1, 400 s−1, 200 s−1), the viscosity increased as well as the modulus (shown in the supporting information, Figure S1 (a-b)). This is in agreement with previously reported studies (Farrés et al., 2014; Gabriele et al., 2009; Norton et al., 1999). However, at shear rate of 800 s−1, increasing the temperature cooling rate from 1 °C/min to 3 °C/min showed a shift in the sharp increase in viscosity to lower temperatures (by about 4 °C), but no change in viscosity and modulus at 25 °C. As already mentioned, due to the faster cooling rate, gel formation dominates and the average particle size becomes larger compared to the particle size for a slow cooling rate. Similarly, these previous studies emphasized that at high cooling rates, the shear forces are dominated by the gelation, resulting in the formation of larger gel particles.
At low cooling rates, applied shear dominates, resulting in the formation of smaller particles and a narrower size distribution (Gabriele et al., 2010; Moakes et al., 2015). However, in the case of the 3 °C/min cooling rate, even though the gelation was observed at a lower temperature, there was no effect on storage (G′) and loss (G″) moduli observed in the amplitude sweep. This can be explained by the fact that the shear rate of 800 s−1 is fast enough so that the breakup of the gel clusters dominates their formation. Thus, the faster temperature rate has no effect on the formation of the gel particles. This would be different for the slower shear rates, leading to higher storage (G′) and loss (G″) moduli. In previous works, a strong dependence on the temperature rate has been observed in terms of particle size reduction as a function of the applied shear rate (Farrés et al., 2014; Gabriele et al., 2009; Moakes et al., 2015; Norton et al., 1999). Moreover, the size of fluid gel particles was shown to be determined by the dynamic equilibrium between two competing factors with respect to the formation process: the shear rate vs. the cooling rate, which determines the molecular dynamics. At the beginning the chain dynamics matters and the center of mass of polymer chains scales with the inverse square root of the chain length, (). When gel clusters are formed, the most important time scale is given by the cluster diffusion, i.e., . While the growth of the gel nuclei is primarily controlled by the cooling rate, the breakup of the particles are controlled mainly by the shear rate (De Carvalho and Djabourov, 1997).
In addition, fluid gel preparation was also conducted within the rheometer using a parallel-plate geometry with a diameter of 40 mm and a cone-plate geometry with a diameter of 40 mm, a cone angle of 2°, and a truncation of 56 μm (shown in the supporting information, Fig. S2 (a)). The measurements were performed at different shear rates and the effect of the different geometries on the formation of agarose fluid gels was considered. These gels were collected for optical microscopy examination or remained in the rheometer for further amplitude sweep tests (shown in the supporting information, Fig. S2 (b) and S3 (a-b)). The purpose of this procedure was to investigate the extent to which the different geometries affect particle formation. Microscopic studies of agarose fluid gels using both geometries revealed microstructures of gel particles with similar shape and unordered chains present on the surface, but a larger particle size distribution when using the parallel-plate geometry. The viscosity profiles and amplitude sweep tests with the cone-plate geometry resulted in lower viscosity and storage (G′) and loss (G″) moduli at 25 °C compared to the parallel-plate geometry as shown in the supporting information, Figure S2 (a-b). This is due to the uniform shear conditions in the entire cone gap during the measurements, resulting in smaller aggregates. The values of the moduli G′ and G″ showed the same trend, that is, an increase of the modulus value when applying a lower shear rate and using the parallel plate geometry. However, in this work, for further characterization of agarose fluid gels, a vane geometry was applied for the preparation of larger quantities of agarose fluid gels using a DHR-3 Rheometer.
3.2. Characterization and particle size distribution of agarose fluid gels
To investigate the microstructure of the agarose fluid gels, light microscopy was used initially in order to support the results of particle size and rheology measurements. Fig. 2 shows the microstructure of the gel particles of the different agarose concentration 0.5 % wt, 1 % wt, 2 % wt, prepared with the rheometer using the vane cup geometry. The samples were diluted with Milli-Q water and stained with toluidine blue solution (0.1 % wt) for better contrast. In all sample concentrations, agarose fluid gels appeared as spherical like structure with dense core and unordered chains present on the surface. Fluid gels prepared under controlled shear and temperature conditions using a rheometer were first described as “hairy” (irregularly shaped) particles by Norton et al. (1999). The microscope image for the 0.5 % wt sample reveals approximately 200 μm large particles with hairy parts. On the other hand, the microstructure of the particles of the 1 % wt fluid gels exhibit slightly smaller size than the 0.5 % wt samples and a less hairy structure on the surface. Fluid gel samples with 2 % wt agarose show much smaller size at about 50 μm with even less hairy parts. The results of these microscopic observations suggest that with increasing concentration the particle size reduces and the numbers of unordered chains on the surface (hairy parts) decrease.
Fig. 2.

Optical microscopy picture of (a) 0.5 % wt, (b) 1 % wt and (c) 2 % wt agarose fluid gel particles stained with toluidine blue. The red arrows indicate the chains i.e. the “hairs” on the microparticle surface. (For interpretation of the references to colour in this figure legend, the reader is referred to the Web version of this article.)
In order to understand the differences in particle size and shape of fluid gel through microscopic investigations, the particle size distribution was examined. As particle size plays an important role in understanding rheological measurements and properties. Fig. 3 shows the particle size determination, which indicates variations in particle size distribution at different concentrations of agarose fluid gels. A slight decrease in mean particle size is observed with increasing concentration from 0.5 % wt to 1 % wt for fluid gels. However, a greater decrease in particle size is observed for the 2 % wt sample with significantly broader particle size distribution. Thus, this result of particle size determination is in accordance with the microscopic observations.
Fig. 3.

Particle size distribution of fluid gel particle with different agarose concentration.
The observation that the particle size decreases with increasing concentration can be described to lowest order using Einstein diffusion laws at low Péclet number of a particle (see equation (1)). This equation defines a relationship between particle size and viscosity of the sol phase, which is also determined by the shear rate (De Carvalho and Djabourov, 1997). That is, increasing concentration results in a broader size distribution and a smaller mean diameter. These experimental observations are consistent with findings from the literature and previous studies that reported a trend of decreasing particle size with increasing concentration of various biopolymers such as agar, alginate, whey protein and carrageenan (Farrés et al., 2014; Garrec and Norton, 2012; Norton et al., 1999).
3.3. Rheological properties
In order to understand the viscoelastic and flow properties of the different concentrations of agarose fluid gels, these systems were characterized with various rheological methods. Moreover, it was of interest to investigate how the size and shape of the gel particles influence this mechanical behavior.
Fig. 4 shows the result of the amplitude sweep of the different concentrations of the agarose fluid gels. In Fig. 4, the mean value and the standard deviations of the elastic and viscous moduli as a function of the strain for the different fluid gel concentrations is plotted. For all samples, storage (G′) and loss (G″) moduli exhibit a constant plateau value of G′ and G″ followed by a decrease in moduli as the applied strain increases. As expected, storage (G′) and loss (G″) moduli increase with increasing concentration of agarose. The 2 % wt fluid gel sample measurement displays approximately 920 Pa as the highest storage modulus, whereas the storage modulus of the 1 % wt sample is lower with a value of about 370 Pa and the storage modulus for the 0.5 % wt exhibits the lowest value of about 130 Pa. Thus, all samples exhibit unsurprisingly an elastic dominated behavior (gel-like or solid structure) at the linear viscoelastic (LVE) range.
Fig. 4.

Amplitude sweep profile of agarose fluid gels with 0.5 % wt (black), 1 % wt (blue) and 2 % wt (green) concentration. Dependence of G′ (filled symbols) and G″ (empty symbols) on strain at constant frequency (ƒ = 1 Hz) and temperature (T = 25 °C). The vertical dashed lines indicate the limit of the LVE range γL (also called yield point). (For interpretation of the references to colour in this figure legend, the reader is referred to the Web version of this article.)
Furthermore, each concentration of the fluid gels exhibits a slight increase and a maximum of the loss modulus G″ at larger deformation (between approximately 0.2% and 2% oscillation strain) before the final decrease; more pronounced for the 0.5 % wt and 1 % wt, although a bump for the sample with 0.5 % wt is more distinct. This observation of the G″ peak with increasing deformation suggests an interconnected network of gel particles formed by cross-linked polymers. The rise of G″ is an indication of an increase in the deformation energy transferred to the environment before parts of the inner structure are deformed and finally the interparticle connectivity is disturbed. The occurrence of the G″ bump could be explained by the relative motion of molecules of free dangling chain ends, such as the disordered chains as mentioned earlier, which are found at the surface of the “hairy” particles. Besides, long network bridges which are not permanently embedded in the network could be responsible for this observation (Hyun et al., 2002; Hyun et al., 2011; Mezger, 2010). In addition, the G′ bump at high deformation larger than 100–1000% strain can be attributed to the jamming of the gel particles, leading to an earlier occurrence of the 2 % wt fluid gel due to the dense packing and higher concentration, which in turn yield stiffer and less deformable particles, followed by the 1 % wt and 0.5 % wt agarose fluid gels.
When comparing the LVE range within the different concentrations, a nonlinear correlation with the concentration is revealed in contrast to the linearity of the moduli with the concentration. The plateau where structures remain intact is known as the linear viscoelastic (LVE) range. In Fig. 4, the vertical dashed lines indicate the limit of the LVE range (also called yield point), i.e. the range until which the tests are performed without destroying the samples or initiating flow through the required applied strain. The LVE limit γL was calculated as the strain required to decrease the storage modulus (G′) by 10% from the LVE range. This reveals that the 1 % wt sample having the shortest LVE range with γL = 0.08 (±0.03) %, followed by the 2 % wt sample with γL = 0.15 (±0.07) % and finally the 0.5 % wt sample displaying the highest limit of LVE value with γL = 0.21 (±0.03) %. Earlier studies on fluid gels conclude that an increase in hydrocolloid concentration results in an increase in storage modulus, but also an increase in the limit of the LVE range, due to enhanced particle interaction (Ellis et al., 2017).
For better understanding and further interpretation of the obtained findings, based on all experimental results mentioned earlier, such as microscopy examinations, particle size determination and amplitude sweep tests, a schematic model is shown in Fig. 5.
Fig. 5.

Schematic model of fluid gel particle size and shape with varying agarose concentration (a) 0.5 % wt, (b) 1 % wt and (c) 2 % wt. The fluid gel of 0.5 % wt agarose is drawn with slightly larger particle size compared to 1 % wt and higher proportion of unordered chains on the surface. Whereas the 2 % wt sample shows the smallest particle size and the least proportion of unordered chains on the surface.
As can be seen in Fig. 5 (a), the particles of the 0.5 % wt fluid gel sample are largest with a very high proportion of disordered chains projecting at the surface. The 1 % wt gel particles (Fig. 5 (b)), illustrated here with slightly smaller size, exhibit fewer chains on the particle surface. Finally, the 2 % wt fluid gel samples show the smallest particle sizes with considerably fewer chains (hairy parts) on the particle surface. As mentioned before, the increase of the storage modulus with increasing agarose concentration can be explained by increased particle interaction, especially the higher percolation between the smaller particles, which is caused by the higher volume fraction. This is clearly indicated for the 2 % wt sample compared for the 1 % wt and more distinctly for the 0.5 % wt fluid gel.
However, when looking back at the LVE range (Fig. 4), the observed nonlinearity with respect to the concentration can be visualized with the illustration in Fig. 5. The LVE limit of the 2 % wt sample, which is between that of the 0.5 % wt and 1 % wt sample, can obviously be explained by the higher uniform density due to the volume fraction and smaller particles that require some deformation until the particles slide against each other and finally the whole superstructure breaks down. In contrast, when comparing the LVE range of the 0.5 % wt with the 1 % wt sample, the latter exhibits a shorter LVE range. This is not consistent with the previous explanations and understanding. Since, as mentioned above, the particles of the 1 % wt sample are slightly smaller but have a larger volume fraction than those of the 0.5 % wt sample. However, this observation can be explained by the larger proportion of the hairy parts of the particles of the 0.5 % wt sample, which begin to interpenetrating one another and entangled with increasing deformation, resulting in an extended LVE range.
To investigate the flow behavior of the same fluid gel samples and to support the results of the previous amplitudes sweep, Fig. 6 shows the shear rate dependent viscosity profiles obtained by performing the flow sweep test.
Fig. 6.

(a) Flow behavior of the agarose fluid gel with different concentration: 0.5 % wt (black), 1 % wt (blue) and 2 % wt (green). (b) Viscosity of the different fluid gel concentrations at low shear rate, with the 0.5 % wt concentration having a higher viscosity value than the 1 % wt concentration due to entanglement of the chain on the particle surface. (For interpretation of the references to colour in this figure legend, the reader is referred to the Web version of this article.)
The viscosities were measured initially for increasing and subsequently decreasing shear rate. As expected, the viscosity of all tested fluid gels decreases with increasing shear rate and thus shows a shear-thinning behavior. Moreover, an increase in viscosity with increasing agarose concentration is observed, especially noticeable at higher rates above 100 s−1. At these high shear conditions, the particles move along each other and are strongly deformed under the exposed stress. Since fluid gels produced with higher agarose concentrations yield stiffer and less deformable particles, the result is an increase in shear viscosity at high shear conditions.
This trend is in agreement with previous studies of viscosity measurements in relation to hydrocolloid concentrations, which show this typical tendency of linearity between the increasing shear viscosity with increasing concentration of hydrocolloids (Ellis et al., 2017; Garrec et al., 2013; Moakes et al., 2015).
However, considering low shear rates, a discrepancy can be observed, as shown in Fig. 6 (b). While the concentration of the 2 % wt fluid gel still has the highest viscosity, when comparing the 0.5 % wt with the 1 % wt sample, it can be seen that the former has a higher viscosity despite a lower concentration. Again, this cannot be explained by considering particle sizes (approximately the same size) or volume fraction only and seemingly contradicts according to the current explanations and understanding. Referring to the schemes in Fig. 5, it is likely that the higher proportion of the projecting tails play a significant role. At rest, the chains of the aggregate helices become entangled with each other, which leads to higher friction and thus an increase in viscosity at this very low shear rate. This nonlinear trend and observation applies to both the upward and downward curves of the flow sweep test.
Further, Fig. 7 (a) shows the result of the frequency sweep of the respective fluid gels, with storage (G′) and loss (G″) moduli in dependence of frequency at constant strain ( = 0.05%). This was carried out to describe the time-dependent behavior of the fluid gels and to understand the mechanical reaction at small oscillation strains in the range of non-destructive deformations, i.e. in the LVE range. Also here it can be visualized, how the moduli increase as expected with increasing concentration. Moreover, it can be seen that the moduli of the respective fluid gels increase slightly with increasing frequency. This can be explained as follows: The fluid gel particles moving at a certain frequency experience only a negligible change at low frequency. They are surrounded by other particles which, when sheared slowly, all followed simultaneously. As the frequency increases, the particle's movement becomes faster. The dangling chains on the particle surfaces, which are quite flexible, also move and show an earlier motion as the frequency increases, while the centers move more sluggishly. With increasing frequency, the particles are pushed together and interfere with each other, as do these dangling chains. Since the agarose gel particles are in a good solvent, this causes the hydrophilic chains to protrude from the surface of the particles into the continuous phase due to the surrounding water. Thus, the higher the frequency, the more the chains can interfere with each other. When these chains move faster and follow with the frequency, the excluded volume becomes smaller. This in turn implies that the chains interfere even more with each other. This description is consistent when considering the loss moduli as a function of frequency for all three fluid gels in Fig. 7 (a). While the 0.5 % wt fluid gel sample shows an increase in loss modulus (G″) at a frequency below 1 rad/s, the 1 % wt sample displays a G″ increase above 1 rad/s, whereas the 2 % wt sample reveals a relatively constant G″ curve over the entire frequency range. As already explained, the chains on the surface swing with increasing frequency and collide against the neighboring chains causing a higher resistance. As a result, the loss modulus i.e. the viscous part increases with the frequency. In other words, the loss modulus can be attributed to the movement of the dangling chains on the surfaces. Since the “hairy” parts decrease with increasing concentration, this effect is most pronounced for the 0.5 % wt sample, followed by the 1 % wt and finally barely for the 2 % wt agarose fluid gel sample. As mentioned previously, it is known that agarose releases water and that syneresis is higher with decreasing concentration (Nishinari & Fang, 2016, 2017). The microgel particles consist of a center with a dense three-dimensional network that retards syneresis and has a higher water-binding capacity than the dangling chains, which have a lower water-binding capacity compared to the bulk systems. This is in accordance with previous studies on water properties in concentrated agarose gels by Watase, M., Nishinari, K., and Hatakeyama, T. (Watase et al., 1988). Based on differential scanning calorimetry measurements, these authors proposed a higher water binding capacity of the junction zones i.e. in the denser network region. In this study, however, this is more likely to be the case with samples containing 2 % wt fluid gels with a denser network core and less “hairy” parts. Whereas the 0.5 % wt samples have a less dense network core, but much more “hairy” parts on the microparticle surface. At this point it can be noted that more syneresis would be expected with the 0.5 % wt and 1 % wt fluid gel samples than with the 2 % wt sample. However, the exuded water on the surface of the microgel particles might have an impact on the frequency-dependent properties of the fluid gels, as it could interact with the dangling chains of the particulate gel suspension. Thus, this released water is held by the dangling chains through hydrogen bonding. In addition, at the same time, the released water also acts as a solvent on the surface of the microgel particles and is therefore responsible for the unique smooth texture and plasticity of the agarose fluid gel. The water released is very fast in its dynamics and the diffusion of the water molecules to the surface depends on their mobility and speed. Additionally, the water has a much faster time scales than the polymer chains. It is not clarified to what extent these water molecule dynamics contribute significantly to the frequency dependence of the storage and loss moduli compared to the “hairy” parts. Nevertheless, the contribution of the dangling chains to the frequency dependence can be supported by other results in this study and thus play a crucial role in the mechanical behavior. On the other hand, it has been reported that the “hairy” particles have a larger hydrodynamic volume, which in turn affects the rheological properties and causes an increase in moduli (Holland et al., 2018). This in turn could be attributed to the increase in storage (G′) modulus for all three samples within these frequency ranges.
Fig. 7.

(a) Frequency dependence of storage and loss moduli G′ (filled symbols), G″ (empty symbols) and (b) Frequency dependence of tan (δ) at constant strain ( = 0.05%) and temperature (T = 25 °C) for agarose fluid gels with different concentrations 0.5 % wt (black), 1 % wt (blue) and 2 % wt (green). (For interpretation of the references to colour in this figure legend, the reader is referred to the Web version of this article.)
To obtain further information, tan (δ) was plotted against frequency for the frequency sweep test as shown in Fig. 7 (b). According to the tan (δ) profile, which is dimensionless and describes the ratio of the two parts of the viscoelastic behavior G″/G′, the value hardly differs with increasing frequency for 2 % wt agarose. This suggests that the 2 % wt sample is relatively constant over the entire frequency range and less frequency dependent compared to the other samples. On the other hand, for the fluid gel samples of 0.5 % wt and 1 % wt, a lower tan (δ) is observed at very low frequency or at rest. With increasing frequency, however, there is a sharp increase in tan (δ) and thus an increase in the viscous part, respectively a higher proportion of the loss modulus. The lower frequency dependence of the 2 % wt sample can be explained by the fact that the gel particles are densely packed and have a higher percolation. Therefore, the particles experience only a negligible change with frequency.
Conversely, the particles are less densely packed for the 0.5 % wt and the 1 % wt samples and therefore show an increase in loss modulus and viscous ratio at higher frequencies. Therefore, an easier flow behavior at higher frequency is obtained. When comparing the 0.5 % wt with the 1 % wt sample, this can perhaps be explained by the presence of the hairy part in addition to the previous explanation by the higher dependence on frequency due to packing. The tails on the surface of the particle, entangled at a very low frequency, have a higher elasticity, which corresponds to a low tan (δ). The sharp increase in the tan (δ) could possibly be caused by the fact that the entangled hairy part becomes disentangled under shear or frequency causing the particles to slide against each other and the sample to flow.
For the 0.5 % wt sample, this rise occurs earlier and ends at a higher tan (δ) value due to the higher proportion of the hairy parts that has disentangled. Additionally, it is obvious that 0.5 % wt has a lower concentration and thus a lower network structure, i.e. a lower elastic proportion.
3.4. Texture analysis
In previous publications on fluid gels, texture analysis was carried out on quiescently cooled agarose gels and the behavior obtained was assumed to be that of the individual particles of fluid gels of the same concentration. This was based on the findings that textural properties of the individual particles in a fluid gel system are the same as that of a quiescently cooled gel of the same hydrocolloid concentration (Gabriele et al., 2010).
To examine the textural properties of each of the fluid gel samples, the samples were penetrated by a stainless steel plunger. Textural properties of each of the fluid gel samples are shown in Fig. 8. Therefore, all the samples are punctured for a certain distance in strain and the responsive force was measured, which can be used to examine the gel strength and elasticity of the particles. This was carried out by performing a multi cycle deformation test in which the strain was gradually increased by 5% at each deformation cycle until the final strain set at 75%. The plotted force-strain (force-displacement) curves in Fig. 8 represent the resistance of the sample to deformation and indicate the elastic properties resulting from the slope at initial strain and hence the initial force response, respectively, the linear range of the initial force-strain curves. With each cycle and increasing strain, the responsive force also increased. This trend is observed for all fluid gels under investigation. As expected, the measured force of the respective deformation cycles increases with increasing concentration.
Fig. 8.

Multiple force-strain curves for 0.5 % wt (black), 1 % wt (blue) and 2 % wt (green) of agarose fluid gels. (For interpretation of the references to colour in this figure legend, the reader is referred to the Web version of this article.)
Nevertheless, the increase in measured force increases less and less with each successive cycle. As the concentration of fluid gels decreases, the maxima of the measured force increase to a lesser extent and the curves become flatter, i.e., softer. This softening becomes more pronounced with decreasing concentration and reflects the plasticity behavior of the sample. With respect to the maximum force obtained for each cycle, the values of the 2 % wt fluid gel are larger than those of the 1 % wt and the 0.5 % wt samples. The increase in the force implies that the dense cross-linking network in the particles lead to higher elasticity. Thus, it is suggested that the higher agarose concentration leads to a higher number of forming helices to aggregation, which in turn results in gel particles with more junction zones. This reflects the well-known correlation between the mesh size and the modulus, i.e. elasticity for cross-linked gels (De Gennes, 1979), which suggests the proportionality of the shear modulus with the cube of the invers mesh size of the gel. Furthermore, this could be verified by Russ et al. by confocal light scanning microscopy (CLSM) of agarose gels with different concentration. For this purpose, agarose molecules were stained with a fluorescence dye, which enable the visualization of the decreasing mesh size with increasing concentration (Russ et al., 2013). The increasing concentration of agarose polymers leads not only to denser cross-linked particles, but also to their higher connectivity, which causes a stronger percolation effect of the particles in the fluid gel and enables the formation of a resistant fluid gel network to a certain extent of deformation. These two facts lead to the observed increase of the measured force with increasing strain and are therefore also consistent with the considerations that the modulus of the individual particles of the fluid gels corresponds to the modulus of the same concentrations of the quiescent cooled gels (Gabriele et al., 2009). The 0.5 % wt sample shows an earlier and faster flattening with increasing cycle as compared to the 1 % wt sample, followed by the 2 % wt fluid gel sample. With each further puncturing of the stamp, the particles are subjected to increasing deformations. Due to the higher elasticity of the single particles of the 2 % wt sample, a less distinct flattening of the force with increasing strain can be observed. This results indicate, how the different length, thickness and shape of the tails contribute to the beginning elastic regime between 0% and roughly 10% strains. The samples with 0.5 % wt and 1 % wt show almost a linear elastic increase for the stress above 20% strain, which shows an interplay between network elastic form the cross-linked core and spatial rearrangement of the particles via frictional forces by the tails. On the contrary, the sample with 2 % wt agarose shows at higher strains (~ 50%) a slight increase of the force. This slight strain hardening corresponds to the elastic response of the densely packed gel particles with larger modulus. An additional note is that when the stamp is pulled up, the force becomes more negative as the concentration increases and with each increasing cycle.
The force generated when the plunger is pulled up from the sample, which is visible as a negative force area is the adhesiveness and is linked to the separation force from the puncture test. It defines the work required to overcome the attractive forces between the interconnected particles as well as the surface of the sample and the surface of the materials with which the sample is in contact. Moreover, it provides information about the attractive forces between particles within the fluid gels (Chen et al., 2008; Chen and Stokes, 2012; Kilcast & Roberts, 1998). From this experiments, it can be concluded that the higher particle connectivity of the higher agarose concentration is in agreement with the observed increased adhesiveness.
In addition, a three-cycle test was performed for each sample, by puncturing the sample to a maximum strain of 75%, then pulling back to its starting position and moving down to puncture the sample again to 75% strain (data not shown). When cycling until maximum strain of 75% and then back to minimum strain of the starting position, the responsive force hardly decreased after the second cycle. Since with a deformation of 75% strain during the first cycle, the samples had already been exposed to considerable deformation. Furthermore, when comparing this three-cycle test with the multi-cycle test, it was observed that the tips of the gradually increasing maximum forces of the individual curve of the multi-cycle test overlapped with the first curve of the three-cycle test. This in turn shows that the fluid gels, despite their liquid-like flow behavior, do exhibit elastic behavior due to the particles formed by cross-linked polymers.
3.5. Tribology of agarose fluid gels
Tribology measurements were carried out in order to examine the coefficient of friction of the agarose fluid gels in dependence of the concentration. The study of lubrication between two interacting surfaces and the behavior of fluid gels in a thin layer allows the results obtained from the tribology test to support the previous findings on bulk examinations. For the measurements, a normal load of 3 N was applied which represents the normal force applied during oral processing. Fig. 9 shows the Stribeck curve displaying the friction coefficient as a function of the increasing sliding speed conducted from 100 to 1000000 μm/s. For all systems, there is initially a slight increase in the coefficient of friction in the boundary regime, followed by sharp decrease as the sliding speed increases above 238 μm/s.
Fig. 9.

Stribeck curves with applied normal load of 3 N of fluid gels with different agarose concentration 0.5 % wt (black), 1 % wt (blue) and 2 % wt (green). Effect of the particle shape in the boundary regime (BL). The vertical dashed lines indicate the different lubrication regimes: boundary lubrication (BL), mixed lubrication and hydrodynamic lubrication. (For interpretation of the references to colour in this figure legend, the reader is referred to the Web version of this article.)
In former studies on the lubrication of agarose fluid gels, the increase in the coefficient of friction at low speeds has been interpreted due to the exclusion of particles from the gap between the two surfaces, resulting from a smaller lubrication thickness compared to the larger particle size (Gabriele et al., 2010). The sharp decrease in sliding speed between 250 μm/s and 600000 μm/s can be related to a dominated mixed regime that provides a maximum lubrication effect, where the surface of the stainless steel ball and the silicon substrate are separated by a thin layer of fluid gel particles, due to bulk entrainment and therefore barely touch each other (Chen and Stokes, 2012). A further increase of the sliding speed of more than 1000000 μm/s close to the hydrodynamic regime results in an increase of the friction for all three samples. It has been explained and observed in general measurements that the coefficient of friction and the separation distance between the two surfaces increases with the lubricant entrainment speed and thus due to the hydrodynamic pressure of the fluid gel flow (Shewan et al., 2019). Not surprisingly, as can be seen in Fig. 9, an increase in friction is observed with increasing concentration. Since the film thickness and friction induced at this high speed depends on the viscosity of the sample (Prakash et al., 2013). Moreover, the entrainment of the thin layer agarose particles was proposed by the mechanism based on micro-elastohydrodynamic lubrication (EHL), suggesting that the fluid dynamics is depended on the particle elasticity and thus affects the coefficient of friction (Meeker et al., 2004).
In contrast to the previously assumed lubricating properties with increasing concentration of hydrocolloids observed for bulk deformation and bulk flow, in Fig. 9 the coefficient of friction at low sliding speed (boundary regime) displays a somewhat unusual behavior. At this low sliding speed a non-linearity can be seen, revealing a higher friction coefficient for the 1 % wt fluid gel concentration followed by the 0.5 % wt and 2 % wt concentration. The lowest friction coefficient of the 2 % wt can be explained by the expectation that less deformable particles will provide lower friction results due to less surface contact, since stiffer particles have a larger modulus, greater elasticity and thus greater resistance to compressive forces (Farrés et al., 2014). Furthermore, the boundary friction decreases with particle volume fractions (Garrec and Norton, 2013). This suggestion regarding the friction in the boundary regime is in agreement with the findings in this study. However, these predictions are contradicted when comparing the coefficient of friction of the 0.5 % wt sample with that of the 1 % wt sample. However, they can be explained by the larger proportion of aggregated chains protruding from the particle surface. As shown in Fig. 10, the entanglements of the aggregated chains of the lower concentration samples lead to a lower frictional force in the boundary regime despite their lower elasticity. These observations are therefore consistent with the models shown in Fig. 5 and the findings of the viscosity measurements as well as the amplitude sweep (LVE-range) and the frequency sweep.
Fig. 10.

Schematic illustration of the proposed behavior of the gel particles of the fluid gel with varying agarose concentration (a) 0.5 % wt, (b) 1 % wt and (c) 2 % wt, between the two surfaces (stainless steel ball on silicon substrate) in the boundary regime. Not drawn to scale. (For interpretation of the references to colour in this figure legend, the reader is referred to the Web version of this article.)
Furthermore, it can be concluded that it is not only the higher volume fraction, but also the structure of the particles matters, especially their shape, the number of tails, their stiffness, and the core cross-link density. In case for the 0.5 % wt sample, the particles are still elastic at the beginning, although softer compared to the other samples, but the tails are much longer. The numerous tails can be pushed into each other at low sliding speeds, they become entangled and the friction increases. For the 1 % wt sample, there is an in-between, there are still enough tails, although less than for the 0.5 % wt sample, but they are much stiffer because of the higher cross-linking. At the same time, their center is denser cross-linked, thus harder compared to those of the 0.5 % wt. At low sliding speeds, therefore, the tails need to be deformed first, but then collide with the centers, which are also highly cross-linked. Furthermore, the particles of the 2 % wt sample are stiffer, but having smaller size. Also, they are smoother on the surface and with hardly any “hair”, thus nothing gets entangled. With the 2 % wt samples, more particles can pass through the gap between the two surfaces. They are therefore easier to orient at low sliding speeds, thus friction is lower, compared to the 0.5 % wt sample, not least due to the small size and smoother surface. However, at high sliding speeds, due to the dense packing, they jam just in front of the stainless steel ball before their entrainment and are squeezed and deformed until they fit between the gap respectively the ball slides over it, resulting in higher friction at high sliding speeds than for the others samples.
The syneresis and the water exuding from the surface of the particles could also have an influence on the tribological properties. The fact that the water on the surface acts as a lubricant between the particles and thus affects friction suggests that the effect of water release might influence tribological behavior. To explain this, as the higher water release is expected with decreasing concentration, more lubrication is provided and thus the subsequent effect on friction. However, the results of the coefficients of friction to be taken at low sliding speeds (boundary regime) cannot simply be attributed to the water: 1) Because the water obeys much faster time scales compared to the sliding speed; even though the water is still held via hydrogen bonding 2) the trend of friction in the boundary regime would have been linear with the syneresis instead of the current trend. Therefore, the structure of the gel particles, their shape, the core cross-link density and number of dangling chains is a decisive factor in this respect. Nevertheless, at higher sliding speeds from 10,000 μm/s, the effect of syneresis could be presumed, as the friction coefficient of the 0.5 % wt sample appears to be lowest, followed by the 1 % wt and finally the 2 % wt samples. The sliding speed is sufficiently fast so that the structural effects become less relevant. Therefore the influence of water as a lubricant can be more pronounced. Thus, the following assumptions could be made: The 2 % wt sample with the least water on the surface shows the highest friction, followed by the 1 % wt sample, while the 0.5 % wt sample, which releases the most water on the surface and therefore having more lubricant, exhibits the lowest friction.
3.6. Network structure analysis with scanning electron microscopy (SEM)
Fig. 11 shows SEM images of the different fluid gel concentrations. To provide supplemental structural information in addition to the results of the texture studies and the rheological as well as the lubrication properties, SEM was performed on all fluid gels prepared with the different concentrations. The results are shown in Fig. 11(a–c) and show fibril-like microstructure formed by interconnected pores surrounding the fibers with a wide size distribution up to several micrometers. Furthermore, it can be seen that, as expected, a denser network forms with increasing concentration. Thus, a densification of the network takes place. In particular, by comparing the images of 0.5 % wt and 2 % wt, the most significant difference can be noticed as the structure of the lowest concentration is observed as a less tightly packed structure compared to the higher concentrations and displays a far lower degree of network. In fact, the densification of the network taking place with increasing fluid gel concentration agrees very well with the dense packing and percolation illustrated in Fig. 5. From the findings of the micrographs, rheological and mechanical properties can be deduced, since the gel strength of the sample varies with the density of the structural patterns.
Fig. 11.

SEM images of freeze dried fluid gels with (a) 0.5 % wt, (b) 1 % wt and (c) 2 % wt agarose concentration. Scale bars are, 100 μm for (a–c) top images and 10 μm for (a–c) bottom images.
4. Conclusion
In this work, we have investigated the underlying physical characteristics of agarose fluid gels and their structural influence on rheological, mechanical as well as tribological behavior. We have shown how their particle size and shape with varying agarose concentration affect the bulk properties and friction behavior under thin film conditions and have proposed a model that explains the underlying effect of microstructure on viscoelastic and flow behavior.
Continuous and oscillatory measurements including flow sweep, amplitude sweep and frequency sweep were performed to obtain the viscosity and viscoelastic properties of the microgel particles, affected by the microstructure of the gel particles as the result of varying agarose concentration (0.5 % wt, 1 % wt and 2 % wt). It is shown that the storage and loss modulus increases with increasing concentration as expected, however, a discrepancy appears when considering the LVE limit and the viscosity at low shear rate. The 1 % wt fluid gel exhibited the shortest LVE range and the lowest viscosity at low shear rate. Furthermore, investigation of the microstructure by microscopy and particle size determination concluded that the presence of disordered helically aggregated polymer chains on the particle surfaces plays an important role in this nonlinearity with respect to the rheological properties. It was observed that with increasing concentration of agarose, the particle size and disordered chains present on the particle surface decreased.
However, the LVE limit of the 2 % wt sample, which lies between that of the 0.5 % wt and 1 % wt samples, can be explained by the enhanced percolation between the particles due to its volume fraction and smaller particle size. In contrast, the larger LVE range of the 0.5 % wt sample compared to the 1 % wt fluid gel sample and also its higher viscosity at low shear rate can be explained by the entanglement of the agglomerated helical polymer chains leading to increased particle interaction.
Moreover, tribology measurements provided supportive results and showed a higher coefficient of friction for the 1 % wt fluid gel concentration at low sliding velocity (boundary regime), followed by the 0.5 % wt and 2 % wt concentrations. In addition, the texture analysis provides a correlation between the bulk rheology and the thin film rheology. In the case of the 2 % wt sample, the increase in force is an indication that the dense cross-linking network in the particles leads to higher elasticity. This is consistent with the increasing coefficient of friction in the hydrodynamic regime, but also with the lower coefficient of friction in the boundary regime due to the lower surface contact resulting from the stiffer particles and higher elasticity.
It is further clear, how the shape of the particles matter. The length of the tails, their elasticity compared to the elasticity of the denser center and the shape dependent bending energy of the tails are definitely the most important physical quantities, which determine the rheological behavior, as well as the friction of the fluid gels. These depend on the macroscopic process parameters, here just the mixing speed, and the concentration of the hydrocolloids. These pure physical insights provide methods of a special design of fluid gels for use in dysphagia.
Future studies on network structure are required to provide additional correlation between the network meshes of the gel particles and their experimental properties shown in this work and predictive models. Overall, the results have shown the importance of combining different methods for fundamental understanding in the formation of fluid gels, as they serve as a simple physical model system to better understand the behavior of water-rich and structured foods.
CRediT authorship contribution statement
Marta Ghebremedhin: Conceptualization, Writing- original draft, Methodology, Investigation, Validation, Visualization. Sebastian Seiffert: Supervision, Conceptualization. Thomas A. Vilgis: Supervision, Conceptualization, Writing – review & editing, Visualization.
Declaration of competing interest
The authors declare that they have no known competing financial interests or personal relationships that could have appeared to influence the work reported in this paper.
Acknowledgment
The authors would like to thank Dr. Kaloian Koynov and especially Andreas Hanewald for the technical support during rheology, tribology and texture analysis experiments. Furthermore we thank the members of the MPIP soft matter food science group for fruitful discussion and proofreading the manuscript.
Footnotes
Supplementary data to this article can be found online at https://doi.org/10.1016/j.crfs.2021.06.003.
Contributor Information
Marta Ghebremedhin, Email: ghebre@mpip-mainz.mpg.de.
Thomas A. Vilgis, Email: vilgis@mpip-mainz.mpg.de.
Appendix A. Supplementary data
The following is the Supplementary data to this article:
References
- Ako K. Yield study with the release property of polysaccharide-based physical hydrogels. Int. J. Biol. Macromol. 2017;101:660–667. doi: 10.1016/j.ijbiomac.2017.03.145. [DOI] [PubMed] [Google Scholar]
- Chen J., Feng M., Gonzalez Y., Pugnaloni L.A. Application of probe tensile method for quantitative characterisation of the stickiness of fluid foods. J. Food Eng. 2008;87(2):281–290. [Google Scholar]
- Chen J., Stokes J.R. Rheology and tribology: two distinctive regimes of food texture sensation. Trends Food Sci. Technol. 2012;25(1):4–12. doi: 10.1016/j.tifs.2011.11.006. [DOI] [Google Scholar]
- De Carvalho W., Djabourov M. Physical gelation under shear for gelatin gels. Rheol. Acta. 1997;36(6):591–609. doi: 10.1007/BF00367355. [DOI] [Google Scholar]
- De Gennes P.-G. Cornell university press; 1979. Scaling Concepts in Polymer Physics. [Google Scholar]
- Doi M., Edwards S.F. Oxford University Press (Clarendon; London New York: 1986. The Theory of Polymer Dynamics. [Google Scholar]
- Doi M., Edwards S.F., Edwards S.F. vol. 73. oxford university press; 1988. (The Theory of Polymer Dynamics). [Google Scholar]
- Ellis A.L., Norton A.B., Mills T.B., Norton I.T. Stabilisation of foams by agar gel particles. Food Hydrocolloids. 2017;73:222–228. doi: 10.1016/j.foodhyd.2017.06.038. [DOI] [Google Scholar]
- Farrés I.F., Moakes R.J.A., Norton I.T. Food Hydrocolloids Designing biopolymer fl uid gels : a microstructural approach. Food Hydrocolloids. 2014;42:362–372. doi: 10.1016/j.foodhyd.2014.03.014. [DOI] [Google Scholar]
- Fiszman S.M., Durán L. Effects of fruit pulp and sucrose on the compression response of different polysaccharides gel systems. Carbohydr. Polym. 1992;17(1):11–17. doi: 10.1016/0144-8617(92)90018-L. [DOI] [Google Scholar]
- Frith W., Garijo X., Foster T., Norton I. Special Publication. Royal Society of Chemistry; 2002. Microstructural Origins of the Rheology of Fluid Gels. [Google Scholar]
- Gabriele A., Spyropoulos F., Norton I.T. Kinetic study of fluid gel formation and viscoelastic response with kappa-carrageenan. Food Hydrocolloids. 2009;23(8):2054–2061. doi: 10.1016/j.foodhyd.2009.03.018. [DOI] [Google Scholar]
- Gabriele A., Spyropoulos F., Norton I.T. A conceptual model for fluid gel lubrication. Soft Matter. 2010;6(17):4205–4213. doi: 10.1039/c001907k. [DOI] [Google Scholar]
- Garrec D.A., Guthrie B., Norton I.T. Kappa carrageenan fluid gel material properties. Part 1: Rheology. Food Hydrocolloids. 2013;33(1):151–159. doi: 10.1016/j.foodhyd.2013.02.014. [DOI] [Google Scholar]
- Garrec D.A., Norton I.T. Understanding fluid gel formation and properties. J. Food Eng. 2012;112(3):175–182. doi: 10.1016/j.jfoodeng.2012.04.001. [DOI] [Google Scholar]
- Garrec D.A., Norton I.T. Kappa carrageenan fluid gel material properties. Part 2: Tribology. Food Hydrocolloids. 2013;33(1):160–167. doi: 10.1016/j.foodhyd.2013.01.019. [DOI] [Google Scholar]
- He Q., Bramante F., Davies A., Elleman C., Fourtouni K., Wolf B. Material properties of ex vivo milk chocolate boluses examined in relation to texture perception. Food and Function. 2018;9(6):3532–3546. doi: 10.1039/c8fo00548f. [DOI] [PubMed] [Google Scholar]
- Holland S., Tuck C., Foster T. Fluid gels: a new feedstock for high viscosity jetting. Food Biophys. 2018;13(2):175–185. doi: 10.1007/s11483-018-9523-x. [DOI] [PMC free article] [PubMed] [Google Scholar]
- Hyun K., Kim S.H., Ahn K.H., Lee S.J. Large amplitude oscillatory shear as a way to classify the complex fluids. J. Non-Newtonian Fluid Mech. 2002;107(1–3):51–65. [Google Scholar]
- Hyun Kyu, Wilhelm M., Klein C.O., Cho K.S., Nam J.G., Ahn K.H., McKinley G.H. A review of nonlinear oscillatory shear tests: analysis and application of large amplitude oscillatory shear (Laos) Prog. Polym. Sci. 2011;36(12):1697–1753. doi: 10.1016/j.progpolymsci.2011.02.002. [DOI] [Google Scholar]
- Imeson A. 3 agar. Food Stabilisers, Thickeners and Gelling Agents. 2009:31. [Google Scholar]
- Kilcast D., Roberts C. Perception and measurement of stickiness in sugar-rich foods. J. Texture Stud. 1998;29(1):81–100. [Google Scholar]
- Laiho S., Williams R.P.W., Poelman A., Appelqvist I., Logan A. Effect of whey protein phase volume on the tribology, rheology and sensory properties of fat-free stirred yoghurts. Food Hydrocolloids. 2017;67:166–177. doi: 10.1016/j.foodhyd.2017.01.017. [DOI] [Google Scholar]
- Li J.M., Nie S.P. The functional and nutritional aspects of hydrocolloids in foods. Food Hydrocolloids. 2016;53:46–61. doi: 10.1016/j.foodhyd.2015.01.035. 2016. [DOI] [Google Scholar]
- Mahdi M.H., Conway B.R., Smith A.M. Evaluation of gellan gum fluid gels as modified release oral liquids. Int. J. Pharm. 2014;475(1–2):335–343. doi: 10.1016/j.ijpharm.2014.08.044. [DOI] [PubMed] [Google Scholar]
- Meeker S.P., Bonnecaze R.T., Cloitre M. Slip and flow in pastes of soft particles: direct observation and rheology. J. Rheol. 2004;48(6):1295–1320. doi: 10.1122/1.1795171. [DOI] [Google Scholar]
- Mezger T.G. Vincentz Network GmbH & Co. KG; Hannover: 2010. Das Rheologie Handbuch: Für Anwender von Rotations- und Oszillations-Rheometern (3. Auflage) [Google Scholar]
- Moakes R.J.A., Sullo A., Norton I.T. Preparation and characterisation of whey protein fluid gels: the effects of shear and thermal history. Food Hydrocolloids. 2015;45:227–235. doi: 10.1016/j.foodhyd.2014.11.024. [DOI] [Google Scholar]
- Nguyen P.T.M., Kravchuk O., Bhandari B., Prakash S. Effect of different hydrocolloids on texture, rheology, tribology and sensory perception of texture and mouthfeel of low-fat pot-set yoghurt. Food Hydrocolloids. 2017;72:90–104. doi: 10.1016/j.foodhyd.2017.05.035. [DOI] [Google Scholar]
- Nishinari K., Zhang H., Ikeda S. Hydrocolloid gels of polysaccharides and proteins. Curr. Opin. Colloid Interface Sci. 2000;5(3–4):195–201. doi: 10.1016/S1359-0294(00)00053-4. [DOI] [Google Scholar]
- Nishinari K., Fang Y. Sucrose release from polysaccharide gels. Food and Function. 2016;7(5):2130–2146. doi: 10.1039/c5fo01400j. [DOI] [PubMed] [Google Scholar]
- Nishinari K., Fang Y. Relation between structure and rheological/thermal properties of agar. A mini-review on the effect of alkali treatment and the role of agaropectin. Food Struct. 2017;13(September):24–34. doi: 10.1016/j.foostr.2016.10.003. [DOI] [Google Scholar]
- Nordqvist D., Vilgis T.A. Rheological study of the gelation process of agarose-based solutions. Food Biophys. 2011;6(4):450–460. doi: 10.1007/s11483-011-9225-0. [DOI] [Google Scholar]
- Norton I.T., Frith W.J., Ablett S. Fluid gels, mixed fluid gels and satiety. Food Hydrocolloids. 2006;20(2–3):229–239. doi: 10.1016/j.foodhyd.2004.03.011. [DOI] [Google Scholar]
- Norton I.T., Jarvis D.A., Foster T.J. A molecular model for the formation and properties of fluid gels. Int. J. Biol. Macromol. 1999;26(4):255–261. doi: 10.1016/S0141-8130(99)00091-4. [DOI] [PubMed] [Google Scholar]
- Nowak C., Vilgis T.A. Rod-coil multiblock copolymers: structure and stability. EPL (Europhysics Letters) 2004;68(1):44. [Google Scholar]
- Prakash S., Tan D.D.Y., Chen J. Applications of tribology in studying food oral processing and texture perception. Food Res. Int. 2013;54(2):1627–1635. doi: 10.1016/j.foodres.2013.10.010. [DOI] [Google Scholar]
- Russ N., Zielbauer B.I., Koynov K., Vilgis T.A. Influence of nongelling hydrocolloids on the gelation of agarose. Biomacromolecules. 2013;14(11):4116–4124. doi: 10.1021/bm4012776. [DOI] [PubMed] [Google Scholar]
- Saha D., Bhattacharya S. Hydrocolloids as thickening and gelling agents in food: a critical review. J. Food Sci. Technol. 2010 doi: 10.1007/s13197-010-0162-6. [DOI] [PMC free article] [PubMed] [Google Scholar]
- Shewan H.M., Pradal C., Stokes J.R. Tribology and its growing use toward the study of food oral processing and sensory perception. J. Texture Stud. 2019;(May):1–16. doi: 10.1111/jtxs.12452. [DOI] [PubMed] [Google Scholar]
- Vilgis T.A. Gels: model systems for soft matter food physics. Current Opinion in Food Science. 2015 doi: 10.1016/j.cofs.2015.05.009. [DOI] [Google Scholar]
- Watase M., Nishinari K., Hatakeyama T. DSC study on properties of water in concentrated agarose gels. Food Hydrocolloids. 1988;2(6):427–438. [Google Scholar]
- Wolf B., Frith W.J., Singleton S., Tassieri M., Norton I.T. Shear behaviour of biopolymer suspensions with spheroidal and cylindrical particles. Rheol. Acta. 2001;40(3):238–247. doi: 10.1007/s003970000133. [DOI] [Google Scholar]
- Zimm B.H., Bragg J.K. Theory of the phase transition between helix and random coil in polypeptide chains. J. Chem. Phys. 1959;31(2):526–535. [Google Scholar]
Associated Data
This section collects any data citations, data availability statements, or supplementary materials included in this article.