

Abstract
The new type of coronavirus, COVID 19, appeared in China at the end of 2019. It has become a pandemic that is spreading all over the world in a very short time. The detection of this disease, which has serious health and socio-economic damages, is of vital importance. COVID-19 detection is performed by applying PCR and serological tests. Additionally, COVID detection is possible using X-ray and computed tomography images. Disease detection has an important position in scientific researches that includes artificial intelligence methods.
The combined models, which consist of different phases, are frequently used for classification problems. In this paper, a new combined approach is proposed to detect COVID-19 cases using deep features obtained from X-ray images. Two main variances of the approach can be presented as single layer-based (SLB) and feature fusion-based (FFB). SLB model consists of pre-processing, deep feature extraction, post-processing, and classification phases. On the other side, the FFB model consists of pre-processing, deep feature extraction, feature fusion, post-processing, and classification phases. Four different SLB and six different FFB models were developed according to the number and binary combination of layers used in the feature extraction phase. Each model is employed for binary and multi-class classification experiments.
According to experimental results, the accuracy performance for COVID-19 and no-findings classification of the proposed FFB3 model is 99.52%, which is better than the best performance accuracy (of 98.08%) in the literature. Concurrently, for multi-class classification, the proposed FFB3 model has an accuracy performance of 87.64% outperforming the best existing work (which reported an 87.02% classification performance). Various metrics, including sensitivity, specificity, precision, and F1-score metrics are used for performance analysis. For all performance metrics, the FFB3 model recorded a higher success rate than existing work in the literature. To the best of our knowledge, these accuracy rates are the best in the literature for the dataset and data split type (five-fold cross-validation).
Composite models (SLBs and FFBs), which are generated in this paper, are successful ways to detect COVID-19. Experimental results show that feature extraction, pre-processing, post-processing, and hyperparameter tuning are the steps are necessary to obtain a higher success. For prospective works, different types of pre-trained models and other hyperparameter tuning methods can be implemented.
Keywords: COVID-19 detection in X-ray images, Pre-trained models, Feature extraction, Deep features, Feature fusion, Data processing
1. Introduction
Various computer science concepts are frequently and recently employed in healthcare studies [1], [2], [3], [4], [5], [6]. There are classification, clustering, and regression researches employed for biomedical datasets which comprise visual and numerical data.
Infectious disease detection models have reached a much more important point due to the emergence of COVID-19 virus which initially appeared in China at the end of 2019. The first detected symptoms of this disease are fever, cough, and sore throat. In the later stages, pneumonia and shortness of breath can be observed. This virus, which has a very high spreading rate, has spread all over the world in a very short time [7]. Early diagnosis of this virus, which has fatal consequences, is vital. Although Polymerase chain reaction (PCR) and serological test methods are frequently used for COVID-19 determinations, there are increasing detection researches using X-ray and computed tomography images in the literature [2], [4], [8], [9], [10], [11], [12], [13], [14], [15], [16], [17], [18], [19].
X-ray, a form of electromagnetic wave, is employed to generate images of the interior of the human body. These images display the sections of the body in various tones of black and white. X-ray radiological images have recently been used for COVID-19 detection. Wang and Wong proposed COVID-Net to detect COVID-19 cases [2]. They used 8066 normal, 5526 non-COVID-19, and 53 COVID-19 X-ray images in their experiments, and reported an accuracy of 92.4% . In another study, COVIDX-Net was proposed by Hemdan et al. [10]. Their personally curated dataset included 25 COVID-19, and 25 normal images. According to their experimental results, a 90.0% success rate was achieved. Ioannis et al. used transfer learning from VGG19 pre-trained model and reported a 93.48% accuracy on test data for multi-class (COVID-19, Pneumonia, and healthy) classification [11]. Another transfer learning-based proposed method by Narin et al. [12] employed three different pre-trained models. They used 50 normal and 50 COVID-19 X-ray images in their experiments. The best result was obtained by the ResNet50 based model with a 98.0% accuracy performance. Sethy and Behra used a feature extraction method with a pre-trained model [13]. They subsequently classified the extracted features with an SVM algorithm. Twenty-five COVID-19 images and 25 non-COVID-19 images were used in their experiments and they reported an accuracy of 95.38%. A type of Bayesian CNN model was proposed by Ghoshal and Tucker [4]. Four different classes, comprising 68 COVID-19, 1583 normal, 2786 bacterial pneumonia, and 1504 viral pneumonia, were used in their experiments. The dataset was split as 80% for training and 20% for testing. The authors reported a classification performance of 89.82%. Ozcan proposed another transfer learning-based COVID-19 detection in X-ray images [14]. The author used 131 COVID-19, 200 normal, 242 bacterial pneumonia, and 148 viral pneumonia X-ray images. Subsequently, a grid search algorithm was used for hyperparameter optimization. According to the experimental results, a 97.69% accuracy rate was obtained by the ResNet50 based method. Ozturk et al. proposed a DarkCovidNet for detecting COVID-19 cases [20]. They applied their proposed method on two types of class splitting. Firstly, the proposed method was tested on a binary classification problem, which consisted of 125 COVID-19 and 500 no-findings cases. In their subsequent experimental studies, the proposed method was tested on a multi-class classification problem, which consisted of 125 COVID-19, 500 no-findings, and 500 pneumonia cases. They used the five-fold cross-validation test technique in their experimental simulations. According to the results, while a 98.08% accuracy was obtained for binary classification problem (for the two classes: COVID-19 and no-findings), a 87.02% accuracy was obtained for the multi-class classification problem (for the three classes: COVID-19, no-findings, and pneumonia). Saygili proposed a new approach to detect COVID-19 [18]. The model consists of five basic steps, which are data set acquisition, pre-processing, feature extraction, dimension reduction, and classification. Kedia et al. proposed a model to find COVID-19 infected patients by using X-ray images [19]. The model includes feature extraction from pre-trained models, feature concatenation, and SVM classification model. Accuracy, precision, recall, F1_score, and confusion matrix are used as performance metrics. According to the experimental results, the proposed combined model was successful on the dataset. This study aims to perform COVID-19 detection using X-ray images, and proposes two types of models. The first model is a single layer based (SLB) composite system. SLB models consist of 4 general phases. These are pre-processing, feature extraction, post-processing, and classification phases. In the pre-processing phase, input data is pre-processed according to the structure of the subsequent layer that carries out the feature extraction. In the next phase, feature extraction is performed on the preprocessed images. Feature extraction is a kind of dimensionality modification that efficiently expresses attractive parts of an image as a dense feature vector. Histogram of oriented gradients, speeded-up robust features, local binary patterns, and haar wavelets are some of the common feature extraction techniques. In recent years, deep learning methods have also been used for feature extraction. Pre-trained convolutional neural networks (CNN) models can be used for classification, feature extraction [13], [21], [22], [23], [24], and transfer learning [25], [26], [27], [28], [29], [30]. In the proposed models, pre-trained models, AlexNet [31], ResNet18 [32], and ResNet50 [32], are used for deep feature extraction from the X-ray radiography images. In the post-processing phase, which is the third stage, min–max normalization and movmean [33] operations are performed on the feature vectors. The aim of this phase is to reorganize the features and prepare the data as inputs for the subsequent classification method. Finally, in the classification phase, the post-processed data is split based on the five-fold cross-validation technique. Hyperparameter tuning is an effective way to increase the performance of the classification algorithm [26], [34], [35]. The training data is used for training by the auto hyperparameter tuning aided SVM classifier whereas the test data is used for testing the trained model. This step is repeated five times (because of the five-fold cross-validation). The mean values of the performance metrics (accuracy, sensitivity, specificity, precision, and F1-score) are generated and presented. Due to the number of feature extraction layers, four different SLB models (SLB1, SLB2, SLB3, and SLB4) are created. For the second proposed model, a feature fusion based (FFB) composite system is investigated. This type of method includes pre-processing, feature extraction, feature fusion, post-processing, and classification phases. The key difference of this method from the SLB method is the extraction of features from two different layers and subsequent fusing of the extracted features in the feature fusion phase. The motivation of feature integration is due to its successful studies in the literature [21], [36], [37], [38]. In the feature fusion phase, feature vectors are combined in series and the combined features are transferred to the post-processing phase. Six different FFB (FFB1, FFB2, FFB3, FFB4, FFB5, and FFB6) models are created with dual combinations of feature extraction layers.
All of the proposed models were evaluated by using the same dataset [39], and the data splitting, and testing type recommended in [20].
The main contributions of the paper are given below:
-
•
In this paper, a single layer-based (SLB) and a feature fusion based (FFB) composite systems are proposed to detect COVID-19 in X-ray images using deep features.
-
•
While both SLB and FFB composite methods include pre-processing, feature extraction, post-processing, and classification phases, the FFB method includes an additional phase, the feature fusion phase.
-
•
Four types of SLB (including AlexNet-fc6 (SLB1), ResNet18-pool5 (SLB2), ResNet18-fc1000 (SLB3), and ResNet50-fc1000 (SLB4)) and six types of FFB (including fc6-pool5 (FFB1), fc6-fc1000 (FFB2), fc6-fc1000 (FFB3), pool5-fc1000 (FFB4), pool5-fc1000 (FFB5), fc1000-fc1000 (FFB6)) were used in the experimental simulations.
-
•
The proposed FFB3 model, which has the best average recognition rate of 87.64% outperforms the existing work [20] that reported an 87.02% accuracy for multi-class (COVID-19, no-finding, and pneumonia) classification.
-
•
The proposed FFB3 model, which has the best average recognition rate of 99.52% exhibited a better performance than the existing work [20] that reported a 98.08% accuracy for binary (COVID-19 and no-finding) classification.
-
•
To the best of our knowledge, these accuracy rates are the best in the literature for the dataset and data split type.
The rest of this paper is organized as follows. The proposed SLB and FFB models are presented in Section 2. Section 3 describes the experimental studies including experimental setup and results. Lastly, Section 4 summarizes the conclusion and future works.
2. Methodology
In this paper, a single layer-based (SLB) and a feature fusion based (FFB) composite methods are proposed to independently detect COVID-19 in X-ray images using deep features. While both methods include pre-processing, feature extraction, post-processing, and classification phases, the FFB method includes an additional phase, the feature fusion phase. Pre-trained models, which are used for deep features, and proposed methods are presented in detail in the subsections.
2.1. Pre-trained models
Pre-trained CNN models can be used for transfer learning, feature extraction, and classification. Feature extraction from pre-trained models is an easy and effective way. In this study, AlexNet, ResNet18, and ResNet50 pre-trained CNN models are used for feature extraction in the proposed methods. The models and the layers that used as feature extractors are presented in subparts.
2.1.1. AlexNet
AlexNet, which won first place in the 2012 ImageNet Large Scale Visual Recognition Competition (ILSVRC), has 8 learnable layers including 5 convolution layers and 3 fully connected layers. that is the first fully connected layer is selected as feature extraction layer for both SLB and FFB proposed methods. 4096 features can be extracted by using layer.
2.1.2. ResNet18
ResNet18, which won first place in the 2015 ILSVRC, has 18 learnable layers. that is the fully connected layer and that is the pooling layer are selected as feature extraction layers separately for both SLB and FFB proposed methods. While 1000 features can be extracted by using the layer, 512 features can be extracted by using the layer.
2.1.3. ResNet50
ResNet50, which is a widely used resnet model, has 50 deep layers. that is the fully connected layer is selected as feature extraction layer for both SLB and FFB proposed methods. 1000 features can be extracted by using layer.
2.2. Single layer based proposed model
A single layer based (SLB) method includes pre-processing, feature extraction, post-processing, and classification phases as shown in Fig. 1. In the first phase, the inputs are resized based on the pre-trained model, which will be used for feature extraction. In the last stage of this model implementation, the channel length of the data is checked, and the one-dimensional inputs are transformed into three channels.
Fig. 1.

The architecture of the SLB method.
For the second phase, the layer of the pre-trained model is determined and used for feature extraction. The SLB models get their names based on the feature layers that are used for feature extraction. SLB1, SLB2, SLB3, and SLB4 models employ the layers fc6 (AlexNet), fc1000 (ResNet18), pool5 (ResNet18), and fc1000 (ResNet50) respectively as shown in Table 1. As shown in the table, the which belongs to the image input layer of the pre-trained model is for AlexNet and for the other pre-trained models. Lastly, defines the size of the extracted features from the feature layer for an input.
Table 1.
Details of SLB methods.
| SLB model |
Pre-trained model |
Input size |
Feature layer |
Feature vector |
|---|---|---|---|---|
| SLB1 | AlexNet | fc6 | 4096 | |
| SLB2 | ResNet18 | fc1000 | 1000 | |
| SLB3 | ResNet18 | pool5 | 512 | |
| SLB4 | ResNet50 | fc1000 | 1000 |
In the third phase, which is the post-processing phase, the extracted features are processed using the normalization and moving mean operation. For the normalization step, the data will be scaled so that its range is in the interval [0,1]. This normalization method, called min–max, is processed using Eq. (1) where is the th data point and represents the minimum value of the dataset while represents the maximum value. The Movmean function [33], which is used for the last step in this phase, returns a simple moving average of the given vector. The window size is optional. Movmean is adopted for backwards adaptability.
| (1) |
Finally, the classification phase is processed for the SLB methods. In this phase, the SVM classification method is used. SVM, which is one of the most popular machine learning algorithms, was proposed by Vapnik et al. [40]. This method, which is based on structural risk minimization and statistical learning theory, is an easy-to-implement flexible algorithm. Two groups can be separated by drawing a borderline between the groups in a plane. However, the location of the hyperplane should be in the position that is furthest from the members of the two groups. The SVM algorithm is employed to draw this optimal hyperplane. In this study, ‘fitcecoc’ [41], which is used for fitting multiclass models for SVM, is used in the experimental studies. The ‘OptimizeHyperparameters’ option is set to ‘auto’ for SVM. By this way, the hyperparameters of the SVM algorithm is tuned.
An example of simulating the SLB model with a sample data is given in Fig. 2. For this SLB model (SLB1), fc6 layer (AlexNet) is used for feature extraction. The pre-processing, feature extraction, and post-processing phases are also clearly presented.
Fig. 2.

The visualization of the proposed method for SLB1 with sample data.
2.3. Feature fusion based proposed model
The feature fusion based (FFB) methods are similar to SLB ones. The key difference between the FFB and SLB model is the two additional layers in FFB models which are used for feature extraction. After the feature fusion phase in the FFB model, the extracted features are merged. A schematic representation of the FFB method is presented in Fig. 3.
Fig. 3.

The architecture of the FFB method.
The variations of the FFB methods are named according to the combination order of the feature layers used. The details of the FFB methods are given in Table 2. In this table, is the name of the proposed feature fusion based model. and are the feature layers that are used for feature extraction. and are the sizes of the extracted features. Finally, is the combination of the and .
An example of the simulation of the FFB model with sample data is given in Fig. 4. For this FFB model (FFB3), fc6 layer (AlexNet) and fc1000 layer (ResNet50) are used for feature extraction. The pre-processing, feature extraction, feature fusion, and post-processing phases are shown in the figure.
Fig. 4.

The visualization of the proposed method for FFB3 with sample data.
Table 2.
Details of FFB methods.
| FFB model |
Layer1 | Feature Vector1 |
Layer2 | Feature Vector2 |
Fusion feature vector |
|---|---|---|---|---|---|
| FFB1 | fc6 (AlexNet) |
4096 | fc1000 (ResNet18) |
1000 | 5096 |
| FFB2 | fc6 (AlexNet) |
4096 | pool5 (ResNet18) |
512 | 4608 |
| FFB3 | fc6 (AlexNet) |
4096 | fc1000 (ResNet50) |
1000 | 5096 |
| FFB4 | fc1000 (ResNet18) |
1000 | pool5 (ResNet18) |
512 | 1512 |
| FFB5 | fc1000 (ResNet18) |
1000 | fc1000 (ResNet50) |
1000 | 2000 |
| FFB6 | pool5 (ResNet18) |
512 | fc1000 (ResNet50) |
1000 | 1512 |
3. Experimental studies
In this section, both SLB and FFB methods are applied to the dataset given in [20]. The experimental setup and experimental results are presented in Sections 3.1, 3.2, respectively.
3.1. Experimental setup
This subsection presents the setups required to perform the experimental simulations. In order to make a fair comparison, the dataset [39] and test technique used in the study [20] were adapted and implemented in this study. The dataset at [39] contains a total of 1125 samples including 125 COVID-19, 500 no-finding, and 500 pneumonia samples. Sample images in the dataset are shown in Fig. 5.
Fig. 5.

Sample images including COVID-19, no-finding, and pneumonia cases.
Five-fold cross validation (as shown in Fig. 6) was implemented during the model testing and evaluation. By this test technique, the data for each class is split into five parts. While four of the parts are used for training, the remaining part is used for testing. Thus, there were 5 different training–testing distinctions are made.
Fig. 6.
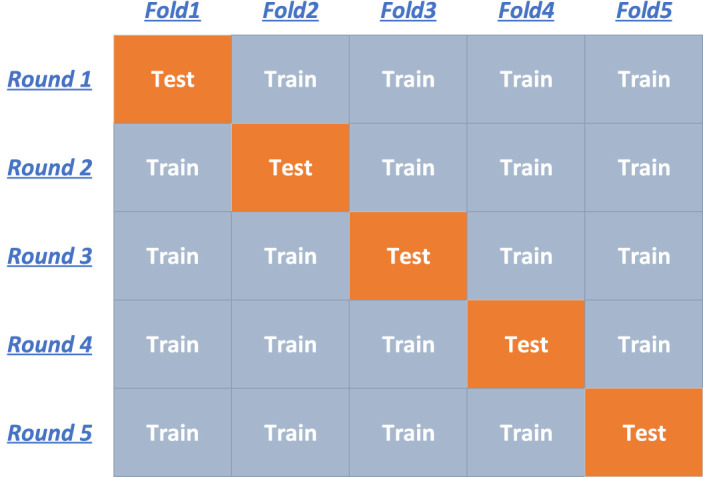
Schematic representation of the five-fold cross validation.
Apart from the accuracy rate, four different metrics were also used for additional performance analysis. The metrics, which are calculated in the same way (average of all classes) with existing work [20], are sensitivity, specificity, precision, and F1_score. Sensitivity is the ratio of the correctly positive labeled by the proposed model to all who are Covid-19 in reality, , when the class of COVID-19 is handled. Specificity is the ratio of correctly negative labeled by the proposed model to all who are not Covid-19 in reality. Precision is the ratio of the correctly positive labeled by the proposed model to all positive labeled for Covid-19. F1 Score considers both precision and sensitivity. It is the harmonic mean of precision and sensitivity [42]. Accuracy, sensitivity, specificity, precision, and F1-score are calculated using Eqs. (2)–(6), respectively.
| (2) |
| (3) |
| (4) |
| (5) |
| (6) |
In the equations, when the class of COVID-19 is handled, TP refers to correct COVID-19 cases, while TN expresses no-findings (or no-findings and pneumonia for multi-class classification simulations) cases. FP refers to no-findings (or no-findings and pneumonia for multi-class classification simulations) cases that were misclassified as COVID-19. Finally, FN refers to COVID-19 cases that classified as no-findings (or no-findings and pneumonia for multi-class classification simulations) cases.
All experimental simulations were run on Nvidia GTX 1080 Ti Turbo hardware with 11 GB Ram capacity using MATLAB programming environment.
3.2. Experimental results
In all experiments, both SLB and FFB methods were implemented to detect COVID-19 in X-ray images using deep features. In the SLB models, pre-processing, feature extraction, post-processing, and classification phases were implemented on the X-ray images. The pre-processing phase was applied to reform the data. Then, features were extracted from the deep layers of the pre-trained models. Afterwards, the extracted data was processed again in the post-processing phase. In this phase, min–max normalization and movmean functions were implemented respectively. For the last phase, the post-processed data served as an input to the SVM classifier. The option of hyperparameter optimization was set to ‘auto’ for selecting the near-optimal hyperparameters of the SVM classifier.
FFB methods include pre-processing, feature extraction, feature fusion, post-processing, and classification phases. Unlike SLB, FFB has two pre-processing operations, two feature extraction operations, and the feature fusion phase. In the phase of feature fusion, the extracted features are merged.
The proposed models (SLB1, SLB2, SLB3, SLB4, FFB1, FFB2, FFB3, FFB4, FFB5, FFB6) were simulated on the dataset [39], which was similarly employed in [20]. For a fair comparison, the dataset and test type was selected as implemented in [20].
The performance metrics were applied for all the proposed methods. The values of the performance metrics are given in Table 3 for binary classification. According to the results, the FFB3 proposed model, which includes features from fc6 (AlexNet) and fc1000 (ResNet50) layers, has the best values for all metrics. Additionally, the minimum objective values versus the number of function evaluations for the hyperparameter tuning of the FFB3 method are given in Fig. 7.
Table 3.
The experimental results for COVID-19 and no-findings cases using the proposed methods.
| Methods | Performance metrics (%) |
||||
|---|---|---|---|---|---|
| Accuracy | Sensitivity | Specificity | Precision | F1_Score | |
| SLB1 | 98.88 | 97.50 | 97.50 | 98.99 | 98.22 |
| SLB2 | 97.12 | 94.90 | 94.90 | 96.02 | 95.45 |
| SLB3 | 98.40 | 96.30 | 96.30 | 98.69 | 97.44 |
| SLB4 | 98.40 | 96.30 | 96.30 | 98.69 | 97.44 |
| FFB1 | 98.88 | 97.80 | 97.80 | 98.68 | 98.23 |
| FFB2 | 99.04 | 97.90 | 97.90 | 99.09 | 98.48 |
| FFB3 | 99.52 | 98.80 | 98.80 | 99.70 | 99.24 |
| FFB4 | 97.12 | 94.30 | 94.30 | 96.58 | 95.39 |
| FFB5 | 98.24 | 96.20 | 96.20 | 98.26 | 97.19 |
| FFB6 | 98.40 | 96.30 | 96.30 | 98.69 | 97.44 |
Fig. 7.

The minimum objective value vs. number of function evaluations for FFB3 method (binary classification).
A confusion matrix is accepted as another performance demonstrator. The confusion matrices, which were formed according to the predictions of the proposed models, are given in Fig. 8.
Fig. 8.

Confusion matrices (CM) of the proposed methods for binary classification.
The values of the performance metrics are given in Table 4 for multi-class classification. According to the results, the FFB3 model has the best values for all metrics except sensitivity. The minimum objective values versus the number of function evaluations for the hyperparameter tuning of the FFB3 method are given in Fig. 9. The confusion matrices, which are formed according to the predictions of the proposed models, are given in Fig. 10.
Table 4.
The experimental results for COVID-19, no-findings, and pneumonia cases using the proposed methods.
| Methods | Performance metrics (%) |
||||
|---|---|---|---|---|---|
| Accuracy | Sensitivity | Specificity | Precision | F1_Score | |
| SLB1 | 84.71 | 86.13 | 90.91 | 87.75 | 86.91 |
| SLB2 | 80.89 | 81.67 | 88.71 | 83.79 | 82.66 |
| SLB3 | 80.00 | 80.60 | 88.08 | 84.28 | 82.26 |
| SLB4 | 84.44 | 84.73 | 90.73 | 87.80 | 86.13 |
| FFB1 | 83.82 | 85.07 | 90.35 | 87.32 | 86.13 |
| FFB2 | 84.27 | 85.60 | 90.62 | 87.65 | 86.56 |
| FFB3 | 87.64 | 88.13 | 92.59 | 90.87 | 89.39 |
| FFB4 | 79.91 | 80.93 | 88.11 | 83.28 | 82.03 |
| FFB5 | 82.13 | 83.40 | 89.36 | 85.90 | 84.55 |
| FFB6 | 81.87 | 82.40 | 89.18 | 85.90 | 83.99 |
Fig. 9.

The minimum objective value vs. number of function evaluations for the FFB3 method (multi-class classification).
Fig. 10.

Confusion matrices (CM) of the proposed methods for multi-class classification.
The comparison of the FFB3 model and the study [20] is presented in Table 5. The results show that the FFB3 model is more successful than the existing method for both binary and multi-class classifications according to the reported performance metrics.
Table 5.
Comparison of the proposed FFB3 model with existing work [20].
| Number of | Methods | Performance metrics (%) |
||||
|---|---|---|---|---|---|---|
| classes | Accuracy | Sensitivity | Specificity | Precision | F1_score | |
| 2 classes |
Existing work | 98.08 | 95.13 | 95.13 | 98.03 | 96.51 |
| Proposed FFB3 | 99.52 | 98.80 | 98.80 | 99.70 | 99.24 | |
| 3 classes |
Existing work | 87.02 | 85.35 | 92.18 | 89.96 | 87.37 |
| Proposed FFB3 | 87.64 | 88.13 | 92.59 | 90.87 | 89.39 | |
4. Conclusion
COVID-19, a new infectious disease, has spread rapidly all over the world and has become a pandemic. Different methods are been used in the diagnosis of this disease, which has fatal consequences. In this study, classification was performed using lung X-ray images which are sometimes used in the diagnosis of COVID-19. The proposed methods are grouped into two main subgroups. The first involved a single layer based (SLB) method whereas the other is feature fusion based (FFB) model. While the SLB methods include pre-processing, feature extraction, post-processing, and classification phases, the FFB methods include pre-processing, feature extraction from two layers, feature fusion, post-processing, and classification phases. The third type of FFB (FFB3) method, which uses fc6 (AlexNet) and fc1000 (ResNet50) layers for feature extraction, provided more successful results for the binary classification experiments (based on performance metrics) than an existing method. On the other hand, the FFB3 approach, recorded higher success rates than an existing proposed method for the multi-class classification experiments.
For future works, the proposed methods can be used for the detection of other diseases. In this paper, fc6, fc1000, pool5, and fc1000 layers were used for feature extraction. Other layers from other pre-trained CNN models may be used for feature extraction. Similarly, other techniques can be implemented in the pre-processing and post-processing phases to improve performance. In this study, the SVM algorithm was used for classification. Other machine learning algorithms may be used for performance comparisons.
CRediT authorship contribution statement
Tayyip Ozcan: Conceptualization, Methodology, Software, Writing- original draft preparation, Writing reviewing & editing.
Declaration of Competing Interest
The authors declare that they have no known competing financial interests or personal relationships that could have appeared to influence the work reported in this paper.
References
- 1.Nweke H.F., Teh Y.W., Mujtaba G., Al-garadi M.A. Data fusion and multiple classifier systems for human activity detection and health monitoring: Review and open research directions. Inf. Fusion. 2019;46:147–170. doi: 10.1016/j.inffus.2018.06.002. URL http://www.sciencedirect.com/science/article/pii/S1566253518304135. [DOI] [Google Scholar]
- 2.Wang L., Wong A. 2020. COVID-Net: A tailored deep convolutional neural network design for detection of COVID-19 cases from chest radiography images. arxiv preprint arxiv:2003.09871. [DOI] [PMC free article] [PubMed] [Google Scholar]
- 3.Liao Q., Ding Y., Jiang Z.L., Wang X., Zhang C., Zhang Q. Multi-task deep convolutional neural network for cancer diagnosis. Neurocomputing. 2019;348:66–73. doi: 10.1016/j.neucom.2018.06.084. URL http://www.sciencedirect.com/science/article/pii/S0925231218312827 Advances in Data Representation and Learning for Pattern Analysis. [DOI] [Google Scholar]
- 4.Ghoshal B., Tucker A. 2020. Estimating uncertainty and interpretability in deep learning for coronavirus (COVID-19) detection. arxiv preprint arxiv:2003.10769. [Google Scholar]
- 5.Chen M., Zhou P., Wu D., Hu L., Hassan M.M., Alamri A. AI-Skin: Skin disease recognition based on self-learning and wide data collection through a closed-loop framework. Inf. Fusion. 2020;54:1–9. doi: 10.1016/j.inffus.2019.06.005. URL http://www.sciencedirect.com/science/article/pii/S1566253519300867. [DOI] [Google Scholar]
- 6.Guo Y., Shang X., Li Z. Identification of cancer subtypes by integrating multiple types of transcriptomics data with deep learning in breast cancer. Neurocomputing. 2019;324:20–30. doi: 10.1016/j.neucom.2018.03.072. URL http://www.sciencedirect.com/science/article/pii/S0925231218306222 Deep Learning for Biological/Clinical Data. [DOI] [Google Scholar]
- 7.Toğaçar M., Ergen B., Cömert Z. COVID-19 detection using deep learning models to exploit social mimic optimization and structured chest X-ray images using fuzzy color and stacking approaches. Comput. Biol. Med. 2020 doi: 10.1016/j.compbiomed.2020.103805. [DOI] [PMC free article] [PubMed] [Google Scholar]
- 8.Pereira R.M., Bertolini D., Teixeira L.O., Silla Jr C.N., Costa Y.M. COVID-19 identification in chest X-ray images on flat and hierarchical classification scenarios. Comput. Methods Programs Biomed. 2020 doi: 10.1016/j.cmpb.2020.105532. [DOI] [PMC free article] [PubMed] [Google Scholar]
- 9.Khan A.I., Shah J.L., Bhat M.M. Coronet: A deep neural network for detection and diagnosis of COVID-19 from chest x-ray images. Comput. Methods Programs Biomed. 2020 doi: 10.1016/j.cmpb.2020.105581. [DOI] [PMC free article] [PubMed] [Google Scholar]
- 10.Hemdan E.E.-D., Shouman M.A., Karar M.E. 2020. Covidx-net: A framework of deep learning classifiers to diagnose covid-19 in x-ray images. arxiv preprint arxiv:2003.11055. [Google Scholar]
- 11.Apostolopoulos I.D., Bessiana T. 2020. Covid-19: Automatic detection from X-Ray images utilizing transfer learning with convolutional neural networks. arxiv preprint arxiv:2003.11617. [DOI] [PMC free article] [PubMed] [Google Scholar]
- 12.Narin A., Kaya C., Pamuk Z. 2020. Automatic detection of coronavirus disease (COVID-19) using X-ray images and deep convolutional neural networks. arxiv preprint arxiv:2003.10849. [DOI] [PMC free article] [PubMed] [Google Scholar]
- 13.Sethy P.K., Behera S.K. 2020. Detection of coronavirus disease (COVID-19) based on deep features. Preprints. [Google Scholar]
- 14.Ozcan T. 2020. A deep learning framework for coronavirus disease (COVID-19) detection in X-Ray images. [Google Scholar]
- 15.Ardakani A.A., Kanafi A.R., Acharya U.R., Khadem N., Mohammadi A. Application of deep learning technique to manage COVID-19 in routine clinical practice using CT images: Results of 10 convolutional neural networks. Comput. Biol. Med. 2020;121 doi: 10.1016/j.compbiomed.2020.103795. [DOI] [PMC free article] [PubMed] [Google Scholar]
- 16.Goreke V., Sari V., Kockanat S. A novel classifier architecture based on deep neural network for COVID-19 detection using laboratory findings. Appl. Soft Comput. 2021;106 doi: 10.1016/j.asoc.2021.107329. URL https://www.sciencedirect.com/science/article/pii/S1568494621002520. [DOI] [PMC free article] [PubMed] [Google Scholar]
- 17.Gupta A., Anjum V., Gupta S., Katarya R. Instacovnet-19: A deep learning classification model for the detection of COVID-19 patients using chest X-ray. Appl. Soft Comput. 2021;99 doi: 10.1016/j.asoc.2020.106859. URL https://www.sciencedirect.com/science/article/pii/S1568494620307973. [DOI] [PMC free article] [PubMed] [Google Scholar]
- 18.Saygılı A. A new approach for computer-aided detection of coronavirus (COVID-19) from CT and X-ray images using machine learning methods. Appl. Soft Comput. 2021;105 doi: 10.1016/j.asoc.2021.107323. URL https://www.sciencedirect.com/science/article/pii/S1568494621002465. [DOI] [PMC free article] [PubMed] [Google Scholar]
- 19.Kedia P., Anjum V., Katarya R. CoVNet-19: A deep learning model for the detection and analysis of COVID-19 patients. Appl. Soft Comput. 2021;104 doi: 10.1016/j.asoc.2021.107184. URL https://www.sciencedirect.com/science/article/pii/S1568494621001071. [DOI] [PMC free article] [PubMed] [Google Scholar]
- 20.Ozturk T., Talo M., Yildirim E.A., Baloglu U.B., Yildirim O., Acharya U.R. Automated detection of COVID-19 cases using deep neural networks with X-ray images. Comput. Biol. Med. 2020 doi: 10.1016/j.compbiomed.2020.103792. [DOI] [PMC free article] [PubMed] [Google Scholar]
- 21.Bougourzi F., Dornaika F., Mokrani K., Taleb-Ahmed A., Ruichek Y. Fusion transformed deep and shallow features (FTDS) for image-based facial expression recognition. Expert Syst. Appl. 2020 [Google Scholar]
- 22.Minaee S., Kafieh R., Sonka M., Yazdani S., Jamalipour Soufi G. Deep-COVID: Predicting COVID-19 from chest X-ray images using deep transfer learning. Med. Image Anal. 2020;65 doi: 10.1016/j.media.2020.101794. URL http://www.sciencedirect.com/science/article/pii/S1361841520301584. [DOI] [PMC free article] [PubMed] [Google Scholar]
- 23.Li J., Zhang B., Lu G., Zhang D. Generative multi-view and multi-feature learning for classification. Inf. Fusion. 2019;45:215–226. doi: 10.1016/j.inffus.2018.02.005. URL http://www.sciencedirect.com/science/article/pii/S1566253517304852. [DOI] [Google Scholar]
- 24.Ma Y., Hao Y., Chen M., Chen J., Lu P., sir A.K. Audio-visual emotion fusion (AVEF): A deep efficient weighted approach. Inf. Fusion. 2019;46:184–192. doi: 10.1016/j.inffus.2018.06.003. URL http://www.sciencedirect.com/science/article/pii/S1566253518300733. [DOI] [Google Scholar]
- 25.Ozcan T., Basturk A. Performance improvement of pretrained convolutional neural networks for action recognition. Comput. J. 2020:1–12. [Google Scholar]
- 26.Ozcan T., Basturk A. Transfer learning-based convolutional neural networks with heuristic optimization for hand gesture recognition. Neural Comput. Appl. 2019;31(12):8955–8970. [Google Scholar]
- 27.Ozcan T., Basturk A. Lip reading using convolutional neural networks with and without pre-trained models. Balkan J. Electr. Comput. Eng. 2019;7(2):195–201. [Google Scholar]
- 28.Ozcan T., Basturk A. 2019 27th Signal Processing and Communications Applications Conference (SIU) 2019. Static image-based emotion recognition using convolutional neural network; pp. 1–4. [DOI] [Google Scholar]
- 29.Ozcan T., Basturk A. Static facial expression recognition using convolutional neural networks based on transfer learning and hyperparameter optimization. Multimedia Tools Appl. 2020;79(35):26587–26604. [Google Scholar]
- 30.T. Özcan, A. Baştürk, ERUSLR: Yeni bir türkçe işaret dili veri seti ve hiperparametre optimizasyonu destekli evrişimli sinir ağı ile tanınması, Gazi Üniv. Mühendislik MimarlıK Fakültesi Derg., 36 (1), 527–542.
- 31.Krizhevsky A., Sutskever I., Hinton G. Imagenet classification with deep convolutional neural networks. NIPS. 2012;25:1106–1114. [Google Scholar]
- 32.He K., Zhang X., Ren S., Sun J. Proceedings of the IEEE Conference on Computer Vision and Pattern Recognition. IEEE; Las Vegas: 2016. Deep residual learning for image recognition; pp. 770–778. [Google Scholar]
- 33.Mathworks . 2020. Moving mean. https://www.mathworks.com/help/ (Online; accessed 2 May 2020) [Google Scholar]
- 34.Ozcan T., Basturk A. Human action recognition with deep learning and structural optimization using a hybrid heuristic algorithm. Cluster Comput. 2020;23:2847–2860. [Google Scholar]
- 35.Özcan T. Yığınlanmış özdevinimli kodlayıcılar ile göğüs kanserinin sınıflandırılması ve klasik makine öğrenme metotları ile performans karşılaştırması. Erciyes Üniv. Bilim. Enst. Bilim. Derg. 2020;36(2):151–160. [Google Scholar]
- 36.Zafer C. Fusing fine-tuned deep features for recognizing different tympanic membranes. Biocybern. Biomed. Eng. 2020;40(1):40–51. [Google Scholar]
- 37.Cao R., Fang L., Lu T., He N. Self-attention-based deep feature fusion for remote sensing scene classification. IEEE Geosci. Remote Sens. Lett. 2020 [Google Scholar]
- 38.Cheng Y., Zhang C., Gu K., Qi L., Gan Z., Zhang W. ICASSP 2020-2020 IEEE International Conference on Acoustics, Speech and Signal Processing (ICASSP) IEEE; 2020. Multi-scale deep feature fusion for vehicle re-identification; pp. 1928–1932. [Google Scholar]
- 39.Talo M. 2020. Automated detection of COVID-19 cases using deep neural networks with X-Ray images. https://github.com/muhammedtalo/COVID-19 (Online; accessed 01 May 2020) [DOI] [PMC free article] [PubMed] [Google Scholar]
- 40.B.E. Boser, I.M. Guyon, V.N. Vapnik, A training algorithm for optimal margin classifiers, in: Proceedings of the Fifth Annual Workshop on Computational Learning Theory, 1992, pp. 144–152.
- 41.Mathworks . 2020. Multiclass methods for support vector machines. https://www.mathworks.com/help/ (Online; accessed 2 May 2020) [Google Scholar]
- 42.Ghoneim S. 2021. Accuracy, recall, precision, F-score & specificity, which to optimize on? https://www.https://towardsdatascience.com/accuracy-recall-precision-f-score-specificity-which-to-optimize-on-867d3f11124 (Online; accessed 31 March 2021) [Google Scholar]