

Abstract
Fibroblast growth factor-23 (FGF23) is a critical factor in chronic kidney disease (CKD), with elevated levels causing alterations in mineral metabolism and increased odds for mortality. Patients with CKD develop anemia as the kidneys progressively lose the ability to produce erythropoietin (EPO). Anemia is a potent driver of FGF23 secretion; therefore, a hypoxia-inducible factor prolyl hydroxylase inhibitor (HIF-PHI) currently in clinical trials to elevate endogenous EPO to resolve anemia was tested for effects on iron utilization and FGF23-related parameters in a CKD mouse model. Mice were fed either a casein control diet or an adenine-containing diet to induce CKD. The CKD mice had markedly elevated iFGF23 and blood urea nitrogen (BUN), hyperphosphatemia, and anemia. Cohorts of mice were then treated with a patient-equivalent dose of BAY 85–3934 (BAY; Molidustat), which elevated EPO and completely resolved aberrant complete blood counts (CBCs) in the CKD mice. iFGF23 was elevated in vehicle-treated CKD mice (120-fold), whereas circulating iFGF23 was significantly attenuated (>60%) in the BAY-treated CKD mice. The BAY-treated mice with CKD also had reduced BUN, but there was no effect on renal vitamin D metabolic enzyme expression. Consistent with increased EPO, bone marrow Erfe, Transferrin receptor (Tfrc), and EpoR mRNAs were increased in BAY-treated CKD mice, and in vitro hypoxic marrow cultures increased FGF23 with direct EPO treatment. Liver Bmp-6 and hepcidin expression were downregulated in all BAY-treated groups. Femur trabecular parameters and cortical porosity were not worsened with BAY administration. In vitro, differentiated osteocyte-like cells exposed to an iron chelator to simulate iron depletion/hypoxia increased FGF23; repletion with holo-transferrin completely suppressed FGF23 and normalized Tfrc1. Collectively, these results support that resolving anemia using a HIF-PHI during CKD was associated with lower BUN and reduced FGF23, potentially through direct restoration of iron utilization, thus providing modifiable outcomes beyond improving anemia for this patient population.
Keywords: ANEMIA, CKD, FGF23, HIF-PHI, IRON, MOLIDUSTAT
Introduction
Anemia is associated with chronic kidney disease (CKD) and is highly prevalent in this patient population, affecting >75% of patients by the time of end-stage renal disease (ESRD).(1) Further, CKD patients who are anemic progress to ESRD at a faster rate than patients who maintain less severe deficits in iron utilization.(2) Several studies have identified iron deficiency anemia as a potent driver of fibroblast growth factor-23 (FGF23),(3,4) which could have important implications in CKD-mineral and bone disorder (CKD-MBD). FGF23 is a bone-derived phosphaturic hormone secreted into the circulation when blood phosphate or 1,25-dihydroxyvitamin D (1,25D) levels rise.(5–7) To correct the hyperphosphatemia, FGF23 acts in the kidney proximal tubule, through its co-receptor Klotho, to reduce expression of sodium phosphate transporters NPT2a/c by promoting phosphaturia. Additionally, FGF23 decreases the expression of the renal anabolic vitamin D1α-hydroxylase (Cyp27b1) and increases the expression of the catabolic vitamin D 24-hydroxylase (Cyp24a1), causing decreased synthesis of 1,25D.(8)
FGF23 progressively rises in CKD, leading to downstream consequences, including cardiac hypertrophy and secondary hyperparathyroidism, and is associated with increased morbidity and mortality.(9) Because of these associations, understanding the potential effects of lowering FGF23 in the context of renal failure has become increasingly of interest. The Evaluation of Cinacalcet Hydrochrloride Therapy to Lower Cardiovascular Events (EVOLVE) trial showed that patients with >30% reduction in circulating FGF23 had less adverse events.(10) However, too little FGF23 during advancing CKD also has important consequences. In a CKD mouse model conditionally lacking 90% of FGF23 normally produced from bone, the animals became hyperphosphatemic, causing tissue calcifications in the heart and kidneys.(11) A similar result was shown when 5/6-nephrectomized rats were given an FGF23-neutralizing antibody, which developed hyperphosphatemia, calcifications, and ultimately increased mortality.(12) Thus, the consequences of rebalancing FGF23 expression in CKD remain to be determined.
Several hypoxia-inducible factor prolyl hydroxylase inhibitors (HIF-PHIs) are currently in clinical trials to treat the anemia in the setting of CKD. These drugs were developed to increase endogenous erythropoietin (EPO) expression while the kidneys, as well as other tissues such as liver or spleen, maintain the ability to produce EPO.(13) The advantage of these compounds is the ability to circumvent the association of recombinant human EPO (rhEPO) therapy with increased adverse cardiovascular events and mortality.(14–16) Hypoxia-inducible factors (HIFs) are the central sensors of oxygen in the body, with HIF1α and HIF2α being constantly turned over (synthesized and degraded) via hydroxylation by HIF prolyl hydroxylase enzymes (HIF-PHDs), which mark these transcription factors for degradation by the proteasome.(17) HIF-PHIs are molecules that inhibit the action of hydroxylating HIF so that HIFs remain stabilized, where they act within promoter hypoxia responsive elements (HRE) to induce target genes such as VEGF and HIF2α-mediated EPO production.(17) In addition to effects on stimulating erythropoiesis, these drugs cause a “synchronized erythropoietic response”(17) that can also mobilize iron via reducing hepcidin expression, allowing for export of iron from stores into tissues that demand oxygen.(18) BAY85–3934 (Molidustat, or BAY) has been shown in preclinical models as well as in clinical trials to increase circulating EPO and maintain hemoglobin.(19,20) Additionally, in our recent study, acute treatment with the HIF-PHI FG-4592 (Roxadustat) in mice with CKD resulted in lower FGF23 levels.(21) However, the effects of longer-term HIF-PHI delivery on FGF23-dependent mineral metabolism, on skeletal structure and bone cells, and whether there are direct effects of iron bioavailability on FGF23 expression in bone remain unclear.
HIF-PHI therapeutics are reported to be effective at maintaining hemoglobin levels in phase II/III clinical trials.(22,23) As a drug class, their crossover effects on mineral metabolism and FGF23 have not been deeply investigated, especially considering that FGF23 links phosphate homeostasis to iron handling, potentially via the HIF transcription factors.(24) Further, because these drugs are not specific for kidney HIF stabilization and EPO production and are known to have slightly different affinities for individual HIF-PHDs,(25) effects on genes other than primary targets such as EPO have yet to be fully evaluated. Herein, we demonstrated that in a mouse model of CKD, the resolution of anemia via increasing EPO using the HIF-PHI BAY 85–3934 improved iron utilization and red blood cell indices. Additionally, EPO had direct effects in isolation on marrow cultures to elevate FGF23. In vivo, BAY 85–3934 delivery to CKD mice reduced BUN and in parallel reduced iFGF23 with no effect on bone microarchitecture. Further, provision of transferrin-bound iron to an osteocyte cell model of hypoxia/iron deficiency suppressed FGF23 in vitro. Thus, careful management of anemia could provide important, modifiable outcomes for mineral metabolism in the CKD patient population.
Materials and Methods
Animal studies
Animal studies were approved by and performed according to the Institutional Animal Care and Use Committee (IACUC) of the Indiana University School of Medicine and complied with the NIH guidelines for the use of animals in research. Seven-week-old C57BL/6 female mice were purchased (Jackson Laboratory, Bar Harbor, ME, USA) and acclimated for 1 week before study. Mice were housed in cages with up to 5 mice per cage in accord with IUSM standard protocols; diet groups were thus allocated by cage. Mice were randomly assigned to treatment groups; investigators were not blinded during allocation or animal handling, only for endpoint measurements where arbitrary numbers were assigned for each sample. Mice were euthanized by CO2 inhalation/cervical dislocation, and blood was collected by cardiac puncture for serum and plasma (collected in EDTA tubes). Where indicated, mice were facial vein bled for interim analysis, collecting less than 5% of the total blood volume to mitigate potential effects on the parameters tested.(26) Red blood cell indices were measured on whole blood from tail bleeds using an Element HT5 Veterinary Hematology Analyzer (Heska, Loveland, CO, USA). Heart weight was measured post-necropsy on an analytical scale (Accuris Instruments, Edison, NJ, USA) in milligrams (mg) and femur length was measured using calipers in millimeters (mm) to normalize heart weight due to differences in body weight between casein and adenine diet groups.
Rodent diets
The adenine diet model was used to induce renal failure in female wild-type mice, largely according to previous protocols.(11) Significant sex effects have been shown with the provision of adenine-containing diets; therefore, female mice were studied, as males rapidly succumb to the renal disease.(27) Mice were acclimated for 1 week and during this time fed normal rodent chow. At 8 weeks of age, mice were switched to a control casein-based diet (0.9% phosphate and 0.6% calcium, TD.150303; Envigo, Indianapolis, IN, USA) or the same diet containing 0.2% adenine as “run-in” (TD.160020; Envigo) for 4 weeks. After 4 weeks, mice on the 0.2% adenine-containing diet were switched to a 0.15% adenine maintenance diet (TD.150305; Envigo) for the remainder of the study. Diets and water were provided ad libitum.
HIF-PHI treatment
After 12 weeks of experimental diets, mice received intraperitoneal (i.p.) injections of either vehicle (5% DMSO + 45% PEG300 + 50% ddH2O) or BAY 85–3934 (BAY, Molidustat; SelleckChem [Houston, TX, USA] S8138 resuspended in vehicle) at a human equivalent dose for mice(28) of 20 mg/kg every other day for 3 weeks. Final red blood cell indices were measured the day of tissue harvest; tissues were harvested 4 hours after the final injection at the end of the 3-week treatment window (15 weeks from experimental diet initiation).
Serum biochemical parameters
Routine serum biochemical parameters were determined using an automated COBAS MIRA Plus Chemistry Analyzer (Roche Diagnostics, Mannheim, Germany). Plasma iFGF23 was assessed using a rodent-specific commercial ELISA for bioactive, intact FGF23 (iFGF23; Quidel, San Diego, CA, USA); plasma EPO was measured using the Mouse Epo Quantikine ELISA (R&D Systems, Minneapolis, MN, USA); and plasma parathyroid hormone (PTH) was measured using a mouse-specific commercial ELISA for intact PTH 1–84 (Quidel) according to the manufacturer’s instructions.
Cell culture
The MSC cell line murine progenitor cells clone 2 (MPC2)(29) were cultured in αMEM (Thermo Fisher Scientific, Waltham, MA, USA) supplemented with 10% fetal bovine serum (FBS; HyClone, Thermo Fisher Scientific), 25 mM L-glutamine, and 25 mM penicillin–streptomycin (Sigma-Aldrich, St. Louis, MO, USA) at 33°C and 5% CO2 to proliferate. Cells were plated at a density of 1.0 × 10⁵ cells per mL in 6- or 12-well plates and incubated overnight before being transferred to a 37°C incubator for osteogenic differentiation, with cultures in maintenance media supplemented with mineralization conditions of 4 mM betaglycerophosphate and 50 μg/mL ascorbic acid. Cells were differentiated for 3 weeks before experimental treatments with osteogenic media changes every 3 days. For the in vitro model of iron deficiency, cells were incubated in osteogenic media containing 50 μM of the iron chelator deferoxamine (DFO) for 24 hours, after which cells were washed with 1× PBS and one set of cells was incubated with DFO-containing media supplemented with iron-replete levels of biologically available iron using holo- and apo-Transferrin (Tf), 1 mg/mL and 0.2 mg/mL, respectively, or apo-Transferrin alone (1.2 mg/mL).(30) Another set of cells remained in iron-deficient DFO-containing media for an additional 24 hours. After the incubations, the cells were washed with 1× PBS and harvested for RNA and protein analysis.
Bone marrow cells in hypoxia
Hypoxic bone marrow harvest was performed as previously described.(31) Briefly, female C57BL/6 mice at 8 to 10 weeks of age underwent necropsy to isolate bone marrow cells. For hypoxic isolation, dissection of the femurs and tibias took place in a custom configured chamber maintaining 3% O2 levels (Coy Laboratory Products, Grass Lake, MI, USA). Of note, all of the plastic disposables, tips, plates, and reagents used in the hypoxic isolation were equilibrated in the 3% O2 for a minimum of 16 hours before cell isolation to ensure there was no residual oxygen to interfere with the experiment. The marrow was flushed in sterile PBS supplemented with 2% FBS. After passing through a 70 μM filter, the cell preparations underwent red blood cell lysis. The remaining cells were washed once and seeded in 12-well plates at 1 × 10⁶ cells per well in IMDM supplemented with 10% FBS, 1% L-glutamine, and 1% Pen/Strep. The wells were then treated with vehicle or recombinant human EPO (BioLegend, San Diego, CA, USA) at the indicated concentrations. The hypoxia isolated cells and plates were transferred to a hypoxia incubator maintaining 5% O2 by N2 balance and 5% CO2. After 4 hours of incubation, the cells were removed from the wells, washed, and centrifuged for RNA extraction; these steps occurred within the hypoxic chamber at 3% O2. The first reagent of the RNA extraction kit was also acclimated in the hypoxia chamber to prevent any potential effect of normal O2 at the time of cell lysis. All remaining steps of the RNA extraction procedure continued, according to the manufacturer’s protocol, for both isolation protocols under normal ambient air.
Immunoblotting
Cells were lysed with 300 μL of 1× Lysis buffer (Cell Signaling Technologies, Danvers, MA, USA) with 1 μg/mL 4-(2-aminoethyl) benzenesulfonyl fluoride hydrochloride (AEBSF) protease inhibitor (Sigma-Aldrich). Total cell lysate protein concentrations were determined with the Better Bradford Kit (Thermo Fisher Scientific) according to the manufacturer’s instructions. Western blot analysis was performed with 25 μg of MPC2 cellular lysates. The blots were incubated with a 1:500 dilution of primary antibody to hypoxia-inducible factor 1-alpha (HIF1α) (NB100–449; Novus Biologicals, Littleton, CO, USA) for 2 hours at room temperature, then incubated with secondary antibody at 1:2000 (anti-rabbit–horseradish peroxidase [HRP]; Cell Signaling Technologies). The blots were stripped using SDS-glycine and reprobed with 1:2000 phospho-Erk (9101S; Cell Signaling), 1:5000 total Erk (V114A; Promega, Madison, WI, USA), and 1:15,000 anti-β-actin-HRP (A3854; Sigma-Aldrich). Immunoblot detection was performed using the ECL Prime Western Blotting Detection Reagents (Amersham-GE Healthcare, Pittsburgh, PA, USA) and a GE AB1600 digital imager. Numbers below reacting proteins demarcate quantification of protein bands compared with actin or total Erk using ImageJ, then normalized to OM control values.
RNA preparation and quantitative RT-PCR (qPCR)
Kidney, liver, and bone marrow flushed from long bones were harvested and homogenized in 1 mL of Trizol reagent (Invitrogen/Thermo Fisher Scientific) according to the manufacturer’s protocol, then further purified using the Isolate II RNA Mini Kit (Bioline, Memphis, TN, USA). Differentiated MPC2 cells were lysed in RLY buffer and total RNA from lysates was prepared using the Isolate II RNA Mini Kit (Bioline). RNA samples were tested with intron-spanning primers specific for mouse fibroblast growth factor-23 (Fgf23), early growth response gene-1 (Egr-1), vitamin D 1α-hydroxylase (Cyp27b1), vitamin D 24-hydroxylase (Cyp24a1), type 1 collagen (Col1a1), type 3 collagen (Col3a1), Klotho (Kl), erythroferrone (Erfe, Fam132b), transferrin receptor (Tfrc1), erythropoietin (Epo), erythropoietin receptor (EpoR), bone morphogenetic protein-6 (Bmp6), hepcidin (Hamp), dentin matrix protein-1 (Dmp1), and Osteocalcin (Bglap) mRNAs; Mouse Gapdh or β-actin was used as an internal control for RT-qPCR (Applied Biosystems/Thermo Fisher Scientific). The TaqMan One-Step RT-PCR Kit was used to perform the qPCR reactions under cycling conditions: 30 minutes 48°C, 10 minutes 95°C, followed by 40 cycles of 15 seconds 95°C and 1 minutes 60°C. The data were collected using a StepOne Plus system (Applied Biosystems/Thermo Fisher Scientific). The expression levels of mRNAs were calculated relative to vehicle-treated casein diet or osteogenic media controls and data analyzed by the 2−ΔΔCT method.(32)
Micro-computed tomography (μCT)
Femurs were removed after necropsy and fixed in 4% PFA. Bones were scanned using μCT (Skyscan 1172, Bruker microCT, Kontich, Belgium) at 6 μm voxel size to assess trabecular and cortical bone microarchitecture. The trabecular region of interest was located 1 mm proximally to the most proximal part of the distal femur growth plate. Standard trabecular parameters were measured of bone volume/total volume (BV/TV), trabecular bone number (Tb.N), trabecular separation (Tb.Sp), and trabecular thickness (Tb.Th). For cortical analysis, five consecutive slices were included in the region of interest (ROI), which was located proximally ~1.5 mm from the trabecular ROI. For each of the 5 cortical slices, an ROI was hand-drawn along the endocortical and periosteal surface with cortical porosity (Ct.Po) calculated by void space (100 – [BV/TV]). All data are presented with standard terminology and nomenclature.(33) Reconstructed 3D images represent the sample closest to the mean.
Kidney histology
At necropsy, kidneys were perfused with 0.9% saline and 4% PFA for fixation. Paraffin-embedded 7 μM sections were stained with Masson’s trichrome to assess fibrosis. Slides were imaged at 10× magnification using a Leica microscope (Buffalo Grove, IL, USA). Fibrosis staining was independently quantified using Fiji ImageJ (1.53a) by color deconvolution of 8 to 12 randomly selected non-overlapping fields at 10× magnification and were averaged per mouse. Representative images are of the sample/image closest to the mean (scale bar = 100 μm).
Statistical analysis
Repeated measures ANOVA was used to determine differences in plasma iFGF23 and EPO levels over time. Intact FGF23 and EPO endpoint measurements, as well as tissue gene expression analyses, serum biochemical parameters, and complete blood count parameters were analyzed by two-way ANOVA followed by a Tukey post hoc test. Pre- and post-treatment biochemical and red blood cell indices were analyzed by Student’s t test (two-tailed), except for serum phosphate, which was found to be significantly different between pre- and post-treatment and was therefore only analyzed separately. In vitro gene expression analyses were analyzed by one-way ANOVA with multiple comparisons. Significance for all tests was set at p < 0.05. The minimum number of animals estimated to observe a significant effect is based upon previous in vivo data. Final group numbers were as follows for each experimental outcome: casein diet + vehicle (n = 4; one mouse died before study endpoint), casein diet + BAY (n = 5), adenine diet + vehicle (n = 5), adenine diet + BAY (n = 5). Data are represented as box-and-whisker plots with the middle line representing the median of the data, upper and lower quartiles within the boxes, and the whiskers as the minimum and maximum. Each point represents an individual sample.
Results
Effects of BAY 85–3934 treatment on hematological parameters in mice with CKD
HIF-PHI are currently being investigated in clinical trials as novel therapies for the anemia associated with CKD via inducing endogenous production of EPO, necessary for new red blood cell production. To study the influence of HIF-PHI BAY 85–3934 (BAY) on iron utilization and potential effects on mineral metabolism, we used the adenine diet-induced model of CKD as previously described.(11,21) These mice received 0.2% adenine for 4 weeks, then 0.15% for an additional 8 weeks before BAY treatment, whereas controls were fed a casein-based diet that contained the same nutrient composition without adenine. Red blood cell indices showed hemoglobin (HB; Fig. 1A), hematocrit (HCT; Fig. 1B), and red blood cell count (RBC; Fig. 1C) were significantly reduced in CKD mice compared with casein mice before BAY treatment, indicating that the mice were anemic. After 12 weeks of receiving the diet, cohorts of mice were administered either vehicle or BAY at a patient-equivalent dose every other day for an additional 3 weeks while being maintained on the adenine diet. BAY delivery to the mice with CKD significantly improved HB and HCT compared with vehicle-CKD mice. Red blood cell count was also improved; however, it did not reach statistical significance. MCV, MCH, MCHC, and RDW-CV were all significantly increased in BAY-treated CKD mice compared with their pre-treatment levels (Table 1). Of note, platelets were increased in the CKD-vehicle mice, which can be indicative of iron-deficiency anemia; after 3 weeks of BAY treatment, platelet counts in CKD mice were reduced (Table 1). Plasma EPO levels were measured throughout the study (Fig. 1D). The dashed line indicates where the adenine diet was switched from 0.2% to 0.15%. At 12 weeks after receiving the experimental diet, EPO concentrations were similar among all groups. After 3 weeks of BAY treatment (shaded area on graph), both casein control and CKD mice had elevated plasma EPO (Fig. 1D). Kidney expression of Epo mRNA was suppressed in the BAY-treated mice with CKD by the end of the study (Supplemental Fig. S1), supporting extra-renal production of EPO as the source of the observed elevated levels. Collectively, these findings showed that BAY increased blood EPO levels and fully resolved anemia in the adenine model, providing a basis for examination of effects on FGF23 and related mineral metabolism.
Fig 1.

Resolution of anemia with BAY 85–3934 in mice with CKD was associated with reduced levels of circulating iFGF23. Female mice were placed on a casein control diet (CD) or adenine-containing diet (AD) to induce CKD. After 12 weeks of CKD induction, mice received injections of vehicle (V) or the HIF-PHI BAY 85–3934 (B) every other day for 3 weeks. (A) Hemoglobin (HB), (B) hematocrit (HCT), and (C) red blood cell count (RBC) before treatment and at the end of the 3-week treatment window were measured, demonstrating the AD groups were anemic before HIF-PHI injections. At the end of the study, HB, HCT, and RBC in the AD+B group were increased to casein control levels, indicating resolution of anemia. (D) Plasma erythropoietin (EPO; log scale) was measured throughout the study, showing increases in plasma levels after the 3-week BAY treatment in casein control and CKD groups (dashed line indicates when adenine diet was switched from 0.2% to 0.15% adenine; the shaded area indicates the 3-week treatment window of every-other-day injections of vehicle or the HIF-PHI BAY). (E) Plasma intact FGF23 (iFGF23) was measured throughout the study, showing significant elevations in plasma levels with the adenine diet compared with casein diet controls. Before treatment, iFGF23 remained significantly elevated; however, CKD mice receiving BAY had lower levels of iFGF23 compared with AD+V mice, which continued to increase (n = 4–5 mice per group; *p < .05; **p < .01 versus vehicle treatment, same diet; #p < .05; ##p < .01 versus casein diet, same treatment).
Table 1.
Red Blood Cell Indices Before and After HIF-PHI (BAY) Treatment
| Pre-treatment (12 weeks) | Final (15 weeks) | |||||||
|---|---|---|---|---|---|---|---|---|
| CD+V | CD+B | AD+V | AD+B | CD+V | CD+B | AD+V | AD+B | |
| MCV (fL) | 47.28 ± 0.42 | 46.46 ± 0.21 | 43.42 ± 3.63 | 41.94 ± 0.98 | 47.55 ± 0.44 | 49.28 ± 0.48$$ | 44.18 ± 4.18 | 45.10 ± 0.74$ |
| MCH (pg) | 15.08 ± 0.34 | 14.84 ± 0.17 | 13.60 ± 0.83# | 13.36 ± 0.35# | 15.13 ± 0.05 | 15.82 ± 0.46 | 13.80 ± 0.96# | 14.88 ± 0.23$$ |
| MCHC (g/dL) | 31.90 ± 0.67 | 31.98 ± 0.34 | 31.50 ± 0.74 | 31.90 ± 0.16 | 31.83 ± 0.35 | 32.06 ± 1.00 | 31.43 ± 0.72 | 33.00 ± 0.15$$ |
| RDW-CV (%) | 14.38 ± 0.35 | 14.80 ± 0.87 | 17.22 ± 0.55## | 15.50 ± 0.32 | 14.70 ± 0.60 | 23.74 ± 3.36** | 18.15 ± 1.54 | 22.76 ± 1.20*,$$ |
| PLT (103/uL) | 1210 ± 120 | 1395 ± 105 | 1644 ± 188 | 1251 ± 205 | 1093 ±187 | 1077 ± 201 | 1773 ± 113## | 1225 ± 133 |
| MPV (fL) | 5.30 ± 0.12 | 5.48 ± 0.09 | 5.50 ± 0.23 | 5.30 ± 0.13 | 5.38 ± 0.11 | 5.76 ± 0.11 | 5.38 ± 0.23 | 5.40 ±0.19 |
AD = adenine diet; B = BAY; CD = casein diet; MCV, mean corpuscular volume; MCH = mean corpuscular hemoglobin; MCHC = mean corpuscular hemoglobin content; MPV = mean platelet volume; PLT = platelets; RDW-CV = red blood cell distribution width; V = vehicle.
Data presented as mean ± SEM. One mouse was removed from final (15-week) samples for analysis as a biological outlier; n = 4–5 mice/group.
p < .05.
p < .01 versus vehicle treatment, same diet.
p < .05.
p < .01 versus casein diet, same treatment.
p < .05.
p < .01 versus pre-treatment.
BAY is associated with reduced FGF23 in mice with CKD
We next examined serum biochemistries and FGF23 during the diet regimen. As a marker of renal function that is inversely correlated with disease state, serum blood urea nitrogen (BUN; Table 2) was significantly elevated in CKD vehicle-treated mice versus casein-diet fed mice. BUN levels in BAY-treated CKD mice were significantly lower. Serum calcium levels remained unchanged during the duration of the study; however, serum phosphate was elevated in vehicle-treated adenine diet–fed mice compared with vehicle-treated casein diet–fed mice at the end of the study (Table 2). There were no alterations in phosphate levels in the CKD mice treated with BAY, despite significant changes in iFGF23 observed (see below). Total serum iron was reduced in pretreatment CKD mice compared with casein-diet controls, indicating iron deficiency. After BAY treatment, total serum iron remained significantly reduced compared with casein-diet controls in both treatment groups (Table 2). These results showed that the diet regimen caused CKD and iron deficiency, and BAY treatment was associated with no changes in serum phosphate but a reduction in BUN.
Table 2.
Serum Biochemical Parameters
| Pre-treatment (12 weeks) | Final (15 weeks) | |||||||
|---|---|---|---|---|---|---|---|---|
| CD+V | CD+B | AD+V | AD+B | CD+V | CD+B | AD+V | AD+B | |
| Phosphorus (mg/dL) | 6.54 ± 0.42 | 7.08 ± 0.63 | 6.81 ± 0.40 | 8.06 ± 0.31 | 12.39 ± 1.0$$ | 13.06 ± 0.5$$$ | 15.05 ± 0.81#,$$$ | 14.77 ± 1.26$$ |
| Iron (umol/L) | 24.63 ± 2.37 | 28.30 ± 2.15 | 21.90 ± 2.37 | 19.25 ± 1.64## | 32.38 ± 0.52$ | 33.8 ± 5.78 | 23.25 ± 3.64# | 22.6 ± 2.19# |
| Calcium (mg/dL) | 9.74 ± 0.41 | 9.20 ± 0.39 | 10.26 ± 0.56 | 9.86 ± 0.51 | 10.13 ± 0.70 | 9.52 ± 0.91 | 11.28 ± 0.60 | 10.71 ± 0.47 |
| Aik Phos (U/L) | 93.75 ± 12.48 | 90.0 ± 8.06 | 107.0 ± 14.46 | 123.75 ± 5.91 | 123.75 ± 6.25 | 133.0 ± 15.46 | 85.0 ± 16.46 | 164.0 ± 14.95** |
| BUN (mg/dL) | 24.88 ±3.11 | 24.91 ± 2.37 | 41.40 ± 4.32## | 50.96 ± 4.04## | 35.11 ± 3.51 | 31.32 ± 1.25 | 71.51 ± 5.05$,## | 51.50 ± 5.64**,## |
AD = adenine diet; Alk phos = alkaline phosphatase; B = BAY; BUN = blood urea nitrogen; CD = casein diet; V = vehicle.
Data presented as mean ± SEM. n = 4–5 mice/group.
p < .01 versus vehicle treatment, same diet.
p < .05.
p < .01 versus casein diet, same treatment.
p < .05.
p < .01 versus pre-treatment.
We next investigated how the resolution of anemia was associated with circulating FGF23 levels. iFGF23 plasma concentrations were measured throughout the study and were significantly elevated during adenine diet (CKD) administration compared with casein diet controls (Fig. 1E). A modest FGF23 reduction was found when the diet was switched from 0.2% to 0.15% (dashed line), likely due to some recovery from the less concentrated adenine diet. After 12 weeks of experimental diet, iFGF23 levels were markedly elevated in the mice with CKD compared with casein diet controls and not different across groups. After 3 weeks in the treatment phase of the study (shaded area), vehicle-injected mice had a continued elevation in iFGF23, whereas mice receiving BAY had a significant reduction in iFGF23 compared with vehicle-CKD mice (>60%; p < .05), coinciding with the resolution of anemia (Fig. 1E). Because of potential effects of elevated EPO causing cardiac hypertrophy, we also measured heart weight to femur length ratios and saw no differences between diet groups or treatments, suggesting that BAY and elevated EPO had no effects on heart mass over this time course of drug administration (Supplemental Fig. S2).
Molecular adaptations to BAY 85–3934
We next investigated iron utilization parameters in key tissues in response to BAY treatment. HIF-PHI have been shown to alter iron utilization by increasing iron availability to bone marrow to sustain erythropoiesis.(17) Although total serum iron levels remained low in the mice with CKD compared with casein mice regardless of treatment (Table 2), we observed changes in systemic tissue iron utilization. In response to EPO production from the action of HIF-PHIs, bone marrow produces the hormone erythroferrone (Erfe or Fam132b), which increases available iron through its actions in the liver.(34) In line with these findings, we observed significant upregulation of Erfe mRNA expression in both casein and CKD mice treated with BAY (Fig. 2A). This change coincided with significantly upregulated expression of EpoR and transferrin receptor (Tfrc1) mRNAs (Fig. 2B, C). We and others previously reported that EPO can induce Fgf23 expression in bone marrow in vivo.(35,36) Expression of marrow Fgf23 mRNA was upregulated in both casein and CKD mice treated with BAY (Fig. 2D). Increased Erfe is known to downregulate hepcidin (Hamp) in the liver through Bmp-6 signaling to promote iron export from cells via ferroportin. Here, we found that in response to BAY treatment, both the casein and CKD groups had significant downregulation of hepatic Bmp-6 associated with low hepcidin expression (Fig. 2E, F). Consistent with our in vivo increases of FGF23, isolated bone marrow cells cultured in hypoxia (3% O2) had significant, dose-dependent increases in Fgf23 and Erfe expression after 4 hours of treatment with rhEPO (Fig. 2G). Thus, EPO may drive marrow production of circulating FGF23, but the restoration of systemic iron utilization in vivo may counter this activity as a stronger FGF23 suppressor.
Fig 2.

Systemic iron utilization in the bone marrow and liver of normal and CKD mice in response to BAY85–3934. (A) Bone marrow erythroferrone (Erfe), (B) Epo receptor (EpoR), (C) transferrin receptor (Tfrc), and (D) Fgf23 mRNAs were upregulated with BAY treatment in both casein and CKD groups. Liver expression of (E) Bmp-6 and (F) hepcidin (Hamp) were downregulated in BAY-treated casein and CKD groups compared with vehicle-treated mice (n = 4–5 mice per group; *p < .05; **p < .01 versus vehicle treatment, same diet; ##p < .01 versus casein diet, same treatment). CD = casein diet; AD = adenine diet; V = vehicle; B = BAY. (G) Bone marrow cultured in hypoxia showed dose-dependent increases in Fgf23 and erythroferrone (Erfe) expression after 4 hours of rhEPO treatment (*p < .05, **p < .01 versus control).
Renal Egr-1 expression, a key transcription factor and marker of FGF23 activity as well as tissue stress, was upregulated in the vehicle-treated mice with CKD (Fig. 3A). BAY treatment of the mice with CKD reduced Egr-1 expression, coinciding with the lower levels of iFGF23 (Fig. 3A). FGF23 is known to act through its co-receptor Klotho to reduce kidney synthesis of 1,25(OH)2 vitamin D, the active form of vitamin D. The mRNA encoding the anabolic vitamin D 1α-OHase (Cyp27b1) was significantly increased in CKD-vehicle and -BAY mice compared with casein controls (Fig. 3B). Additionally, mRNA encoding the vitamin D 24-OHase (Cyp24a1) was significantly elevated in CKD-vehicle mice likely because of high iFGF23 levels, with no statistical difference in expression between AD treatment groups (Fig. 3C). Renal fibrosis markers type I and type III collagen (Col1a1 and Col3a1, respectively) mRNAs were significantly upregulated in all CKD mice, and BAY treatment downregulated both markers compared with vehicle-CKD mice, suggesting a molecular adaptation to reverse renal fibrosis (Fig 3D, E). Although BAY improved some renal parameters, the kidney FGF23 co-receptor Klotho mRNA remained significantly reduced in CKD mice, consistent with its previous reporting of downregulation during CKD,(37) and BAY treatment did not impact these levels (Fig. 3F). Kidney histology revealed markedly increased fibrosis as assessed by Masson’s trichrome staining in the mice with CKD compared with casein diet–fed mice (Fig. 3G). Although the collagen fibrosis RNA markers were reduced after BAY treatment, significant differences between treatment groups were not detected after quantification of fibrosis-stained kidney sections (Fig. 3H).
Fig 3.

Renal gene expression and histology changes in response to BAY 85–3934. (A) Kidney early growth response-1 (Egr-1) expression was elevated in AD+V mice and was significantly lower in AD+B mice. (B) 1,25-dihydroxyvitamin D (1,25D) 1α-hydroxylase (Cyp27b1) mRNA expression was elevated in both AD groups, with no difference between treatment groups. (C) 1,25D 24-hydroxylase (Cyp24a1) expression was significantly upregulated in the AD +V mice, with no statistically significant difference between AD treatment groups. Renal fibrosis markers (D) type 1 collagen (Col1a1) and (E) type III collagen (Col3a1) mRNAs were elevated in AD+V mice. BAY treatment significantly downregulated these markers in AD+B mice. (F) Renal Klotho mRNA expression was downregulated in AD+V mice and remained low in AD+B mice. (G) Representative kidney histology images of Masson’s trichrome staining (scale bar = 100 μm). (H) Quantification of fibrotic area of trichrome staining showed increased fibrosis with the adenine diet, but no changes with BAY treatment (n = 4–5 mice per group; **p < .01 versus vehicle treatment, same diet; ##p < .01 versus casein diet, same treatment). CD = casein diet; AD = adenine diet; V = vehicle; B = BAY.
Skeletal outcomes with HIF-PHI administration
In both animal models and human patients with CKD, cortical porosity occurs, driven in part through elevated PTH driving osteoclast activation, which leads to bone fragility and increased fracture risk.(38,39) In all CKD mice, micro-CT analysis revealed that femur trabecular bone volume/total volume (BV/TV; Fig. 4A, C), trabecular number (Tb.N; Fig. 4D), and cortical porosity (Fig. 4B, G) were significantly elevated versus non-CKD controls, consistent with metabolic bone disease. However, there were no significant differences between vehicle- and BAY-treated CKD mice over the time course tested. In addition, there were no changes in trabecular spacing (Tb.Sp; Fig. 4E) or thickness (Tb.Th; Fig. 4F) with diet or treatment. Altered iron utilization (either chronic iron loading or severe anemia) has been reported to be damaging to bone structure; however, BAY treatment did not worsen skeletal disease phenotypes. Plasma PTH concentrations showed no statistically significant differences across groups at the end of the study (Fig. 4H). Interestingly, serum alkaline phosphatase levels were significantly elevated in CKD mice treated with BAY compared with CKD-vehicle controls, suggesting potentially altered osteoblast activity (Table 1).
Fig 4.

Micro-CT analyses of femur trabecular and cortical parameters. Representative 3D reconstructed images of (A) trabecular bone volume over total volume (BV/TV) and (B) cortical porosity. (C) BV/TV and (D) trabecular number (Tb.N) were significantly increased in CKD mice. (E) Trabecular spacing (Tb. Sp) and (F) trabecular thickness (Tb.Th) did not reveal significant changes with diet or treatment. (G) Cortical porosity (co.pt) was significantly higher in CKD mice. (H) Plasma PTH levels were not significantly different between groups (n = 4–5 mice per group; **p < .01 versus vehicle treatment, same diet; ##p < .01 versus casein diet, same treatment). CD = casein diet; AD = adenine diet; V = vehicle; B = BAY.
Iron bioavailability restores iron deficiency–induced FGF23 in osteocytes
To build upon the concept of improved iron utilization reducing circulating FGF23 in vivo as we observed in the mice with CKD, we used an in vitro model of iron deficiency/hypoxia. The MPC2 conditional mesenchymal stem cell line(29) does not express osteocytic markers or mineralize until differentiated via culture in osteogenic media (see Materials and Methods and Supplemental Fig. S3), similar to primary mesenchymal stem cells,(40) whereas 3 weeks after differentiation, the cells robustly express the osteoblast/osteocyte transcripts encoding Fgf23, dentin matrix protein-1 (Dmp1), type I collagen (Col1a1), and osteocalcin (Bglap) (Supplemental Fig. S3). We utilized this cell line to test iron handling on osteocyte cellular function. In this regard, MPC2 cells were differentiated into osteocytes for 3 weeks, then treated with the iron chelator deferoxamine (DFO; 50 μM) for 24 hours to mimic defective iron utilization as previously performed.(3) One set of the DFO-treated cells were supplemented with apo-transferrin alone, holo-transferrin plus apo-transferrin (mimicking amounts found in the circulation(30)), or remained in DFO only-containing media for an additional 24 hours. Cells that were maintained in DFO-containing media for the duration of the experiment (48 hours total) elicited increased HIF1α protein accumulation as determined by immunoblot (Fig. 5A). Importantly, addition of non-iron loaded apo-transferrin (apo-Tf) in DFO-containing media showed a similar HIF1α protein response to DFO alone. Phospho-Erk1/2 protein expression did not change with iron depletion or repletion (Fig. 5A). The HIF1α stabilization in DFO alone and in DFO + apo-Tf–treated cells coincided with elevated transferrin receptor (Tfrc) (Fig. 5B) and increased Fgf23 mRNA expression (Fig. 5C). Apo-transferrin alone showed a modest but not statistically significant effect, potentially due to the ability to bind exogenous iron before interacting with the differentiated cells. After one set of cells underwent 24 hours of iron repletion with biologically available iron from holo-transferrin, the cells had reduced HIF1α protein accumulation, a 50% reduction of Tfrc mRNA, as well as a 75% to 90% suppression of Fgf23 mRNA expression compared with cells that remained in DFO-containing media only or DFO with apo-transferrin over the same time course. Thus, correcting altered iron handling in osteocyte-like cells directly regulated HIF stabilization and Fgf23 expression.
Fig 5.
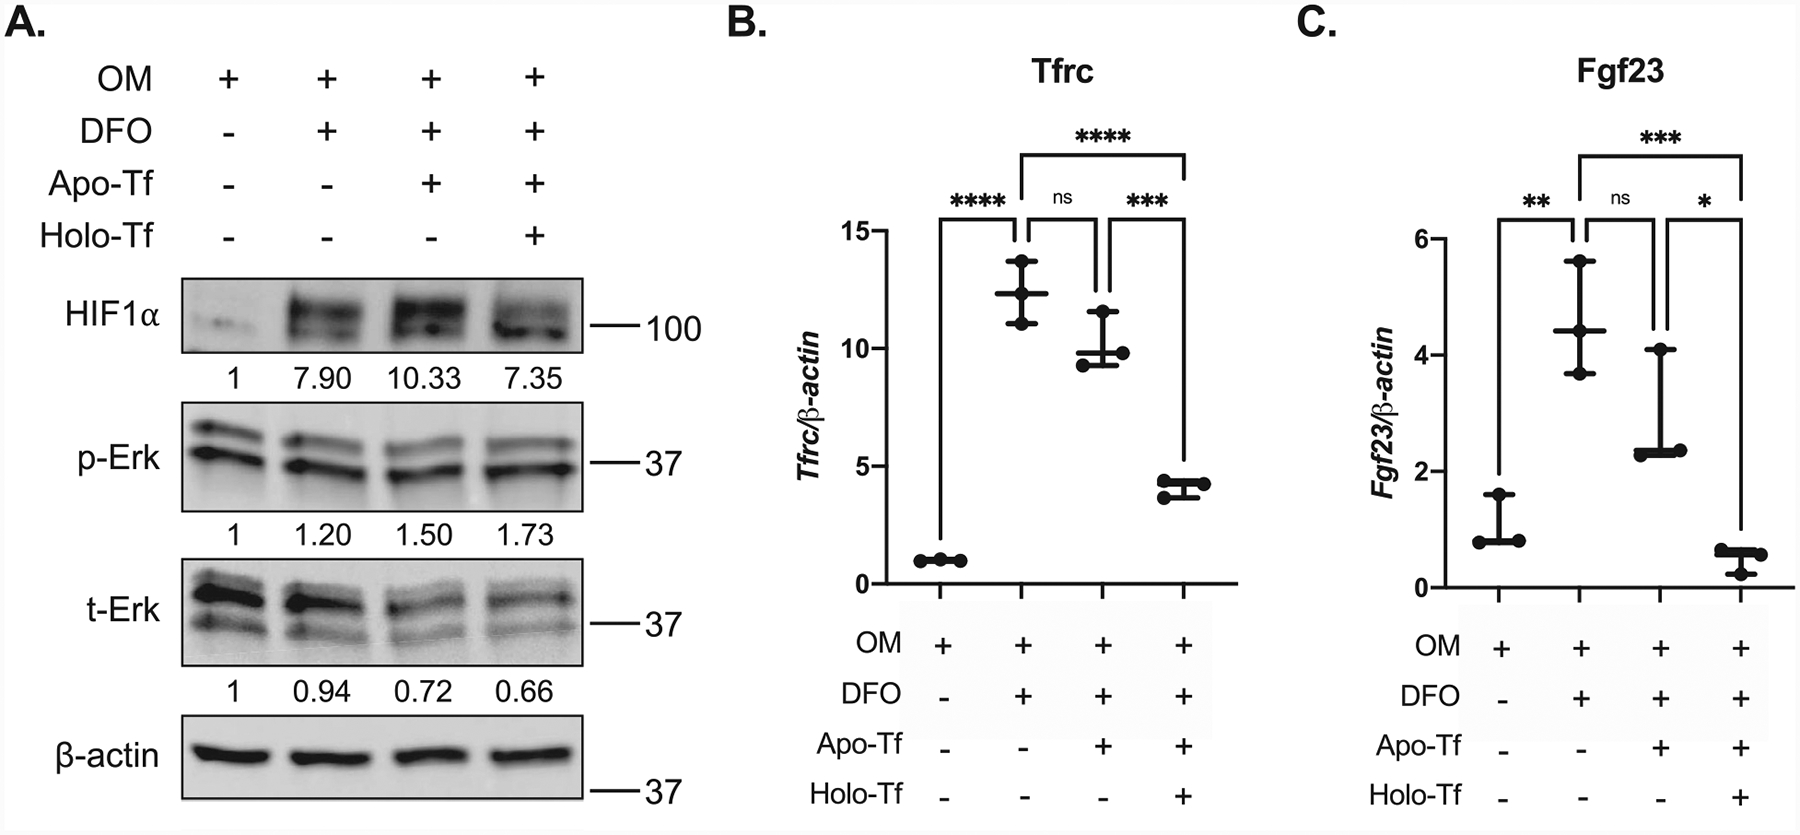
Provision of holo-transferrin regulates Fgf23 in vitro. MPC2 cells were differentiated into osteocyte-like cells for 3 weeks in osteogenic media (OM). Cells were treated with DFO-containing OM media for 24 hours (DFO, iron-deficient conditions). After 24 hours of iron depletion, one set of these cells was treated with DFO media containing apo-transferrin (Apo-Tf) alone, physiological amounts of holo-transferrin with apo-Tf (holo-Tf, iron replete conditions), or remained in DFO-containing media (DFO) for an additional 24 hours. (A) Immunoblot of OM control cells, DFO, apo-Tf, and holo-Tf cells showing increased HIF1α expression with DFO alone or DFO + apo-Tf treatment that was reduced after 24 hours of iron repletion in DFO + holo-Tf cells. Phospho-Erk (p-Erk) and total Erk (t-Erk) expression did not change under these conditions. Numbers below reacting proteins demarcate quantification of protein bands compared with Actin using ImageJ, then normalized to OM control values. (B) Transferrin receptor (Tfrc) mRNA expression was upregulated in iron-deficient DFO-only and DFO + apo-Tf conditions, and was significantly downregulated after iron repletion (holo-Tf). (C) Fgf23 mRNA expression was significantly upregulated in DFO-only and DFO + apo-Tf conditions, and iron repletion with holo-Tf led to 90% suppression of Fgf23 expression (n = 3 wells/condition; each experiment was done in triplicate; **p < .01, ***p < .001).
In summary, we demonstrated that, at a patient equivalent dose, the HIF-PHI BAY 85–3934 increased EPO and restored aberrant CBCs in the anemic adenine CKD model. This treatment altered iron utilization and was associated with a significant reduction in FGF23 and serum BUN. The lowering of FGF23 did not worsen the elevated serum phosphate in the mice with CKD. Importantly, BAY 85–3934 had no deleterious macroscopic effects on bone over the experimental time course. Finally, providing iron to a novel osteocyte model of iron deficiency/hypoxia reduced stabilized HIF1α levels and suppressed FGF23 mRNA production, showing that iron delivery had direct effects on osteocytes to control FGF23. Thus, the HIF-PHI were designed to improve iron utilization in patients with CKD, but through their crossover actions on mineral metabolism, these analogs may act to provide significant ancillary benefits.
Discussion
The obligatory anemia developed during CKD arises from multiple causes, including the reduced ability to produce renal EPO, EPO resistance, inflammation, and blood loss, among others. The reduction in iron and RBCs has severe detrimental effects on patient outcomes, including increased mortality and shortened time to dialysis.(2,41) The guidelines for rhEPO administration to patients with CKD have largely been anecdotal and has led to associations of EPO toxicity and worse cardiovascular outcomes with higher EPO doses.(42) The HIF-PHI class of drugs was developed with the goal of inducing endogenous EPO to avoid the complications associated with direct EPO delivery. Because these compounds target the HIF transcription regulatory machinery, the primary systemic oxygen/iron sensors, their effects may be wider than first realized. Based upon multiple studies, it is clear that FGF23 is induced in response to iron deficiency, hypoxia, and anemia,(3,4,24,43,44) all with the likely common denominator of HIF activation. It remains unclear, however, the extent to which these factors increase FGF23 in patients with CKD, and if reducing FGF23 to a level that does not cause hyperphosphatemia is beneficial in other longer-term outcomes. Acute EPO injection was shown to increase FGF23 in wild-type mice;(35,36,45) however, the long-term effects of providing endogenous EPO in a CKD animal model were unknown. Further, there are multiple HIF-PHI in clinical trials(14) that have slightly differing affinities for targeting the three isoforms of HIF-PHDs.(46) Thus, it is unclear whether these agents act similarly on crossover mineral metabolism. We, therefore, tested a member of this drug class, BAY 85–3934, and also examined outcomes over an extended time course to allow testing of these drugs on iron utilization, mineral metabolism, and bone properties.
Strengths of the present work include using the adenine model of CKD, which mimics many of the key features of the anemia of CKD in patients. We demonstrated previously that this model has hypoferremia, as well as reduced hematocrit and hemoglobin, tissue fibrosis, and increased markers of inflammation.(11,21) We previously used the adenine-CKD mouse model to explore a different member of the HIF-PHI family, FG-4592 (Roxadustat). This agent also lowered FGF23, but was used over an acute time course (3 injections over 5 days protocol) that was not designed to reverse the aberrant CBCs but rather to investigate short-term iron utilization.(21) The advantage of a longer time course in the present work was to allow full resolution of the anemia of CKD in the adenine model, as demonstrated by a rise in endogenous EPO and complete rescue of the low hematocrit and hemoglobin. Interestingly, this effect was only found in the anemic CKD mice, whereas casein diet–fed mice receiving BAY had no significant increases in HCT or HB despite elevated EPO. The mechanisms underlying the differences in HIF-PHI actions between situations of anemia and normal iron handling remain unclear. In a trial involving healthy human subjects, orally administered Molidustat was shown to elevate endogenous EPO and reticulocytes after a single injection at higher doses, with no changes in hemoglobin or hematocrit after 3 or 5 days.(47) Further, in a study using the HIF-PHI GSK1278863 in healthy humans, Japanese and white subjects also had increases in EPO and reticulocytes with a higher dose used.(48) Therefore, it is possible that HIF-PHI at specific doses during normoferremia resulted in production of immature RBCs that did not fully differentiate. Additionally, it is possible that interactions of doses and timing of drug administration affect CBC parameters, as a study in normal rats showing that daily dosing of Molidustat increased hematocrit, but changes in red blood cell count or hemoglobin were not tested.(19) Therefore, future studies could include several doses over a more extended treatment period. A similar phenomenon was observed in a translational study of ferric citrate supplementation in a CKD mouse model, where changes in red blood cell count and hemoglobin were observed in anemic (iron-deficient) groups, but normal (iron-replete) groups had no changes in EPO-dependent parameters.(49)
Importantly, our longer time course (3 weeks) showed that the mice with CKD and treated with BAY had similar reductions in FGF23 (>60%) as with acute delivery of FG-4592 (75%). This finding supports the idea that patients receiving HIF-PHI may have long-term ancillary effects over their treatment course, with no severe detrimental feedback loops on HIF stabilization to initiate a rise of FGF23. FGF23 has been shown to be a target of HIF transcriptional activation(24) and EPO.(35,50) Indeed, both BAY and FG-4592 are known to increase HIF activity (as well as circulating EPO concentrations), but likely were associated with reduced FGF23 during the anemia of CKD through systemic improvement of iron utilization in bone. This concept is supported by our in vitro studies using the MPC2 differentiated osteocyte model, where providing iron via holo-transferrin within a controlled iron deficiency/hypoxia environment reduced the prevailing elevated HIF1α protein and completely suppressed FGF23 mRNA.
The renal phosphate wasting disorder autosomal dominant hypophosphatemic rickets (ADHR) was one of the first studies to link anemia and iron deficiency with overexpression of FGF23. It was shown in mice with an ADHR Fgf23 stabilizing mutation that a low-iron diet markedly raised FGF23 transcription and secreted protein levels.(3) This finding was also shown to occur in ADHR patients that were iron deficient.(51) Clinical studies treating anemic ADHR patients with low-dose iron supplements resulted in reduced FGF23 and resolution of the FGF23-mediated renal phosphate wasting.(52) On the other hand, certain preparations of iron provided to iron-deficient patients, such as ferric carboxymaltose (FCM), have been reported to cause hypophosphatemia secondary to elevated FGF23.(53,54) Similar to our findings of correcting prevailing anemia to affect FGF23, several studies have shown that iron repletion can also suppress elevated FGF23. In this regard, in a study of anemic women, iron delivery via intravenous iron dextran lowered total circulating FGF23.(55) Further, a meta-analysis of the effect of iron therapy on FGF23 levels in CKD patients showed that iron supplementation significantly reduced FGF23 levels compared with the control arms, and that oral iron was more efficacious at reducing FGF23 than intravenous iron therapy.(56) Finally, in an iron-deficient mouse model of CKD, supplementation with ferric citrate resulted in lower levels of total and intact FGF23, as well as suppressed bone Fgf23 transcription,(49) which are consistent with our in vivo and in vitro results. Collectively, our data support that the lower FGF23 is attributable to reduced FGF23 transcription in bone from increased iron availability to the osteocyte through the actions of HIF-PHI on iron utilization.
Our study in mice closely reflects that of the DIALOGUE 1 (D1) clinical trial of Molidustat, a placebo-controlled, double-blind fixed dose in ESA-naïve, non-dialysis-dependent CKD patients.(20) After 16 weeks of treatment in this patient cohort, serum iron levels were similar between placebo and Molidustat cohorts, and both groups had decreased iron from baseline, a finding similar in our animal study. We hypothesized this was owing to increased iron utilization, in agreement with our finding in mice that liver hepcidin transcription was decreased with BAY treatment. Although we did not measure serum levels of hepcidin in our study, this finding was mirrored in the D1 trial, which showed decreased serum hepcidin levels compared with placebo, allowing for iron availability. Further, our study in mice demonstrated improvement of red blood cell indices also associated with lower BUN and altered tissue iron utilization parameters. Treatment in rodent models of CKD with other HIF-PHI, such as Roxadustat and Enardodustat, showed improvements in markers of kidney fibrosis and inflammation, although this is not associated with FGF23.(57,58) Although the fibrosis marker genes Col1a1 and Col3a1 mRNAs were reduced, we did not observe improvements in kidney fibrosis as assessed by histology in our study. It is likely that our model had established renal fibrosis that would be difficult to prevent or reverse over a 3-week treatment period, and the downregulation of renal fibrosis makers was potentially not enough of a compensation to overcome fibrotic damage. Future studies could investigate more extended treatments with HIF-PHIs to assess effects on fibrosis. Additionally, a recent study showed that BAY treatment in CKD mice reduced fibrosis but did not change BUN.(59) In our study, mice were placed on adenine for a total of 15 weeks and were provided adenine throughout the entire study and HIF-PHI treatment course. It is possible that the mice in this prior study did not have as severe a CKD phenotype, likely due to the short 4-week adenine provision that was discontinued before BAY treatment.
Previous studies have shown age-dependent alterations to bone structure in rodents fed the adenine diet during CKD induction. When adenine is fed to 3-week-old mice, there is both cortical and trabecular bone loss,(60) whereas when adenine was administered to 8-week-old rats, trabecular bone was elevated.(61) We initiated the adenine diet at 8 weeks of age, and observed increased BV/TV, trabecular number, and cortical porosity in CKD mice. Elevated PTH is typically associated with causing increased porosity in CKD bone. In the work herein, PTH was measured at the end of the 15-week study after prolonged treatment with adenine. Differences in PTH across groups may have been found at earlier time points. Indeed, our group previously found significant differences in PTH in mice treated with adenine (0.2%) for 4 and 8 weeks.(11) It was also observed that HIF-PHI treatment did not alter bone structural parameters over the 3-week time course. These data support that BAY does not have adverse effects on CKD bone when anemia is resolved and did not induce iron overload, which can have negative effects on bone mass.(62) In a recent study, iron repletion in mice with CKD (5/6 Nx) lowered bone Fgf23 transcription, consistent with our in vitro findings. However, iron suppressed bone formation markers, reduced trabecular parameters, and caused cortical thinning.(63) Bone properties are not currently being examined as primary endpoints in ongoing HIF-PHI clinical trials but may be an important outcome to examine in the future as these drugs become fully available. Several in vitro studies have shown that stabilized HIF, through genetic or chemical treatment, induced FGF23 expression. However, these studies have not directly tested added bioavailable iron for effects on elevated FGF23 transcription in bone cells. Osteogenic differentiation of MPC2 cells now provides a model capable of direct testing of iron responses by delivering iron via holo-transferrin. These data support that iron repletion in osteoblasts/osteocytes suppresses FGF23 production, which could explain the lower levels of FGF23 in our CKD mouse study with BAY treatment.
There are several limitations to these studies. We administered BAY to mice via intraperitoneal injection, whereas patients in clinical trials are provided these drugs orally. We showed these analogs are effective even with an alternative route of administration as demonstrated by the alleviation of anemia. Further, while 3 weeks of HIF-PHI treatment was long enough to resolve the red blood cell indices, it may not be long enough to see gross changes in bone structure. Therefore, longer treatment or a combination of suppression of PTH may be required to see an effect. One concern of more prolonged HIF-PHI treatment in this model is supraphysiological RBC, HB, and HCT that can have adverse effects on the cardiovascular system. We observed no changes in the ratio of heart weight to tibia length regardless of diet or treatment, likely due to red blood cell indices being within normal ranges at the end of the study. Although we showed that resolution of anemia resulted in lower levels of circulating intact FGF23 compared with vehicle-treated mice, FGF23 levels remained much higher than normal physiological levels, likely attributable to other compounding factors that can influence FGF23, including hyperphosphatemia. We did not observe significant rebalancing of the renal 1,25D-metabolizing enzymes with suppressed FGF23. In this regard, it is known that the regulation of Cyp27b1 and Cyp24a1 is also controlled by PTH and indirectly, calcium, in addition to FGF23. Therefore, compensatory mechanisms could be in place during CKD that do not allow differences to be observed exclusively due to reduced FGF23 activity in the kidney. Further, we cannot fully discriminate whether the decrease in renal Egr-1 expression in the BAY-treated mice with CKD was directly related to the significant reduction in circulating FGF23. Because Egr-1 is a generalized stress response marker, it is possible that HIF-PHI activity reduced Egr-1 expression due to multiple factors, including improved iron handling due to increased EPO and/or more broad effects of increased HIF activity. Our studies showed that Fgf23 mRNA expression in bone marrow was increased with BAY treatment, but observed that plasma levels of intact, bioactive FGF23 were lower. Therefore, it is possible that bone marrow produced a minor portion of circulating FGF23 during HIF-PHI treatment. Finally, this study was not designed to discern FGF23 effects independent of BAY/EPO effects in CKD; therefore, future directions could include tissue-specific deletional approaches to dissect these effects. In conclusion, our work demonstrated that the HIF-PHI Molidustat resolved anemia in the adenine diet CKD mouse model, which resulted in lower circulating levels of intact FGF23. This had ancillary benefits on other systems, including reduced BUN and tissue iron utilization, with no adverse effects on bone structure, highlighting important outcomes for the CKD patient population in response to this new class of drugs.
Supplementary Material
Acknowledgments
The authors acknowledge NIH grants R21-AR059278, R01-DK112958, and R01- HL145528 (KEW); F31-DK122679 and T32-HL007910 (MLN); R35-HL139599 and U54-DK106846 (HEB); Biomedical Research Grant from Indiana University (ELC); and The David Weaver Professorship (KEW). The content is solely the responsibility of the authors and does not necessarily represent the official views of the NIH or IUSM.
Footnotes
Additional Supporting Information may be found in the online version of this article.
Disclosures
KEW receives royalties from Kyowa Hakko Kirin Pharmaceutics, Inc., and royalties for licensing FGF23 to Kyowa Hakko Kirin Co., Ltd. All other authors state that they have no conflicts of interest.
PEER REVIEW
The peer review history for this article is available at https://publons.com/publon/10.1002/jbmr.4272.
References
- 1.Stauffer ME, Fan T. Prevalence of anemia in chronic kidney disease in the United States. PLoS One. 2014;9(1):e84943. [DOI] [PMC free article] [PubMed] [Google Scholar]
- 2.Ma JZ, Ebben J, Xia H, Collins AJ. Hematocrit level and associated mortality in hemodialysis patients. J Am Soc Nephrol. 1999;10(3):610–619. [DOI] [PubMed] [Google Scholar]
- 3.Farrow EG, Yu X, Summers LJ, et al. Iron deficiency drives an autosomal dominant hypophosphatemic rickets (ADHR) phenotype in fibroblast growth factor-23 (Fgf23) knock-in mice. Proc Natl Acad Sci U S A. 2011;108(46):E1146–E1155. [DOI] [PMC free article] [PubMed] [Google Scholar]
- 4.David V, Martin A, Isakova T, et al. Inflammation and functional iron deficiency regulate fibroblast growth factor 23 production. Kidney Int. 2016;89(1):135–146. [DOI] [PMC free article] [PubMed] [Google Scholar]
- 5.Shimada T, Kakitani M, Yamazaki Y, et al. Targeted ablation of Fgf23 demonstrates an essential physiological role of FGF23 in phosphate and vitamin D metabolism. J Clin Invest. 2004;113(4):561–568. [DOI] [PMC free article] [PubMed] [Google Scholar]
- 6.Shimada T, Hasegawa H, Yamazaki Y, et al. FGF-23 is a potent regulator of vitamin D metabolism and phosphate homeostasis. J Bone Miner Res. 2004;19(3):429–435. [DOI] [PubMed] [Google Scholar]
- 7.Perwad F, Azam N, Zhang MY, Yamashita T, Tenenhouse HS, Portale AA. Dietary and serum phosphorus regulate fibroblast growth factor 23 expression and 1,25-dihydroxyvitamin D metabolism in mice. Endocrinology. 2005;146(12):5358–5364. [DOI] [PubMed] [Google Scholar]
- 8.Liu S, Tang W, Zhou J, et al. Fibroblast growth factor 23 is a counter-regulatory phosphaturic hormone for vitamin D. J Am Soc Nephrol. 2006;17(5):1305–1315. [DOI] [PubMed] [Google Scholar]
- 9.Isakova T, Xie H, Yang W, et al. Fibroblast growth factor 23 and risks of mortality and end-stage renal disease in patients with chronic kidney disease. JAMA. 2011;305(23):2432–2439. [DOI] [PMC free article] [PubMed] [Google Scholar]
- 10.Moe SM, Chertow GM, Parfrey PS, et al. Cinacalcet, fibroblast growth Factor-23, and cardiovascular disease in hemodialysis: the evaluation of Cinacalcet HCl therapy to lower cardiovascular events (EVOLVE) trial. Circulation. 2015;132(1):27–39. [DOI] [PubMed] [Google Scholar]
- 11.Clinkenbeard EL, Noonan ML, Thomas JC. Increased FGF23 protects against detrimental cardio-renal consequences during elevated blood phosphate in CKD. JCI Insight. 2019;4(4):1–13. 10.1172/jci.insight.123817. [DOI] [PMC free article] [PubMed] [Google Scholar]
- 12.Shalhoub V, Shatzen EM, Ward SC, et al. FGF23 neutralization improves chronic kidney disease-associated hyperparathyroidism yet increases mortality. J Clin Invest. 2012;122(7):2543–2553. [DOI] [PMC free article] [PubMed] [Google Scholar]
- 13.Fried W, Barone-Varelas J, Morley C. Factors that regulate extrarenal erythropoietin production. Blood Cells. 1984;10(2–3):287–304. [PubMed] [Google Scholar]
- 14.Gupta N, Wish JB. Hypoxia-inducible factor Prolyl hydroxylase inhibitors: a potential new treatment for anemia in patients with CKD. Am J Kidney Dis. 2017;69(6):815–826. [DOI] [PubMed] [Google Scholar]
- 15.Maxwell PH, Eckardt KU. HIF prolyl hydroxylase inhibitors for the treatment of renal anaemia and beyond. Nat Rev Nephrol. 2016;12(3):157–168. [DOI] [PubMed] [Google Scholar]
- 16.Drueke TB, Locatelli F, Clyne N, et al. Normalization of hemoglobin level in patients with chronic kidney disease and anemia. N Engl J Med. 2006;355(20):2071–2084. [DOI] [PubMed] [Google Scholar]
- 17.Haase VH. HIF-prolyl hydroxylases as therapeutic targets in erythropoiesis and iron metabolism. Hemodial Int. 2017;21(Suppl 1):S110–S124. [DOI] [PMC free article] [PubMed] [Google Scholar]
- 18.Akizawa T, Macdougall IC, Berns JS, et al. Iron regulation by Molidustat, a daily oral hypoxia-inducible factor Prolyl hydroxylase inhibitor, in patients with chronic kidney disease. Nephron. 2019;143(4): 243–254. [DOI] [PMC free article] [PubMed] [Google Scholar]
- 19.Flamme I, Oehme F, Ellinghaus P, Jeske M, Keldenich J, Thuss U. Mimicking hypoxia to treat anemia: HIF-stabilizer BAY 85–3934 (Molidustat) stimulates erythropoietin production without hypertensive effects. PLoS One. 2014;9(11):e111838. [DOI] [PMC free article] [PubMed] [Google Scholar]
- 20.Macdougall IC, Akizawa T, Berns JS, Bernhardt T, Krueger T. Effects of Molidustat in the treatment of anemia in CKD. Clin J Am Soc Nephrol. 2019;14(1):28–39. [DOI] [PMC free article] [PubMed] [Google Scholar]
- 21.Noonan ML, Clinkenbeard EL, Ni P, et al. Erythropoietin and a hypoxia-inducible factor prolyl hydroxylase inhibitor (HIF-PHDi) lowers FGF23 in a model of chronic kidney disease (CKD). Physiol Rep. 2020;8(11):e14434. [DOI] [PMC free article] [PubMed] [Google Scholar]
- 22.Zheng Q, Yang H, Sun L, et al. Efficacy and safety of HIF prolylhydroxylase inhibitor vs epoetin and darbepoetin for anemia in chronic kidney disease patients not undergoing dialysis: a network meta-analysis. Pharmacol Res. 2020;159:105020. [DOI] [PubMed] [Google Scholar]
- 23.Akizawa T, Taguchi M, Matsuda Y, Iekushi K, Yamada T, Yamamoto H. Molidustat for the treatment of renal anaemia in patients with dialysis-dependent chronic kidney disease: design and rationale of three phase III studies. BMJ Open. 2019;9(6):e026602. [DOI] [PMC free article] [PubMed] [Google Scholar]
- 24.Zhang Q, Doucet M, Tomlinson RE, et al. The hypoxia-inducible factor-1alpha activates ectopic production of fibroblast growth factor 23 in tumor-induced osteomalacia. Bone Res. 2016;4:16011. [DOI] [PMC free article] [PubMed] [Google Scholar]
- 25.Sanghani NS, Haase VH. Hypoxia-inducible factor activators in renal anemia: current clinical experience. Adv Chronic Kidney Dis. 2019;26(4):253–266. [DOI] [PMC free article] [PubMed] [Google Scholar]
- 26.Diehl KH, Hull R, Morton D, et al. A good practice guide to the administration of substances and removal of blood, including routes and volumes. J Appl Toxicol. 2001;21(1):15–23. [DOI] [PubMed] [Google Scholar]
- 27.Diwan V, Small D, Kauter K, Gobe GC, Brown L. Gender differences in adenine-induced chronic kidney disease and cardiovascular complications in rats. Am J Physiol Renal Physiol. 2014;307(11):F1169–F1178. [DOI] [PubMed] [Google Scholar]
- 28.Nair AB, Jacob S. A simple practice guide for dose conversion between animals and human. J Basic Clin Pharm. 2016;7(2):27–31. [DOI] [PMC free article] [PubMed] [Google Scholar]
- 29.Prideaux M, Wright CS, Noonan ML, et al. Generation of two multipotent mesenchymal progenitor cell lines capable of osteogenic, mature osteocyte, adipogenic, and chondrogenic differentiation. bioRxiv. 2020;2020:11.19.385138. [DOI] [PMC free article] [PubMed] [Google Scholar]
- 30.Baschant U, Rauner M, Balaian E, et al. Wnt5a is a key target for the pro-osteogenic effects of iron chelation on osteoblast progenitors. Haematologica. 2016;101(12):1499–1507. [DOI] [PMC free article] [PubMed] [Google Scholar]
- 31.Mantel CR, O’Leary HA, Chitteti BR, et al. Enhancing hematopoietic stem cell transplantation efficacy by mitigating oxygen shock. Cell. 2015;161(7):1553–1565. [DOI] [PMC free article] [PubMed] [Google Scholar]
- 32.Livak KJ, Schmittgen TD. Analysis of relative gene expression data using real-time quantitative PCR and the 2(-Delta Delta C(T)) method. Methods. 2001;25(4):402–408. [DOI] [PubMed] [Google Scholar]
- 33.Bouxsein ML, Boyd SK, Christiansen BA, Guldberg RE, Jepsen KJ, Muller R. Guidelines for assessment of bone microstructure in rodents using micro-computed tomography. J Bone Miner Res. 2010;25(7):1468–1486. [DOI] [PubMed] [Google Scholar]
- 34.Kautz L, Jung G, Valore EV, Rivella S, Nemeth E, Ganz T. Identification of erythroferrone as an erythroid regulator of iron metabolism. Nat Genet. 2014;46(7):678–684. [DOI] [PMC free article] [PubMed] [Google Scholar]
- 35.Clinkenbeard EL, Hanudel MR, Stayrook KR, et al. Erythropoietin stimulates murine and human fibroblast growth factor-23, revealing novel roles for bone and bone marrow. Haematologica. 2017;102(11):e427–e430. [DOI] [PMC free article] [PubMed] [Google Scholar]
- 36.Hanudel MR, Eisenga MF, Rappaport M, et al. Effects of erythropoietin on fibroblast growth factor 23 in mice and humans. Nephrol Dial Transplant. 2019;34(12):2057–2065. [DOI] [PMC free article] [PubMed] [Google Scholar]
- 37.Hu MC, Shi M, Zhang J, et al. Klotho deficiency causes vascular calcification in chronic kidney disease. J Am Soc Nephrol. 2011;22(1):124–136. [DOI] [PMC free article] [PubMed] [Google Scholar]
- 38.Nickolas TL, Stein EM, Dworakowski E, et al. Rapid cortical bone loss in patients with chronic kidney disease. J Bone Miner Res. 2013;28(8):1811–1820. [DOI] [PMC free article] [PubMed] [Google Scholar]
- 39.McNerny EMB, Nickolas TL. Bone quality in chronic kidney disease: definitions and diagnostics. Curr Osteoporos Rep. 2017;15(3):207–213. [DOI] [PMC free article] [PubMed] [Google Scholar]
- 40.Thompson WR, Uzer G, Brobst KE, et al. Osteocyte specific responses to soluble and mechanical stimuli in a stem cell derived culture model. Sci Rep. 2015;5:11049. [DOI] [PMC free article] [PubMed] [Google Scholar]
- 41.Staples AO, Greenbaum LA, Smith JM, et al. Association between clinical risk factors and progression of chronic kidney disease in children. Clin J Am Soc Nephrol. 2010;5(12):2172–2179. [DOI] [PMC free article] [PubMed] [Google Scholar]
- 42.Singh AK, Szczech L, Tang KL, et al. Correction of anemia with epoetin alfa in chronic kidney disease. N Engl J Med. 2006;355(20):2085–2098. [DOI] [PubMed] [Google Scholar]
- 43.Clinkenbeard EL, Farrow EG, Summers LJ, et al. Neonatal iron deficiency causes abnormal phosphate metabolism by elevating FGF23 in normal and ADHR mice. J Bone Miner Res. 2014;29(2):361–369. [DOI] [PMC free article] [PubMed] [Google Scholar]
- 44.Weidner H, Baschant U, Lademann F, et al. Increased FGF-23 levels are linked to ineffective erythropoiesis and impaired bone mineralization in myelodysplastic syndromes. JCI Insight. 2020;5(15):e137062. [DOI] [PMC free article] [PubMed] [Google Scholar]
- 45.Daryadel A, Bettoni C, Haider T, et al. Erythropoietin stimulates fibroblast growth factor 23 (FGF23) in mice and men. Pflugers Arch. 2018;470(10):1569–1582. [DOI] [PubMed] [Google Scholar]
- 46.Locatelli F, Fishbane S, Block GA, Macdougall IC. Targeting hypoxia-inducible factors for the treatment of anemia in chronic kidney disease patients. Am J Nephrol. 2017;45(3):187–199. [DOI] [PubMed] [Google Scholar]
- 47.Bottcher M, Lentini S, Arens ER, et al. First-in-man-proof of concept study with molidustat: a novel selective oral HIF-prolyl hydroxylase inhibitor for the treatment of renal anaemia. Br J Clin Pharmacol. 2018;84(7):1557–1565. [DOI] [PMC free article] [PubMed] [Google Scholar]
- 48.Hara K, Takahashi N, Wakamatsu A, Caltabiano S. Pharmacokinetics, pharmacodynamics and safety of single, oral doses of GSK1278863, a novel HIF-prolyl hydroxylase inhibitor, in healthy Japanese and Caucasian subjects. Drug Metab Pharmacokinet. 2015;30(6):410–418. [DOI] [PubMed] [Google Scholar]
- 49.Francis C, Courbon G, Gerber C, et al. Ferric citrate reduces fibroblast growth factor 23 levels and improves renal and cardiac function in a mouse model of chronic kidney disease. Kidney Int. 2019;96(6):1346–1358. [DOI] [PMC free article] [PubMed] [Google Scholar]
- 50.Toro L, Barrientos V, Leon P, et al. Erythropoietin induces bone marrow and plasma fibroblast growth factor 23 during acute kidney injury. Kidney Int. 2018;93(5):1131–1141. [DOI] [PubMed] [Google Scholar]
- 51.Imel EA, Peacock M, Gray AK, Padgett LR, Hui SL, Econs MJ. Iron modifies plasma FGF23 differently in autosomal dominant hypophosphatemic rickets and healthy humans. J Clin Endocrinol Metab. 2011;96(11):3541–3549. [DOI] [PMC free article] [PubMed] [Google Scholar]
- 52.Imel EA, Liu Z, Coffman M, Acton D, Mehta R, Econs MJ. Oral iron replacement normalizes fibroblast growth factor 23 in iron-deficient patients with autosomal dominant hypophosphatemic rickets. J Bone Miner Res. 2020;35(2):231–238. [DOI] [PMC free article] [PubMed] [Google Scholar]
- 53.Wolf M, Rubin J, Achebe M, et al. Effects of iron isomaltoside vs ferric carboxymaltose on hypophosphatemia in iron-deficiency anemia: two randomized clinical trials. JAMA. 2020;323(5):432–443. [DOI] [PMC free article] [PubMed] [Google Scholar]
- 54.Klein K, Asaad S, Econs M, Rubin JE. Severe FGF23-based hypophosphataemic osteomalacia due to ferric carboxymaltose administration. BMJ Case Rep. 2018;2018:bcr2017222851. [DOI] [PMC free article] [PubMed] [Google Scholar]
- 55.Wolf M, Koch TA, Bregman DB. Effects of iron deficiency anemia and its treatment on fibroblast growth factor 23 and phosphate homeostasis in women. J Bone Miner Res. 2013;28(8):1793–1803. [DOI] [PubMed] [Google Scholar]
- 56.Abu-Zaid A, Magzoub D, Aldehami MA, Behiry AA, Bhagavathula AS, Hajji R. The effect of iron supplementation on FGF23 in chronic kidney disease patients: a systematic review and time-response meta-analysis. Biol Trace Elem Res. 2021. Epub ahead of print. Available from: 10.1007/s12011-021-02598-1. [DOI] [PubMed] [Google Scholar]
- 57.Kabei K, Tateishi Y, Shiota M, et al. Effects of orally active hypoxia inducible factor alpha prolyl hydroxylase inhibitor FG4592 on renal fibrogenic potential in mouse unilateral ureteral obstruction model. J Pharmacol Sci. 2020;142(3):93–100. [DOI] [PubMed] [Google Scholar]
- 58.Uchida L, Tanaka T, Saito H, et al. Effects of a prolyl hydroxylase inhibitor on kidney and cardiovascular complications in a rat model of chronic kidney disease. Am J Physiol Renal Physiol. 2020;318(2):F388–F401. [DOI] [PubMed] [Google Scholar]
- 59.Li L, Nakano D, Zhang A, et al. Effects of post-renal anemia treatment with the HIF-PHD inhibitor molidustat on adenine-induced renal anemia and kidney disease in mice. J Pharmacol Sci 2020;144(4):229–236. [DOI] [PubMed] [Google Scholar]
- 60.Akchurin O, Sureshbabu A, Doty SB, et al. Lack of hepcidin ameliorates anemia and improves growth in an adenine-induced mouse model of chronic kidney disease. Am J Physiol Renal Physiol. 2016;311(5):F877–F889. [DOI] [PMC free article] [PubMed] [Google Scholar]
- 61.Tamagaki K, Yuan Q, Ohkawa H, et al. Severe hyperparathyroidism with bone abnormalities and metastatic calcification in rats with adenine-induced uraemia. Nephrol Dial Transplant. 2006;21(3): 651–659. [DOI] [PubMed] [Google Scholar]
- 62.Yang WP, Chang HH, Li HY, et al. Iron overload associated endocrine dysfunction leading to lower bone mineral density in thalassemia major. J Clin Endocrinol Metab. 2020;105(4):e1015–e1024. [DOI] [PubMed] [Google Scholar]
- 63.Patino E, Doty SB, Bhatia D, et al. Carbonyl iron and iron dextran therapies cause adverse effects on bone health in juveniles with chronic kidney disease. Kidney Int. 2020;98(5):1210–1224. [DOI] [PMC free article] [PubMed] [Google Scholar]
Associated Data
This section collects any data citations, data availability statements, or supplementary materials included in this article.