

Abstract
Non‐alcoholic fatty liver disease (NAFLD) is characterized by hepatic lipid accumulation. SAMM50 encodes Sam50, a mitochondrial outer membrane protein involved in the removal of reactive oxygen species, mitochondrial morphology and regulation of mitophagy. Certain single nucleotide polymorphisms of SAMM50 have been reported to be correlated with NAFLD. However, the contribution of SAMM50 polymorphisms to the occurrence and severity of fatty liver in the Chinese Han cohort has rarely been reported. Here, we investigated the association between SAMM50 polymorphisms (rs738491 and rs2073082) and NAFLD in a Chinese Han cohort, as well as the mechanistic basis of this association. Clinical information and blood samples were collected from 380 NAFLD cases and 380 normal subjects for the detection of genotypes and biochemical parameters. Carriers of the rs738491 T allele or rs2073082 G allele of SAMM50 exhibit increased susceptibility to NAFLD [odds ratio (OR) = 1.39; 95% confidence interval (CI) = 1.14–1.71, P = 0.001; OR = 1.31; 95% CI = 1.05–1.62, P = 0.016, respectively] and are correlated with elevated serum triglyceride, alanine aminotransferase and aspartate aminotransferase levels. The presence of the T allele (TT + CT) of rs738491 (P < 0.01) or G allele (AG + GG) of rs2073082 (P = 0.03) is correlated with the severity of fatty liver in the NAFLD cohort. In vitro studies indicated that SAMM50 gene polymorphisms decrease its expression and SAMM50 deficiency results in increased lipid accumulation as a result of a decrease in fatty acid oxidation. Overexpression of SAMM50 enhances fatty acid oxidation and mitigates intracellular lipid accumulation. Our results confirm the association between the SAMM50 rs738491 and rs2073082 polymorphisms and the risk of fatty liver in a Chinese cohort. The underlying mechanism may be related to decreased fatty acid oxidation caused by SAMM50 deficiency.
Keywords: fatty acid oxidation, NAFLD, SAMM50, SNPs
The present study demonstrated that two single nucleotide polymorphismss (rs738491 and rs2073082) of the SAMM50 gene are associated with susceptibility to and severity of fatty liver in a Chinese Han population. Genetic variants of SAMM50 decreased its expression. In vitro studies indicated that SAMM50 deficiency impaired fatty acid β‐oxidation and caused intracellular lipid accumulation.
Abbreviations
- β‐HB
β‐hydroxybutyrate
- AcAc
acetoacetate
- AKP
alkaline phosphatase
- ALT
alanine aminotransferase
- ANOVA
analysis of variance
- AST
aspartate aminotransferase
- BMI
body mass index
- CI
confidence interval
- DBIL
direct bilrubin
- DMEM
Dulbecco’s modified Eagle’s medium
- FAO
fatty acid oxidation
- GA
glycated albumin
- GLU
blood glucose
- GWAS
genome‐wide association studies
- HDL
high‐density lipoprotein
- IHC
immunohistochemistry
- LDL
low‐density lipoprotein
- LSD
least significant difference
- NAFLD
non‐alcoholic fatty liver disease
- OA
oleic acid
- OCR
oxygen consumption rate
- OR
odds ratio
- PA
palmitic acid
- qRT‐PCR
quantitative real‐time PCR
- SNP
single nucleotide polymorphism
- TC
total cholesterol
- TG
triglyceride
Non‐alcoholic fatty liver disease (NAFLD) is characterized by hepatic lipid accumulation and is strongly associated with obesity, diabetes and other features of the metabolic syndrome [1]. NAFLD has a wide spectrum, ranging from hepatic steatosis to histological evidence of necroinflammation and non‐alcoholic steatohepatitis, which may evolve into cirrhosis, final‐stage liver disease or hepatocellular carcinoma [2]. NAFLD has now been considered a serious worldwide health problem. Genome‐wide association studies (GWAS) confirm a bulk of genetic variants correlated with vulnerability to NAFLD, and post‐GWAS analyses have determined several loci with strong genetic associations with one or more phases of NAFLD. Several studies have revealed significant single nucleotide polymorphisms (SNPs) (e.g. PNPLA3 rs738409, TM6SF2 rs58542926 and HSD17B13 rs72613567) correlated with susceptibility to NAFLD [3, 4, 5]. Many candidate genes have been investigated to depict the genetic background of NAFLD, including SAMM50.
SAMM50 encodes Sam50, a mitochondrial outer membrane protein, and is of great significance in the removal of reactive oxygen species, mitochondrial morphology and regulation of mitophagy [6, 7, 8]. Previous studies have demonstrated that the rs738491 locus in SAMM50 is one of the important SNPs strongly associated with NAFLD [9]. Kitamoto et al. [10] performed a GWAS in a Japanese cohort and identified several SNPs of SAMM50, including rs738491. These SNPs were correlated with the hepatic steatosis and cirrhosis, as well as NAFLD activity score. Chung et al. [11] reported other SNPs in different loci of SAMM50 in a Korean population. However, the contribution of SAMM50 polymorphisms to the occurrence and severity of fatty liver in the Chinese Han population has rarely been reported. The present study aims to determine whether SAMM50 rs738491 and rs2073082 polymorphisms are associated with susceptibility to NAFLD in a Chinese cohort and to identify the mechanistic basis of this association. Accordingly, a case–control study was conducted in the well‐characterized Chinese Han population with NAFLD. In the in vitro part of the study, the function of SAMM50 as a fatty acid metabolic regulator was assessed. The results revealed that a loss of SAMM50 impaired fatty acid oxidation (FAO) and caused lipid accumulation within cells. These findings confirm the key role of SAMM50 in lipid metabolism and provide a mechanistic basis for SAMM50 polymorphisms associated with susceptibility to NAFLD.
Materials and methods
Subjects
In 2018, 380 patients and 380 healthy control subjects were recruited. Participants with viral hepatitis or other unrelated liver dysfunction were not included in this research. All eligible participants were examined through ultrasonographic examinations and denied alcohol abuse (male: < 140 g·week−1; female: < 70 g·week−1). Liver specimens were collected from patients undergoing liver biopsy. The study was approved by the Ethical Committees of the Shanghai Jiao Tong University, and all procedures were strictly compliant with the principles of the Declaration of Helsinki, and written informed consent has been obtained from each subject.
Sample preparation and genomic DNA extraction
After fasting overnight, a total of blood samples of 5 mL were drawn from all participants for DNA extraction and biochemical assays, including aminotransferase (AST), aminotransferase (ALT), high‐density lipoprotein (HDL), low‐density lipoprotein (LDL) and triglyceride (TG), etc. Genomic DNA extraction was performed with a clot blood DNA kit (Beijing Cowin Biotech Co., Ltd, Beijing, China) in accordance with the manufacturer’s instructions.
Genetic analysis
Genotyping of the two SNPs (rs738491 and rs2073082) was performed using the TaqMan SNP genotyping method. Details of the probes are presented in Table S1 (international serial numbers, gene names and chromosomal coordinates). An ABI ViiA™ 7 real‐time fluorescent quantitative PCR amplifier (Applied Biosystems, Foster City, CA, USA) was used for PCR amplification. The reaction comprised: denaturation step at 95 °C for 10 min and 40 cycles of denaturation at 95 °C for 15 s and annealing at 60 °C for 1 min; the samples contained 2.5 µL of 2 × TaqMan genotyping master mix, 5 pmol of 40 × TaqMan SNP genotyping assay and 20 ng of genomic DNA.
Cell lines and cell culture
The hepatoma cell lines Hep3B, Huh7 and HepG2 were obtained from the American Type Culture Collection (ATCC, Manassas, VA, USA). QGY7703, L02, LM3, MHCC97H and Bel‐7402 cell lines were obtained from the laboratory of the Department of Clinical Pharmacology. Cells were cultured in Dulbecco’s modified Eagle’s medium (DMEM) containing 10% fetal bovine serum, with 1% of penicillin and streptomycin (NCM Biotech, Jiangsu, China) at 37 ºC in an incubator under 5% CO2.
Plasmid constructs and generation of stable cell lines
Lentiviral vectors with a negative control (sh‐NC) and two shRNA‐SAMM50 were constructed. The targeting sequences were: negative control: 5ʹ‐AUCGAC CAGGACAUCACCUGCTT‐3ʹ; sh‐1#: 5ʹ‐AUAAGGUUCCUGUAGCCGACATT‐3ʹ; sh‐2#: 5ʹ‐CACACACCGUCUCUCGAGGAATT‐3’. The full length and shRNA‐resistant human SAMM50 were inserted into the pLenti‐CMV‐3FLAG lentiviral vector. The empty pLenti‐CMV‐3FLAG lentiviral vector (Vector) was used as a control. All lentiviral vectors of SAMM50 knockdown and overexpression were purchased from OBiO Technology (Shanghai, China). After attachment, the cells were transfected with lentivirus and screened using 2 μg·mL−1 puromycin for 7 days. The efficiency of SAMM50 knockdown or overexpression was analyzed by immunoblotting.
Preparation of fatty acid solution
The 5 mm stock solution of palmitic acid (PA) (Sigma‐Aldrich, St Louis, MO, USA) was obtained by dissolving PA in the DMEM medium containing 3% fatty acid‐free BSA with a water bath at 50 ºC . To prepare a 5 mm stock solution of PA and oleic acid (OA) (OA : PA) mixture (2 : 1; final concentration 5 mm), the sodium salt of palmitic acid was firstly dissolved in the DMEM containing 3% BSA and then sodium salt of OA was added [12]. The final concentration of 150 μm PA or 350 μm OA : PA mixture in 3% BSA was obtained by diluting the stock solution with DMEM.
BODIPY 493/503 staining of neutral lipid droplets
The staining solution containing 2 μm BODIPY (D3922; Thermo Fisher Scientific, Waltham, MA, USA) was prepared in PBS. After PA or OA : PA treatment, cells were incubated with 4% paraformaldehyde for 15 min. Next, the fixed cells were incubated with 3 mL of staining solution for 15 min at 37 ºC in the dark. After washing in PBS, a drop of antifade polyvinylpyrrolidone mounting medium (Beyotime, Jiangsu, China) with 4ʹ,6‐diamidino‐2‐phenylindole was added onto the slides. Images were obtained with a fluorescence microscope (Leica, Wetzlar, Germany).
Immunoblotting
Immunoblotting were performed as described previously [13]. The antibodies used were : SAMM50 (dilution 1 : 1000, ab133709; Abcam, Cambridge, UK), β‐tubulin (dilution 1 : 8000; 10094‐1‐AP; Protein Tech, Wuhan, China), CPT1A (dilution 1 : 1000; A5307, ABclonal, Wuhan, China), 3‐ketoacyl‐CoA thiolase (dilution 1 : 1000; A15778; ABclonal), enoyl‐CoA hydratase (dilution 1 : 1000; 66117‐1‐Ig; Protein Tech) and long‐chain specific acyl‐CoA dehydrogenase (dilution 1 : 1000; 17526‐1‐AP; Protein Tech).
Cell viability test
Cells were seeded in a 96‐well plate (5000 cells per well) and tested for cell viability in the presence of various concentrations of PA or OA : PA as indicated. After incubation for 24 h, each well was supplemented with 10 µL of Cell Counting Kit‐8 solution (NCM Biotech, Jiangsu, China) for 2 h. The absorbance was measured at 450 nm using an Epoch 2 microplate reader (BioTek, Winooski, VT, USA).
Quantitation of TG levels in Hep3B cells
After PA or OA : PA treatment, cells were lysed with a RIPA buffer for up to 20 min and centrifuged at 12 000 g for 20 min. A BCA kit was used for measuring the protein concentration of the supernatant and TG levels were detected using a TG kit (Nanjing Jiancheng, Jiangsu, China). The lipid content in Hep3B cells was expressed as mmol TG·g–1.
Quantitative real‐time PCR (qRT‐PCR)
Total RNA of each sample was extracted by using RNAiso Plus reagent in accordance with the manufacturer’s instructions (Takara Bio, Shiga, Japan). The cDNA was generated from equal quantities of total RNA using PrimeScript™ RT master mix (Takara Bio). PCR was performed in a 30‐μL reaction system containing 6 μL of 5 × PrimeScript RT master mix and 6 μL of RNA supplemented with RNase‐free ddH2O made up to 30 μL. The reaction was performed on an ABI 7500 system. qRT‐PCR was performed using Hieff® qPCR SYBR® Green Master Mix (No Rox; Yeasen Biotech Co., Ltd, Shanghai, China) on a LightCycler® real‐time PCR system (Thermo Fisher Scientific) in accordance with the manufacturer’s instructions. The primers are listed in Table S2.
Intracellular ketone body detection
Cells (approximately 18 × 106) were collected by centrifugation (2000 g for 10 min at 4 °C). The cell pellet was resuspended in 1–2 mL of cold assay buffer. The cell suspension was sonicated 20× at bursts of 1 s and centrifuged at 10 000 g for 10 min at 4 °C. The supernatant was removed and stored on ice. After sample preparation, the colorimetric assay kits [β‐hydroxybutyrate (β‐HB), ab83390, Abcam; acetoacetate (AcAc), ab180875, Abcam] were used in accordance with the manufacturer’s instructions. The absorbance at 450 or 550 nm was recorded using a microplate spectrophotometer (BioTek).
Bioinformatics analyses
Two expression microarrays, GSE130970 and GSE126848, containing liver samples with or without steatosis were available in the GEO database (https://www.ncbi.nlm.nih.gov/geo).
Mitochondrial complex activity assay
In total, 5 × 10⁶ cells from each group (Sh‐NC, Sh‐1# and Sh‐2#) were used for mitochondria isolation using the Cell Mitochondria Isolation Kit (Beyotime). Next, the activities of mitochondrial complex I–IV were evaluated using a Mitochondrial Respiratory Chain Complex I–IV Activity Assay Kit (Solarbio, Beijing, China) in accordance with the manufacturer’s instructions. The activity of mitochondrial complex I–IV was expressed as μmol/(min × mg).
Immunohistochemistry
The paraffin‐embedded liver tissue was deparaffinized with standard protocols and rehydrated. After antigen retrieval, the tissue was blocked and incubated with the anti‐SAMM50 (dilution 1 : 500) antibody overnight at 4 °C. Then, the slides were washed and incubated with biotin‐labeled goat anti‐mouse IgG (H + L) at 37 °C for 15 min and developed with 3,3ʹ‐diaminobenzidine work solution. Images were obtained using a Leica microscope.
Palmitate‐driven oxygen consumption rate (OCR)
An equal amount of Hep3B cells (6000 per well) were seeded in a 96‐well plate and cultured in the substrate‐limited growth media [glucose 0.5 mm, glutamine or GlutaMAX 1.0 mm, serum (e.g. fetal bovine serum) 1.0%, XF l‐carnitine 0.5 mm] for 12 h. Before initiation, the media was substituted with substrate‐limited assay media (XF glucose 2.0 mm, XF l‐carnitine 0.5 mm) and the cell plate was placed in non‐CO2, 37 °C incubator for 60 min. Then, the rate of O2 changes in the immediate vicinity of the cells was analyzed using a Seahorse XFe96 Analyzer (Agilent Technologies, Santa Clara, CA, USA). The rates were calculated based on the ratio of concentration changes versus time measured during continuous 3‐min measurement periods followed by 3 min of mixing and 2 min of incubation. Injectors deliver the inhibitors (oligomycin 2 μm, FCCP 2 μm, and R/A 1.2 μm) into the chamber followed by mixing for 3 min and measuring for 3 min. The levels of O2 consumption rate in the presence of palmitate were considered as the capacity of intracellular FAO.
Statistical analysis
Hardy–Weinberg equilibrium was examined using a chi‐squared test. A Student’s t‐test or the Mann–Whitney U‐test were used to evaluate the statistical difference between two groups. A chi‐squared test was performed to compare categorical variables. Differences with respect to quantitative clinical data in patients with different genotypes were analyzed by the Kruskal–Wallis test followed by the post‐hoc Dunn’s test. P < 0.05 was considered statistically significant. In in vitro studies, Student’s t‐test was applied to analyze the difference between two groups. For more than two groups, one‐way analysis of variance (ANOVA) followed by a least significant difference (LSD) test was applied. Statistical analyses were performed using spss, version 22.0 (IBM Corp., Armonk, NY, USA).
Results
Baseline characteristics of NAFLD patients and normal controls
The demographic and clinical characteristics of NAFLD patients and normal controls are presented in Table 1. Compared with the normal controls, NAFLD patients had significantly higher levels of serum TG, LDL, ALT, AST and alkaline phosphatase (AKP) (all P < 0.05). However, no significant differences were observed between the two groups in terms of body mass index (BMI), total cholestrol (TC), HDL, blood glucose (GLU) and glycated albumin (GA) (all P > 0.05, Table 1).
Table 1.
Demographic and clinical characteristics of NAFLD patients and normal controls. SBP, systolic blood pressure; DBP, diastolic blood pressure; TBIL, total bilirubin; γ‐GT, gamma glutamyltransferase. Data are given as the mean ± SD or as the number of cases
| NAFLD (n = 380) | Normal controls (n = 380) | P | |
|---|---|---|---|
| Gender (male/female) | 226/154 | 224/156 | 0.883 a |
| Age (years) | 45.6 ± 13.1 | 45.3 ± 13.4 | 0.745 |
| BMI (kg m−2) | 23.3 ± 1.5 | 23.0 ± 2.4 | 0.065 |
| SBP (mmHg) | 116.2 ± 13.0 | 115.89 ± 13.2 | 0.718 |
| DBP (mmHg) | 76.3 ± 8.6 | 76.0 ± 8.5 | 0.554 |
| TC (mmol·L−1) | 4.2 ± 1.7 | 4.0 ± 1.7 | 0.236 |
| TG (mmol·L−1) | 1.7 ± 1.0 | 1.3 ± 0.6 | 0.000* |
| HDL (mmol·L−1) | 1.4 ± 0.3 | 1.4 ± 0.3 | 0.703 |
| LDL (mmol·L−1) | 3.1 ± 1.0 | 2.8 ± 0.9 | 0.001* |
| ALT (IU·L−1) | 26.2 ± 11.8 | 23.1 ± 10.6 | 0.000* |
| AST (IU·L−1) | 27.8 ± 12.1 | 24.9 ± 10.1 | 0.000* |
| TBIL (μmol·L−1) | 11.2 ± 4.6 | 11.3 ± 5.1 | 0.669 |
| DBIL (μmol·L−1) | 2.9 ± 1.2 | 2.9 ± 1.5 | 0.635 |
| γ‐GT (IU·L−1) | 37.9 ± 28.4 | 34.3 ± 27.3 | 0.071 |
| AKP(IU·L−1) | 84.6 ± 27.1 | 79.2 ± 25.6 | 0.005* |
| GLU (mmol·L−1) | 5.1 ± 0.8 | 5.1 ± 0.7 | 0.084 |
| GA (%) | 13.8 ± 2.0 | 13.6 ± 1.8 | 0.207 |
P < 0.05 indicates statistical significance.
Statistical significance was determined by chi‐squared analysis, as well as Student’s t‐test or the Mann–Whitney U‐test based on variable types.
Allele and genotype frequency analysis
Allelic frequencies of SAMM50 polymorphisms (rs738491 and rs2073082) were in Hardy–Weinberg equilibrium in both NAFLD and control groups (Table 2). The genotypes were evaluated in all individuals using the TaqMan SNP genotyping method. As summarized in Table 2, the T‐allele frequency of rs738491 and the G‐allele frequency of rs2073082 were more prevalent in the NAFLD group compared to those in the control group [T: 52.3% > 44.0%, odds ratio (OR) = 1.39, 95% confidence interval (CI) = 1.14–1.71, P = 0.001; G: 71.2% > 65.4%, OR = 1.31, 95% CI = 1.05–1.62, P = 0.016]. These results are consistent with a previous study performed in a Chinese Han population in 2015 [14]. Furthermore, the proportion of NAFLD patients in cohorts with different genotypes was compared using the Cochran–Armitage trend test. As shown in Table 3, compared with the CC genotype of rs738491, the proportion of NAFLD patients in the genotype TT or CT cohort was significantly higher. The OR exhibits a dose‐dependent effect at the rs738491 locus, indicating that each copy of rs738491 T allele increases the risk of fatty liver (TT, OR = 1.97, 95% CI = 1.30–2.98; CT, OR = 1.38, 95% CI = 0.98–1.96; P = 0.001). Similar findings were obtained when comparing the OR of GG or AG versus AA at rs2073082 locus (GG, OR = 1.60, 95% CI = 0.96–2.65; AG, OR = 1.14, 95% CI = 0.69–1.90; P = 0.015). Also, chi‐squared analysis showed that subjects carrying T allele of rs738491 were more likely to have NAFLD (TT + CT vs. CC, OR = 1.54, 95% CI = 1.11–2.14, P = 0.009). However, the correlation between the G‐allele carriers of rs2073082 and the occurrence of NAFLD was not statistically significant (GG + AG vs. AA, OR = 1.36, 95% CI = 0.84–2.20, P = 0.216).
Table 2.
Correlation between frequencies of allele at loci rs738491 and rs2073082 and the risk of NAFLD. HWE, Hardy–Weinberg; NC, normal controls
| Groups | Cases, n | HWE, P‐value | Frequency of allele | P | ||
|---|---|---|---|---|---|---|
| C (%) | T (%) | |||||
| rs738491 | NAFLD | 372 | 0.725 | 355 (47.7) | 389 (52.3) | 0.001* |
| NC | 378 | 0.625 | 423 (56.0) | 333 (44.0) | ||
| OR (95% CI) | 1.00 (Ref) | 1.39 (1.14–1.71) | ||||
| Groups | Cases, n | HWE, P‐value | Frequency of allele | P | ||
|---|---|---|---|---|---|---|
| A (%) | G (%) | |||||
| rs2073082 | NAFLD | 378 | 0.887 | 218 (28.8) | 538 (71.2) | 0.016* |
| NC | 377 | 0.521 | 261 (34.6) | 493 (65.4) | ||
| OR (95% CI) | 1.00 (Ref) | 1.31 (1.05–1.62) | ||||
Data are presented as proportions [n, (%)] of SAMM50 allelic frequency, P‐values were determined by a chi‐squared test.
P < 0.05 indicates statistical significance.
Table 3.
Association between rs738491 and rs2073082 genotypes and the risk of NAFLD
| SNP | Genotypes | NAFLD | Controls | OR | P |
|---|---|---|---|---|---|
| n (%) | n (%) | (95% CI) | |||
| rs738491 | 372 | 378 | |||
| CC | 83 (41.7) | 116 (58.3) | 1.00 (Ref) | 0.001* | |
| CT | 189 (49.7) | 191 (50.3) | 1.38 (0.98–1.96) | ||
| TT | 100 (58.5) | 71 (41.5) | 1.97 (1.30–2.98) | ||
| TT + CT vs. CC | 1.54 (1.11–2.14) | 0.009a | |||
| rs2073082 | 378 | 377 | |||
| AA | 32 (43.2) | 42 (56.8) | 1.00 (Ref) | 0.015* | |
| AG | 154 (46.5) | 177 (53.5) | 1.14 (0.69–1.90) | ||
| GG | 192 (54.9) | 158 (45.1) | 1.60 (0.96–2.65) | ||
| GG + AG vs. AA | 1.36 (0.84–2.20) | 0.216a |
Data are presented as proportions [n, (%)] of SAMM50 genotypes (rs738491 and rs2073082).
P < 0.05 indicates statistical significance.
P‐values were determined by the Cochran–Armitage trend test comparing the mild fatty liver group with the moderate to severe fatty liver group.
Statistical significance was determined by chi‐squared analysis.
Clinical and biochemical features of NAFLD patients with different genotypes of the rs738491 and rs2073082 SNPs
As summarized in Table 4, patients with different rs738491 genotypes showed significant differences in TG, LDL, ALT and AST levels (all P < 0.05). Dunn’s test was additionally performed for multiple comparisons of genotypes to determine the pattern of the differences. The result showed the TG levels in patients carrying the TT or CT genotype were higher than in those carrying the CC genotype (CC vs. CT; TT vs. CC, all P < 0.05) (Table 4). The serum levels of LDL, ALT and AST in patients carrying the TT or CC genotypes were also compared and these parameters were higher in patients with TT genotypes. Among these parameters, some were also higher in those with the heterozygous CT genotype compared with the CC homozygous genotype (e.g. TG and ALT) (Table 4). Similarly, serum TG, AST, ALT and direct bilirubin (DBIL) levels were different among rs2073082 genotypes (all P < 0.05) (Table 4), with all parameters being higher (except for DBIL) in the GG genotype group. The results from multiple comparisons showed that serum AST was significantly elevated in patients carrying the GG genotype compared to those with the AA genotype (Table 4). These results suggest that the genotypes of rs738491 (TT and CT) and rs2073082 (GG) are associated with higher levels of TG, ALT and AST, implying that abnormal lipid metabolism and liver dysfunction were related to patients with SAMM50 polymorphisms.
Table 4.
Correlation between genotypes at loci rs738491and rs2073082, as well as baseline clinical information in the NAFLD group. TBIL, total bilirubin; γ‐GT, gamma glutamyltransferase.
| rs738491 | rs2073082 | |||||||
|---|---|---|---|---|---|---|---|---|
| Genotypes | P | Genotypes | P | |||||
| CC | CT | TT | AA | AG | GG | |||
| Cases | 83 | 189 | 100 | 32 | 154 | 192 | ||
| Gender (male/female) | 46/37 | 118/71 | 60/40 | 0.553 a | 22/10 | 93/61 | 109/83 | 0.413 a |
| Age (years) | 44.1 ± 13.5 | 45.8 ± 13.7 | 46.3 ± 11.7 | 0.413 | 42.6 ± 14.0 | 44.3 ± 13.4 | 47.1 ± 12.6 | 0.038* |
| BMI (kg m−2) | 23.2 ± 1.3 | 23.4 ± 1.7 | 23.2 ± 1.2 | 0.572 | 23.1 ± 1.6 | 23.4 ± 1.5 | 23.2 ± 1.5 | 0.342 |
| SBP (mmHg) | 115.1 ± 14.8 | 117.2 ± 12.8 | 114.9 ± 11.9 | 0.246 | 120.3 ± 15.5 | 115.9 ± 12.8 | 115.9 ± 12.8 | 0.220 |
| DBP (mmHg) | 75.3 ± 8.5 | 76.8 ± 8.5 | 75.8 ± 8.0 | 0.285 | 77.8 ± 8.7 | 75.9 ± 8.2 | 76.5 ± 8.9 | 0.427 |
| TC (mmol·L−1) | 3.9 ± 1.7 | 4.2 ± 1.7 | 4.3 ± 1.8 | 0.201 | 3.8 ± 1.7 | 4.2 ± 1.7 | 4.2 ± 1.7 | 0.414 |
| TG (mmol·L−1) | 1.5 ± 1.0a | 1.7 ± 1.0 | 1.8 ± 1.0c | 0.009* | 1.5 ± 1.0 | 1.6 ± 0.8 | 1.8 ± 1.1 | 0.035* |
| HDL (mmol·L−1) | 1.3 ± 0.3 | 1.4 ± 0.3 | 1.4 ± 0.3 | 0.133 | 1.3 ± 0.3 | 1.4 ± 0.3 | 1.4 ± 0.3 | 0.063 |
| LDL (mmol·L−1) | 2.8 ± 0.9 | 3.0 ± 1.0b | 3.3 ± 1.0c | 0.001* | 2.8 ± 1.0 | 3.0 ± 1.0 | 3.1 ± 1.0 | 0.136 |
| ALT (IU·L−1) | 21.8 ± 7.7a | 26.4 ± 11.7 | 29.0 ± 13.8c | 0.000* | 22.9 ± 8.6 | 25.0 ± 11.3 | 27.7 ± 12.5 | 0.034* |
| AST (IU·L−1) | 24.8 ± 9.1 | 27.7 ± 11.3 | 31.2 ± 14.8c | 0.013* | 22.4 ± 8.6 | 27.3 ± 11.1 | 29.3 ± 13.0c | 0.011* |
| TBIL (μmol·L−1) | 10.5 ± 4.2 | 11.4 ± 5.0 | 11.3 ± 4.2 | 0.506 | 10.4 ± 4.4 | 10.8 ± 4.8 | 11.6 ± 4.5 | 0.191 |
| DBIL (μmol·L−1) | 2.8 ± 1.1 | 3.0 ± 1.3 | 2.7 ± 1.1 | 0.152 | 2.6 ± 1.0 | 3.1 ± 1.2b | 2.7 ± 1.2 | 0.003* |
| γ‐GT (IU·L−1) | 33.0 ± 19.8 | 40.0 ± 29.3 | 39.2 ± 33.0 | 0.145 | 32.8 ± 18.1 | 35.8 ± 27.1 | 40.2 ± 30.6 | 0.462 |
| AKP (IU·L−1) | 86.2 ± 28.0 | 82.6 ± 26.5 | 87.4 ± 27.2 | 0.314 | 90.1 ± 26.0 | 84.0 ± 26.2 | 83.9 ± 28.0 | 0.407 |
| GLU (mmol·L−1) | 5.0 ± 0.8 | 5.2 ± 0.8 | 5.2 ± 1.0 | 0.279 | 5.0 ± 0.8 | 5.1 ± 0.8 | 5.3 ± 0.9 | 0.101 |
| GA (%) | 13.5 ± 1.6 | 13.6 ± 1.8 | 14.2 ± 2.6 | 0.156 | 13.6 ± 1.2 | 13.6 ± 1.9 | 13.8 ± 2.3 | 0.845 |
Data are presented as the mean ± SD of SAMM50 genotypes (rs738491 and rs2073082).
P < 0.05 indicates statistical significance.
Statistical significance was determined by chi‐squared analysis, as well as by the Kruskal–Wallis test with Dunn’s test for multiple comparisons. Statistical significance is indicated (aC/C vs. C/T in rs738491, A/A vs. A/G in rs2073082, bC/T vs. T/T in rs738491, A/G vs. G/G in rs2073082, CC/C vs. T/T in rs738491, A/A vs. G/G in rs2073082.
Associations between SAMM50 polymorphisms and severity of NAFLD
To assess whether the SAMM50 gene polymorphisms exhibited association with the severity of NAFLD, we divided the NAFLD patients into two groups (mild fatty liver and moderate to severe fatty liver) (Table 5) according to ultrasonic diagnostic criteria and compared the proportion of moderate to severe fatty liver among the different genotypes. As summarized in Table 5, rs738491 genotypes demonstrated a strong association with the severity of fatty liver and, with an increase in the number of T alleles, the risk of moderate to severe fatty liver increased (TT, OR = 3.08, 95% CI = 1.67–5.68; CT, OR = 2.11, 95% CI = 1.22–3.65; P < 0.001) (Table 5). Additionally, T‐allele carriers had a higher risk of moderate to severe fatty liver (TT + CT vs. CC, OR = 2.40, 95% CI = 1.42–4.05, P = 0.001) in the NAFLD cohort. Similar results were noted in the rs2073082 locus in terms of the association with the severity of fatty liver (GG, OR = 2.61, 95% CI = 1.15–5.93; AG, OR = 2.02, 95% CI = 0.88–4.65; P = 0.021) (Table 5). Additionally, a higher risk of having moderate to severe fatty liver was seen in patients carrying the G allele (GG + AG vs. AA, OR = 2.33, 95% CI = 1.04–5.18, P = 0.034) (Table 5). Meanwhile, rs738491 T‐allele carriers (TT + CT) had higher levels of ALT and AST (all P < 0.05) (Table S3). Patients harboring the G allele (GG + AG) of rs2073082 only had a higher serum AST level (AST, GG + AG: 28.4 ± 12.3 IU·L−1; AA: 22.4 ± 8.6 IU·L−1, P < 0.05) (Table S3). However, G‐allele carriers and noncarriers showed no differences in ALT level. In addition, we also noted that being a risk allele carrier (T or G alleles) did not affect the levels of AST and ALT in the healthy control group or all participants as compared to noncarriers (Table S3). Taken together, these results suggest that SAMM50 rs738491 and rs2073082 were highly correlated with the severity of NAFLD.
Table 5.
Association between the genotypes of rs738491 and rs2073082 and the severity of NAFLD. Ultrasonic diagnosis criteria were: (1) diffuse enhancement of near‐field echo in the hepatic region (stronger than in the kidney and spleen region) and gradual attenuation of the far‐field echo; (2) unclear display of the intra‐hepatic lacuna structure; (3) presentation of mild to moderate hepatomegaly with a round and blunt border; (4) color Doppler ultrasonography shows reduced blood flow in the liver, which may be difficult to detect, but the distribution of blood flow is normal; and (5) unclear or non‐intact display of the envelope of the right liver lobe and diaphragm. Patients with a mild degree of fatty liver disease demonstrate item 1 and any one of items 2–4; patients with moderate fatty liver disease demonstrate item 1 and any two of items 2–4; patients with severe degree of fatty liver disease demonstrate items 1 and 5 and any two of items 2–4. Data are presented as proportions [n, (%)] of SAMM50 genotypes (rs738491 and rs2073082). P‐values were determined by the Cochran–Armitage test comparing the mild fatty liver group with the moderate to severe fatty liver group
| SNPs | Genotype | Mild fatty liver, n (%) | Moderate to severe fatty liver, n (%) | OR (95% CI) | P |
|---|---|---|---|---|---|
| rs738491 | CC | 58 (69.9%) | 25 (30.1%) | 1.00 (Ref) | < 0.001 |
| CT | 99 (52.4%) | 90 (47.6%) | 2.11 (1.22–3.65) | ||
| TT | 43 (43.0%) | 57 (57.0%) | 3.08 (1.67–5.68) | ||
| TT + CT vs. CC | 2.40 (1.42–4.05) | 0.001 a | |||
| rs2073082 | AA | 23 (71.9%) | 9 (28.1%) | 1.00 (Ref) | 0.021 |
| AG | 86 (55.8%) | 68 (44.2%) | 2.02 (0.88–4.65) | ||
| GG | 95 (49.5%) | 97 (50.5%) | 2.61 (1.15–5.93) | ||
| GG + AG vs. AA | 2.33 (1.04–5.18) | 0.034 a |
P < 0.05 indicates statistical significance.
Statistical significance was determined by chi‐squared analysis.
SAMM50 deficiency enhances lipid accumulation in cells
Consistent with previous studies [11], our result further confirm that SAMM50 polymorphisms (rs738491 and rs2073082) are associated with an elevated risk of NAFLD. However, the mechanistic basis of this association is poorly defined. To this aim, Hep3B cells stimulated with PA or a mixture of PA and OA (OA : PA) were used to investigate the endogenous change of SAMM50 because these in vitro models are known to mimic NAFLD in vivo [15]. The cells demonstrated increased lipid accumulation in a time‐ and dose‐dependent manner after PA stimulation (Fig. 1A). Concomitant to lipid accumulation, PA stimulation markedly enhanced SAMM50 expression at the protein and mRNA levels (Fig. 1B). Similarly, the RNA‐seq data (GSE130970 and GSE126848) from the GEO database confirmed that the transcript levels of SAMM50 were higher in NAFLD patients (Fig. 1C). Immunohistochemistry (IHC) staining analysis indicated that SAMM50 expression has an upregulation trend in the liver of patients with steatosis compared with that in the normal liver (Fig. 1D). Taken together, these results suggest lipid overload would cause the upregulation of SAMM50 expression.
Fig. 1.
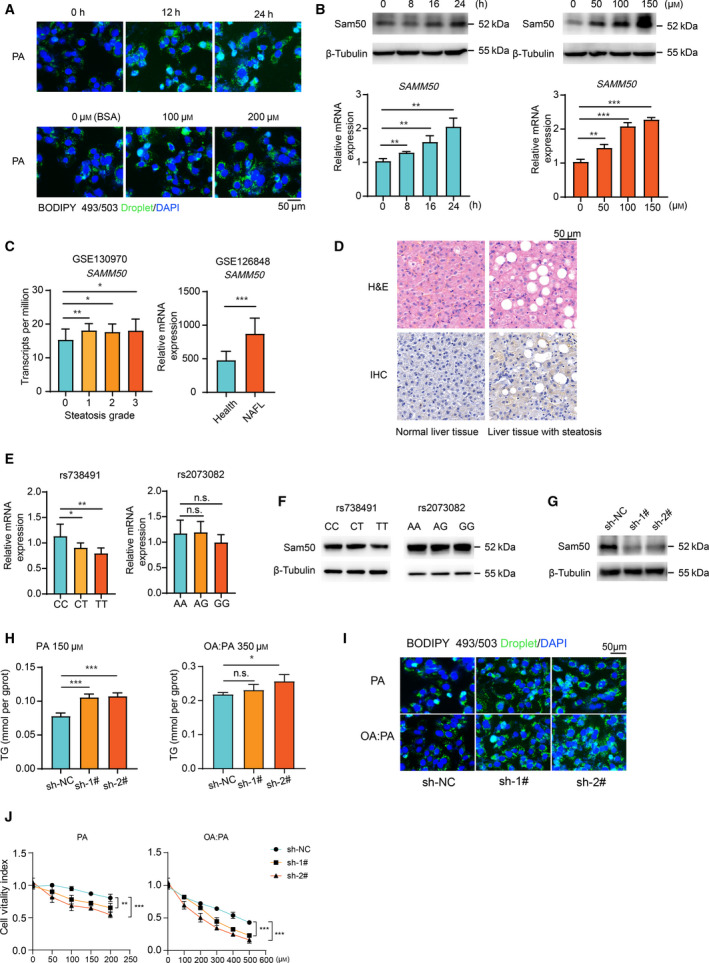
SAMM50 knockdown caused lipid accumulation in human hepatoma cells under fatty acid treatment. (A) Staining of lipid droplets (green) by BODIPY 493/503 in Hep3B cells with PA stimulation. Scale bars = 50 μm. (B) Protein and mRNA levels (n = 3) of SAMM50 in Hep3B cells after PA treatment. (C) The mRNA levels of SAMM50 in patients with or without hepatic steatosis from the GEO database. (D) Representative photos of immunohistochemical staining with SAMM50 on liver tissues with or without steatosis. Scale bars = 50 μm. (E) Hepatic mRNA levels of SAMM50 among genotypes (CC = 8, CT = 5, TT = 4; AA = 8, AG = 5, GG = 6). (F) Hepatic SAMM50 protein levels among genotypes were detected by immunoblotting. (G) Verification of SAMM50 knockdown by immunoblotting. (H,I) Intracellular TG content in SAMM50 knockdown cells with fatty acid stimulation for 24 h. Scale bars = 50 μm. (J) The cell viabilities are compared between SAMM50 knockdown and control groups after fatty acid stimulation (n = 5). Statistical analyses were performed using Student’s t‐test between two groups or one‐way ANOVA followed by a LSD test for more than two groups. Data are expressed as the mean ± SD, *P < 0.05, **P < 0.01, ***P < 0.001, n.s., not significant
To explore the impact of gene polymorphisms on SAMM50 expression, we found lower mRNA levels of SAMM50 in subjects harboring a homozygous TT genotype of rs738491 and a GG genotype of rs2073082 (Fig. 1E), which was also confirmed by the protein levels in the liver of patients carrying the TT genotype (Fig. 1F, left), although SAMM50 protein expression in the GG genotype was not significantly different from that in the AA genotype (Fig. 1F, right). To explore the effect of SAMM50 deficiency on intracellular lipid accumulation, a cell line with the highest expression of SAMM50, Hep3B, was selected (Fig. S1A and S1B). SAMM50 knockdown Hep3B cells were generated using SAMM50‐targeting shRNAs (sh‐1#, sh‐2# and sh‐NC as a control) (Fig. 1G and S1C). We found that the intracellular TG content was higher in SAMM50 knockdown Hep3B cells treated with PA or OA : PA (Fig. 1H). BODIPY 493/503 staining of neutral lipid droplets demonstrated that knockdown of SAMM50 increased lipid content in Hep3B cells (Fig. 1I). Additionally, cell viability assay showed that SAMM50 knockdown caused fatty acid intolerance after PA or OA : PA treatment (Fig. 1J) because lipid overload within cells would induce endoplasmic reticulum stress and cause subsequent cell death [16]. Overall, these results reveal that the expression of SAMM50 is upregulated in fatty liver and that SAMM50 knockdown enhances lipid accumulation in cells.
Decreased FAO in SAMM50 knockdown cells
Intrahepatic TG accumulation occurs partially as a result of the imbalance of fatty acid uptake, synthesis and insufficient disposal (e.g. FAO) [17]; however, it is not clear which metabolic process changes in the absence of SAMM50. NAFLD is characterized in part by an excessive accumulation of TG in cells (also known as hepatic steatosis) as a result of enhanced hepatic fatty acid synthesis. Several genes are involved in this process (e.g. Acacb, Srebf1, Fasn, etc.). However, our results indicated that the expression of these genes was not influenced by SAMM50 deficiency after PA treatment, nor did genes involved in fatty acid uptake [18, 19], such as Cd36 and Fabp1 (Fig. 2A). Fabps (Fabp2, Fabp3, Fabp4 and Fabp5) play a key role in the intracellular transport of long‐chain fatty acids (such as PA or OA) and their acyl‐CoA esters [20, 21]. Nevertheless, the expression of Fabps was unchanged in SAMM50 knockdown cells (Fig. 2A). Taken together, these findings indicate that that SAMM50 deficiency is unlikely to promote intracellular lipid accumulation by enhancing these processes.
Fig. 2.
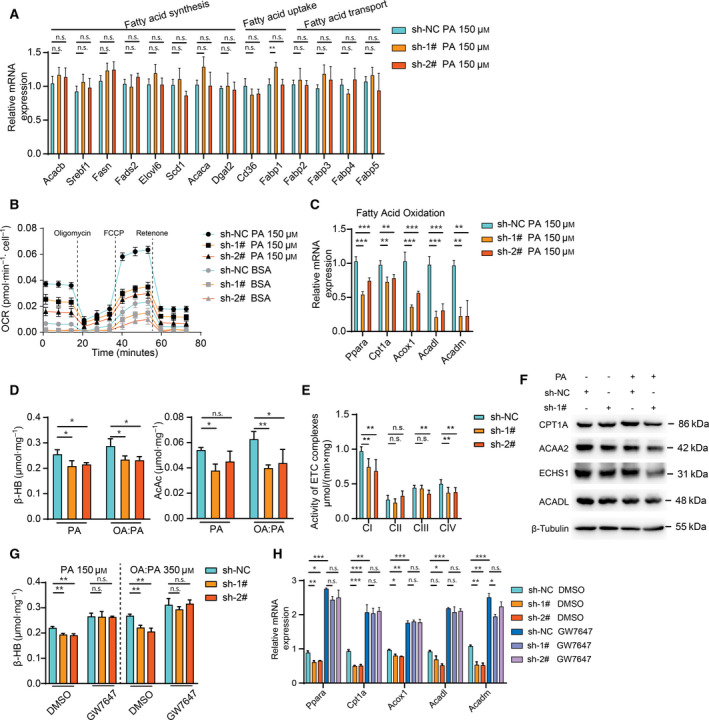
FAO is impaired as a result of SAMM50 deficiency. (A) The mRNA levels of the fatty acid metabolism‐related genes in both SAMM50 knockdown and control groups (n = 3). Gene expression levels were normalized for Actb. (B) The OCR using palmitate (or BSA) as the only substrate was measured in SAMM50 knockdown and control groups (n = 6). (C) The expression of FAO‐related genes in both SAMM50 knockdown and control groups after PA treatment. (D) Levels of ketone bodies (β‐HB and AcAc) within cells were tested and normalized to protein levels in SAMM50 knockdown cells after PA stimulation (n = 3). (E) The activity of electron transport chain complexes was compared between SAMM50 knockdown and control groups. (F) The levels of mitochondrial proteins involved in β‐oxidation were measured in SAMM50 knockdown group with or without PA treatment. (G,H) The β‐HB levels and the expression of FAO‐related genes between the two groups are shown after GW7647 (10 μm) treatment. Statistical analyses were performed using one‐way ANOVA followed by a LSD test. Data are expressed as the mean ± SD, *P < 0.05, **P < 0.01, ***P < 0.001, n.s., not significant
FAO, a significant process of energy output, usually occurs in mitochondria when there is excessive fatty acid [22, 23]. SAMM50 is indispensable with respect to maintaining the structure of mitochondrial cristae for proper function. Therefore, we determined whether FAO is disrupted in a SAMM50‐deficient condition. The OCR with palmitate as substrate was measured to assess the performance of FAO in SAMM50 knockdown cells. As shown in Fig. 2B, SAMM50 knockdown cells had lower palmitate‐dependent OCR than the NC group. The expression of relevant genes in FAO (Ppara, Cpt1a, Acox1, Acadl and Acadm) was decreased in SAMM50 knockdown cells when treated with PA or OA : PA for 48 h (Fig. 2C and S2A). The levels of ketone bodies (β‐HB and AcAc), the surrogate marker of FAO [24], were also decreased after fatty acid challenge (Fig. 2D). In addition, the activity of the electron transport chain complexes was compromised to some extent (Fig. 2E). We also noted that the levels of mitochondrial proteins involved in β‐oxidation were also lower in the SAMM50 knockdown group after PA treatment (Fig. 2F). These results indicate that the decrease of FAO level caused by SAMM50 knockdown is partially a result of mitochondrial disfunction. Furthermore, the decreased expression of FAO‐related genes and the lower levels of ketone bodies in SAMM50 knockdown cells could be reversed after using GW7647, the agonist of PPARα (Fig. 2G, S2B and 2H) because PPARα activation would enhance the FAO process. Moreover, overexpression of SAMM50 increased the expression of FAO‐related genes (Fig. 3A, 3B and S2C), as well as the palmitate‐dependent OCR levels (Fig. 3C). We also found that SAMM50 overexpression reduced intracellular lipid accumulation in SAMM50 knockdown cells (Fig. 3D,E) and elevated ketone body levels (Fig. 3F and S2D) in the PA‐ or OA : PA‐induced lipid accumulation model. Taken together, we concluded that SAMM50 deficiency decreased the FAO process and caused lipid accumulation.
Fig. 3.
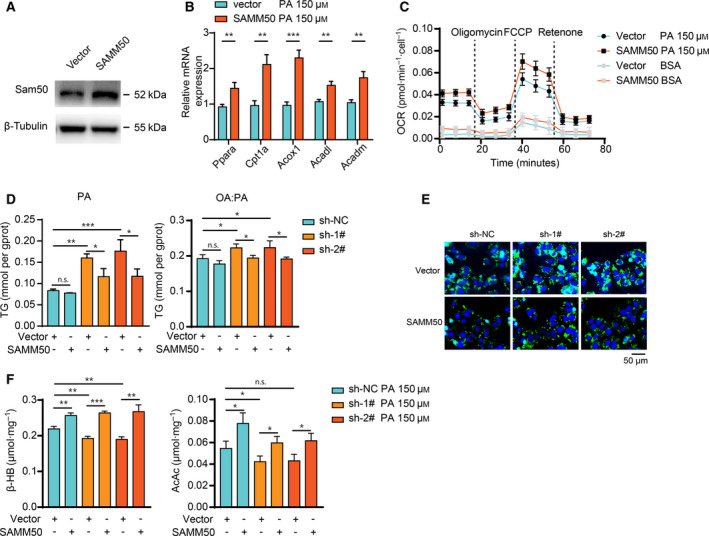
Overexpression of SAMM50 mitigates lipid accumulation and enhances FAO. (A) Overexpression of SAMM50 was verified by immunoblotting. (B) Overexpression of SAMM50 increased the expression of FAO‐related genes after PA stimulation. (C) Overexpression of SAMM50 increased the palmitate‐dependent OCR in Hep3B cells. (D,E) Overexpression of SAMM50 in SAMM50 knockdown cells mitigates lipid accumulation, as indicated by staining of lipid droplets with BODIPY 493/503 and intracellular TG detection. Scale bars = 50 μm. (F) Overexpression of SAMM50 elevated the levels of ketone bodies (β‐HB and AcAc) in SAMM50 knockdown cells after PA challenge for 48 h, n = 3. Statistical analyses were performed using one‐way ANOVA followed by a LSD test. Data are expressed as the mean ± SD, *P < 0.05, **P < 0.01, ***P < 0.001, n.s., not significant
Discussion
NAFLD is a general pathology that comprises a continuum of liver diseases varying from mild liver injury to serious inflammatory processes, such as non‐alcoholic steatohepatitis, which result in fibrosis and even NAFLD‐related hepatocellular carcinoma [25]. By 2030, the number of NAFLD cases is expected to reach 100.9 million [26]. Overnutrition and sedentary lifestyle have been considered as the main causes of NAFLD [27] and genetic variants, including PNPLA3 rs738409, TM6SF2 rs58542926 and HSD17B13 rs72613567, in patients may accelerate or decelerate the progression of NAFLD [28, 29, 30]. The present study focused on another candidate gene, SAMM50, aiming to investigate its association with NAFLD in a Chinese cohort (Table S4). Our results indicated that the T allele of rs738491 or G allele of rs2073082 was highly correlated with the occurrence and progression of NAFLD. Additionally, our data showed that patients with the T allele or G allele had elevated serum TG, AST and ALT levels, suggesting that genetic variants of SAMM50 are associated with abnormal lipid metabolism and liver injury.
Previous studies have reported that the T allele of rs738491 showed a strong association with NAFLD in a Japanese population [10], which is in agreement with our results. However, T‐allele carriers had a decreased level of serum TG in the Japanese cohort. This finding is opposite to our results, which may be a result of differences in the populations or the phenomenon that SNPs in the other gene had a stronger impact on TG levels than the SNP in the SAMM50 gene. Further investigations in a large cohort are warranted to address this discrepancy. In addition, it should be noted that rs738491 T‐allele carriers tend to have a risk of moderate to severe fatty liver disease in terms of NAFLD. These results demonstrate that rs738491 may play an essential role in the progression of NAFLD. Furthermore, the G allele of rs2073082 is also associated with a higher incidence of NAFLD. To the best of our knowledge, this is the first report to evaluate the association of rs2073082 locus with NAFLD in the Chinese Han population. Our results suggest an association between the rs2073082 G allele and the occurrence and progression of NAFLD, and also that the carriers had higher levels of serum TG and AST.
Although SAMM50 is implicated in the risk of NAFLD, the underlying mechanisms are poorly defined. The SAMM50 gene, which encodes Sam50, is critical for the stability of mitochondrial structure and the function of mitochondria [31]. Therefore, we hypothesized that SAMM50 deficiency as a result of genetic change may be involved in mitochondrial dysfunction. Experiments conducted in vitro showed that the expression of FAO‐related genes was significantly lower in SAMM50 knockdown cells. The OCR is an important index for directly assessing the ability of FAO using palmitate as the only substrate. Our results showed that this rate was reduced in SAMM50 knockdown groups. Meanwhile, the result of FAO is the production of ketone bodies, including β‐HB and AcAc. Therefore, the ketone bodies produced from cells were measured, confirming that SAMM50 knockdown cells did produce less ketone bodies. Additionally, overexpression of SAMM50 reversed the phenotype caused by SAMM50 deficiency, which further bolsters our hypothesis. Taken together, these results suggest a pivotal role of SAMM50 in FAO, and the loss of the gene would impair FAO and cause lipid accumulation in cells.
Except for FAO, we noted no significant differences in terms of the expression of fatty liver synthesis‐, uptake‐ and transport‐related genes after SAMM50 knockdown. Identification of the changed processes involved in fatty acid metabolism in SAMM50 knockdown cells is essential for understanding of the occurrence of NAFLD because the liver is the pivotal hub for lipid metabolism. The input of fatty acids did not increase; however, disposal was impaired. The imbalance between the input and output behavior causes excessive fatty acid accumulation [32] and the formation of fatty acid pools [26], thus inducing intracellular lipid accumulation. This phenomenon may explain why SAMM50 knockdown causes lipid accumulation.
In conclusion, the present study has demonstrated that SNPs (rs738491 and rs2073082) of the SAMM50 gene are associated with susceptibility to and severity of NAFLD in a sample of Chinese Han population. The underlying mechanism may be attributed to the impaired FAO caused by SAMM50 deficiency.
Conflict of interests
The authors declare that they have no conflicts of interest.
Author’s contributions
XW designed the study. XZ, YW, GS and CX acquired the clinical and laboratory data. ZL, WS and GW analyzed the data and drafted the manuscript.
Supporting information
Fig S1. SAMM50 knockdown caused lipid accumulation in human hepatoma cells under fatty acid treatment.
Fig S2. Decreased fatty acid oxidation in SAMM50‐knockdown cells.
Table S1. International serial number, gene name and location of SNPs (ABI), as well as the sequence of detection probe.
Table S2. The primer pairs used in the present study.
Table S3. Comparison of liver function markers among patients with different genotypes at loci rs738491 and rs2073082.
Table S4. SNP profiling results of 760 individuals.
Acknowledgements
We thank Heming Zhou for kindly providing QGY7703, LO2, LM3, MHCC97H and Bel‐7402 cell lines. This study was supported by grants from the National Natural Science Foundation of China (grant no. 81670514 and no. 81702337).
Zuyin Li, Weixing Shen and Gang Wu contributed equally to this work.
Data availability
The data that support the findings of this study are available in the supplementary material of this article. Table S4 SNP profiling results of 760 individuals.
References
- 1. Trepo E and Valenti L (2020) Update on NAFLD genetics: from new variants to the clinic. J Hepatol 72, 1196–1209. [DOI] [PubMed] [Google Scholar]
- 2. Kanda T, Goto T, Hirotsu Y, Masuzaki R, Moriyama M and Omata M (2020) Molecular mechanisms: connections between nonalcoholic fatty liver disease, steatohepatitis and hepatocellular carcinoma. Int J Mol Sci 21. [DOI] [PMC free article] [PubMed] [Google Scholar]
- 3. Luo JJ, Cao HX, Yang RX, Zhang RN and Pan Q (2018) PNPLA3 rs139051 is associated with phospholipid metabolite profile and hepatic inflammation in nonalcoholic fatty liver disease. World J Clin Cases 6, 355–364. [DOI] [PMC free article] [PubMed] [Google Scholar]
- 4. Chen LZ, Xia HH, Xin YN, Lin ZH and Xuan SY (2015) TM6SF2 E167K Variant, a Novel genetic susceptibility variant, contributing to nonalcoholic fatty liver disease. J Clin Transl Hepatol 3, 265–270. [DOI] [PMC free article] [PubMed] [Google Scholar]
- 5. Gao H, Liu S, Zhao Z, Yu X, Liu Q, Xin Y and Xuan S (2019) Association of GCKR gene polymorphisms with the risk of nonalcoholic fatty liver disease and coronary artery disease in a Chinese Northern Han Population. J Clin Transl Hepatol 7, 297–303. [DOI] [PMC free article] [PubMed] [Google Scholar]
- 6. Larrieta‐Carrasco E, Flores YN, Macias‐Kauffer LR, Ramirez‐Palacios P, Quiterio M, Ramirez‐Salazar EG, Leon‐Mimila P, Rivera‐Paredez B, Cabrera‐Alvarez G, Canizales‐Quinteros S et al. (2018) Genetic variants in COL13A1, ADIPOQ and SAMM50, in addition to the PNPLA3 gene, confer susceptibility to elevated transaminase levels in an admixed Mexican population. Exp Mol Pathol 104, 50–58. [DOI] [PMC free article] [PubMed] [Google Scholar]
- 7. Liu S, Gao Y, Zhang C, Li H, Pan S, Wang X, Du S, Deng Z, Wang L, Song Z and et al. (2016) SAMM50 affects mitochondrial morphology through the association of Drp1 in mammalian cells. FEBS Lett 590, 1313–1323. [DOI] [PubMed] [Google Scholar]
- 8. Jian F, Chen D, Chen L, Yan C, Lu B, Zhu Y, Chen S, Shi A, Chan DC and Song Z (2018) Sam50 regulates PINK1‐Parkin‐mediated mitophagy by controlling PINK1 stability and mitochondrial morphology. Cell Rep 23, 2989–3005. [DOI] [PubMed] [Google Scholar]
- 9. Macias J, Rivero‐Juarez A, Neukam K, Tellez F, Merino D, Frias M, Merchante N, Rivero A, Pineda JA, Real LM and et al.(2015) Impact of genetic polymorphisms associated with nonalcoholic fatty liver disease on HIV‐infected individuals. AIDS 29, 1927–1935. [DOI] [PubMed] [Google Scholar]
- 10. Kitamoto T, Kitamoto A, Yoneda M, Hyogo H, Ochi H, Nakamura T, Teranishi H, Mizusawa S, Ueno T, Chayama K et al. (2013) Genome‐wide scan revealed that polymorphisms in the PNPLA3, SAMM50, and PARVB genes are associated with development and progression of nonalcoholic fatty liver disease in Japan. Hum Genet 132, 783–792. [DOI] [PubMed] [Google Scholar]
- 11. Chung GE, Lee Y, Yim JY, Choe EK, Kwak MS, Yang JI, Park B, Lee JE, Kim JA and Kim JS (2018) Genetic polymorphisms of PNPLA3 and SAMM50 are associated with nonalcoholic fatty liver disease in a Korean population. Gut Liv 12, 316–323. [DOI] [PMC free article] [PubMed] [Google Scholar]
- 12. Alsabeeh N, Chausse B, Kakimoto PA, Kowaltowski AJ and Shirihai O (2018) Cell culture models of fatty acid overload: problems and solutions. Biochim Biophys Acta Mol Cell Biol Lipids 1863, 143–151. [DOI] [PMC free article] [PubMed] [Google Scholar]
- 13. Xiao C, Wang Y, Zheng M, Chen J, Song G, Zhou Z, Zhou C, Sun X, Zhong L, Ding E et al. (2018) RBBP6 increases radioresistance and serves as a therapeutic target for preoperative radiotherapy in colorectal cancer. Cancer Sci 109, 1075–1087. [DOI] [PMC free article] [PubMed] [Google Scholar]
- 14. Chen L, Lin Z, Jiang M, Lu L, Zhang H, Xin Y, Jiang X and Xuan S (2015) Genetic variants in the SAMM50 gene create susceptibility to nonalcoholic fatty liver disease in a Chinese Han population. Hepat Mon 15, e31076. [DOI] [PMC free article] [PubMed] [Google Scholar]
- 15. Moravcova A, Cervinkova Z, Kucera O, Mezera V, Rychtrmoc D and Lotkova H (2015) The effect of oleic and palmitic acid on induction of steatosis and cytotoxicity on rat hepatocytes in primary culture. Physiol Res 64, S627–S636. [DOI] [PubMed] [Google Scholar]
- 16. Wang J, He W, Tsai PJ, Chen PH, Ye M, Guo J and Su Z (2020) Mutual interaction between endoplasmic reticulum and mitochondria in nonalcoholic fatty liver disease. Lipids Health Dis 19, 72. [DOI] [PMC free article] [PubMed] [Google Scholar]
- 17. Ramos LF, Silva CM, Pansa CC and Moraes KCM (2020) Non‐alcoholic fatty liver disease: molecular and cellular interplays of the lipid metabolism in a steatotic liver. Expert Rev Gastroenterol Hepatol 1–16. [DOI] [PubMed] [Google Scholar]
- 18. Wu W, Wang S, Liu Q, Shan T, Wang X, Feng J and Wang Y (2020) AMPK facilitates intestinal long‐chain fatty acid uptake by manipulating CD36 expression and translocation. FASEB J 34, 4852–4869. [DOI] [PubMed] [Google Scholar]
- 19. Rodriguez Sawicki L, Bottasso Arias NM, Scaglia N, Falomir Lockhart LJ, Franchini GR, Storch J and Corsico B (2017) FABP1 knockdown in human enterocytes impairs proliferation and alters lipid metabolism. Biochim Biophys Acta Mol Cell Biol Lipids 1862, 1587–1594. [DOI] [PMC free article] [PubMed] [Google Scholar]
- 20. Thumser AE, Moore JB and Plant NJ (2014) Fatty acid binding proteins: tissue‐specific functions in health and disease. Curr Opin Clin Nutr Metab Care 17, 124–129. [DOI] [PubMed] [Google Scholar]
- 21. Hodson L and Gunn PJ (2019) The regulation of hepatic fatty acid synthesis and partitioning: the effect of nutritional state. Nat Rev Endocrinol 15, 689–700. [DOI] [PubMed] [Google Scholar]
- 22. Knottnerus SJG, Bleeker JC, Wust RCI, Ferdinandusse S, IJlst L, Wijburg FA, Wanders RJA, Visser G and Houtkooper RH (2018) Disorders of mitochondrial long‐chain fatty acid oxidation and the carnitine shuttle. Rev Endocr Metab Disord 19, 93–106. [DOI] [PMC free article] [PubMed] [Google Scholar]
- 23. Zou S, Lang T, Zhang B, Huang K, Gong L, Luo H, Xu W and He X (2018) Fatty acid oxidation alleviates the energy deficiency caused by the loss of MPC1 in MPC1(+/‐) mice. Biochem Biophys Res Commun 495, 1008–1013. [DOI] [PubMed] [Google Scholar]
- 24. Wang J, Zhang Y, Zhuo Q, Tseng Y, Wang J, Ma Y, Zhang J and Liu J (2020) TET1 promotes fatty acid oxidation and inhibits NAFLD progression by hydroxymethylation of PPARalpha promoter. Nutr Metab (Lond). 17, 46. [DOI] [PMC free article] [PubMed] [Google Scholar]
- 25. Tian Y, Yang B, Qiu W, Hao Y, Zhang Z, Yang B, Li N, Cheng S, Lin Z, Rui YC et al. (2019) ER‐residential Nogo‐B accelerates NAFLD‐associated HCC mediated by metabolic reprogramming of oxLDL lipophagy. Nat Commun 10, 3391. [DOI] [PMC free article] [PubMed] [Google Scholar]
- 26. Friedman SL, Neuschwander‐Tetri BA, Rinella M and Sanyal AJ (2018) Mechanisms of NAFLD development and therapeutic strategies. Nat Med 24, 908–922. [DOI] [PMC free article] [PubMed] [Google Scholar]
- 27. Younossi Z, Anstee QM, Marietti M, Hardy T, Henry L, Eslam M, George J and Bugianesi E (2018) Global burden of NAFLD and NASH: trends, predictions, risk factors and prevention. Nat Rev Gastroenterol Hepatol 15, 11–20. [DOI] [PubMed] [Google Scholar]
- 28. Karamfilova V, Gateva A, Assyov Y, Alexiev A, Savov A, Yaneva N, Ivanova I, Ivanova‐Boyanova R, Ivanova R, Vlahova Z et al. (2019) PNPLA3 I148M polymorphism in patients with nonalcoholic fatty liver disease, obesity and prediabetes. J Gastrointestin Liver Dis 28, 433–438. [DOI] [PubMed] [Google Scholar]
- 29. Ehrhardt N, Doche ME, Chen S, Mao HZ, Walsh MT, Bedoya C, Guindi M, Xiong W, Ignatius Irudayam J, Iqbal J et al. (2017) Hepatic Tm6sf2 overexpression affects cellular ApoB‐trafficking, plasma lipid levels, hepatic steatosis and atherosclerosis. Hum Mol Genet 26, 2719–2731. [DOI] [PMC free article] [PubMed] [Google Scholar]
- 30. Abul‐Husn NS, Cheng X, Li AH, Xin Y, Schurmann C, Stevis P, Liu Y, Kozlitina J, Stender S, Wood GC et al. (2018) A protein‐truncating HSD17B13 variant and Protection from Chronic Liver Disease. N Engl J Med 378, 1096–1106. [DOI] [PMC free article] [PubMed] [Google Scholar]
- 31. Ott C, Ross K, Straub S, Thiede B, Gotz M, Goosmann C, Krischke M, Mueller MJ, Krohne G, Rudel T and et al. (2012) Sam50 functions in mitochondrial intermembrane space bridging and biogenesis of respiratory complexes. Mol Cell Biol 32, 1173–1188. [DOI] [PMC free article] [PubMed] [Google Scholar]
- 32. Renne MF, Klug YA and Carvalho P (2020) Lipid droplet biogenesis: A mystery "unmixing"? Semin Cell Dev Biol. [DOI] [PubMed] [Google Scholar]
Associated Data
This section collects any data citations, data availability statements, or supplementary materials included in this article.
Supplementary Materials
Fig S1. SAMM50 knockdown caused lipid accumulation in human hepatoma cells under fatty acid treatment.
Fig S2. Decreased fatty acid oxidation in SAMM50‐knockdown cells.
Table S1. International serial number, gene name and location of SNPs (ABI), as well as the sequence of detection probe.
Table S2. The primer pairs used in the present study.
Table S3. Comparison of liver function markers among patients with different genotypes at loci rs738491 and rs2073082.
Table S4. SNP profiling results of 760 individuals.
Data Availability Statement
The data that support the findings of this study are available in the supplementary material of this article. Table S4 SNP profiling results of 760 individuals.