Abstract
Combined use of PET and dual-energy CT provides complementary information for multi-parametric imaging. PET-enabled dual-energy CT combines a low-energy X-ray CT image with a high-energy γ-ray CT (GCT) image reconstructed from time-of-flight PET emission data to enable dual-energy CT material decomposition on a PET/CT scanner. The maximum-likelihood attenuation and activity (MLAA) algorithm has been used for GCT reconstruction but suffers from noise. Kernel MLAA exploits an X-ray CT image prior through the kernel framework to guide GCT reconstruction and has demonstrated substantial improvements in noise suppression. However, similar to other kernel methods for image reconstruction, the existing kernel MLAA uses image intensity-based features to construct the kernel representation, which is not always robust and may lead to suboptimal reconstruction with artefacts. In this paper, we propose a modified kernel method by using an autoencoder convolutional neural network (CNN) to extract an intrinsic feature set from the X-ray CT image prior. A computer simulation study was conducted to compare the autoencoder CNN-derived feature representation with raw image patches for evaluation of kernel MLAA for GCT image reconstruction and dual-energy multi-material decomposition. The results show that the autoencoder kernel MLAA method can achieve a significant image quality improvement for GCT and material decomposition as compared to the existing kernel MLAA algorithm. A weakness of the proposed method is its potential over-smoothness in a bone region, indicating the importance of further optimization in future work.
This article is part of the theme issue ‘Synergistic tomographic image reconstruction: part 2’.
Keywords: dual-energy CT, PET/CT, image reconstruction, image prior, kernel methods, convolutional neural network
1. Introduction
Positron emission tomography (PET) integrated with computed tomography (CT) is a molecular imaging modality that is widely used in clinical oncology, neurology and cardiology. In parallel, dual-energy (DE) CT imaging has the unique capability of using energy-dependent tissue attenuation information to perform quantitative multi-material decomposition [1]. Combined use of PET/CT and DECT provides a multi-parametric characterization of disease states in cancer and other diseases [2]. Nevertheless, the integration of DECT with existing PET/CT would not be trivial, either requiring costly CT hardware upgrade or significantly increasing CT radiation dose.
We have proposed a new dual-energy CT imaging method that is enabled using a standard time-of-flight PET/CT scan without change of scanner hardware or adding additional radiation dose or scan time [3,4]. Instead of using two different X-ray energies as commonly used by conventional DECT, the PET-enabled dual-energy CT method combines a radiotracer annihilation-generated high-energy ‘γ-ray CT (GCT)’ at 511 keV with the already-available low-energy X-ray CT (usually ≤140 keV) to produce a pair of dual-energy CT images on PET/CT for multi-material decomposition.
The reconstruction of the GCT image from the PET emission scan can be achieved by the maximum-likelihood attenuation and activity (MLAA) method [5]. However, standard MLAA reconstruction is commonly noisy because the counting statistics of PET emission data are limited. While the noise would not compromise the performance of MLAA for PET attenuation correction, it may affect the quantitative accuracy of GCT for multi-material decomposition. To suppress noise, the kernel MLAA approach [4] has been developed by use of X-ray CT as image prior through a kernel framework and has demonstrated substantial improvements over standard MLAA.
In the kernel methods for image reconstruction (e.g. [6–10]), a set of features need to be defined for constructing the kernel representation of the image to be estimated. Existing kernel methods have mainly used image pixel intensities of a small patch (e.g. for MR-guided PET reconstruction [7–10]) or temporal sequence (e.g.for dynamic PET reconstruction [6,9]). However, the intensity-based features do not always provide satisfactory results. As shown in [4] and later in this paper, the reconstructed GCT image by such a method suffers from artefacts.
In this paper, we propose to use a convolutional neural network (CNN) feature set that is adaptively learned on the prior image to build the kernel representation for MLAA reconstruction. It has been demonstrated that deep learning with CNN has a strong ability to derive a latent feature representation in different tasks [11]. While it is often impractical to collect a large amount of training data for supervised learning, here we utilize the concept of autoencoder CNN [12], an unsupervised representation learning technique, for intrinsic feature extraction from the X-ray CT image prior for the kernel construction. The autoencoder CNN-derived feature set of X-ray CT image is expected to provide a more robust kernel representation for the GCT image reconstruction than the conventional intensity-based features.
2. PET-enabled dual-energy CT
(a) . Statistical model of PET emission data
In time-of-flight (TOF) PET, the measured data y can be well modelled as independent Poisson random variables using the log-likelihood function,
| 2.1 |
where i denotes the index of PET detector pair and Nd is the total number of detector pairs. m denotes the mth TOF bin and Nt is the number of TOF bins. The expectation of the PET projection data is related to the radiotracer activity image and object attenuation image at 511 keV via
| 2.2 |
where is the PET detection probability matrix. Np is the total number of image pixels. rm accounts for the expectation of random and scattered events. nm(μ) is the normalization factor with the ith element being
| 2.3 |
where ci,m represents the multiplicative factor excluding the attenuation correction factor and A is the system matrix for transmission imaging.
(b) . Maximum-likelihood attenuation and activity reconstruction
The MLAA ([5]) reconstruction jointly estimates the attenuation image μ and the activity image λ from the projection data y by maximizing the Poisson log-likelihood,
| 2.4 |
An iterative interleaved updating strategy is commonly used to seek the solution [5].
In each iteration of the algorithm, λ is first updated with fixed attenuation image ,
| 2.5 |
which can be solved by the maximum-likelihood expectation maximization (MLEM) algorithm [13]. μ is then updated with fixed λ using the maximum-likelihood transmission reconstruction (MLTR) method,
| 2.6 |
which can be solved by the separable paraboloidal surrogate (SPS) algorithm [14].
Previous use of MLAA was mainly for improving PET attenuation correction (e.g.[15,16]) or transmission-less PET imaging (e.g. [17–20]). In our PET-enabled dual-energy CT method [3,4], the MLAA is used differently. The estimated high-energy GCT image μ is combined with the low-energy X-ray CT image x to form dual-energy imaging for multi-material decomposition.
(c) . Kernel MLAA
The GCT estimate by standard MLAA is commonly noisy due to the limited counting statistics of PET emission data. To suppress noise, the kernel MLAA approach [4] incorporates the X-ray CT image as a priori information to guide the GCT reconstruction in the MLAA. It describes the intensity of the GCT μj in pixel j as a linear representation in a transformed feature space
| 2.7 |
where fj is the data point of pixel j that is extracted from x and ϕ( fj) is a mapping function that transforms the low-dimensional data point fj to a high-dimensional feature vector. w is a weight vector which also sits in the transformed space, with α being the coefficient. Then, we can obtain the following kernel representation for μj,
| 2.8 |
where κ( · , · ) is the kernel function (e.g. radial Gaussian) that is equal to the inner product of the two transformed feature vectors ϕ( fj) and ϕ( fl). The equivalent matrix-vector form for the GCT image is
| 2.9 |
where K is the kernel matrix and α denotes the corresponding kernel coefficient image.
Substituting equation (2.9) into the MLAA formulation in equation (2.4) gives the following kernel MLAA optimization formulation,
| 2.10 |
The detail of the kernel MLAA algorithm is provided in [4]. Once is obtained, the final estimate of the GCT image is obtained by
(d) . Material decomposition using PET-enabled dual-energy CT
For each image pixel j, the GCT attenuation value μj and X-ray CT attenuation value xj jointly form a pair of dual-energy measurements uj≜[xj, μj]T, which can be modelled by a set of material bases, such as air (A), soft tissue (S) or equivalently water, and bone (B):
| 2.11 |
subject to The coefficients ρj,k with k = A, S, B are the fraction of each basis material in pixel j. The material basis matrix U consists of the linear attenuation coefficients of each basis material measured at the low and high energies. Finally, ρj is estimated using the following least-square optimization for each image pixel,
| 2.12 |
3. Proposed autoencoder kernel method
(a) . Building kernels using convolutional neural network features
In the kernel MLAA [4] and other kernel methods for image reconstruction (e.g. [6–10]), the formation of the pixel-wise feature vector fj is a key factor to build the kernel matrix K and directly impacts the reconstruction result. Conventionally, the feature vector fj is defined by the intensity value of a pixel or its surrounding small patch (therefore denoted by ). However, such an approach may lead to suboptimal feature representation because of the simplification of feature attributes and the small size of the receptive field. Artefacts were observed in the reconstructed GCT images of the kernel MLAA [4]. While it is possible to design more complex features (e.g. texture) to make the features more robust and differential, it would require a significant amount of handcrafting.
To alleviate the issues, we propose to exploit deep learning with CNN [11] for intrinsic feature extraction from the X-ray CT image instead of using conventional intensity-based features in the kernel MLAA. The latent feature representation of a trained CNN model may benefit from the larger receptive field of deep convolutions to build a deeper and more robust feature set for kernel representation. A natural choice is by use of supervised deep learning which has shown strong potential for feature extraction in image recognition tasks. The optimization problem can accordingly be formulated as
| 3.1 |
where i denotes the index of training pairs with zi the input and oi the output. ϕ(θ; · ) is a neural-network model with θ the unknown weights. Once the neural-network model is pre-trained, we can apply it to the X-ray CT image prior x to extract intermediate CNN feature sets for each image pixel.
One major challenge with supervised deep learning is it commonly requires a large number of training datasets, which are not always available or the data acquisition is costly. Therefore, here we explore the feasibility of feature extraction using unsupervised deep learning for the kernel methods.
(b) . The autoencoder kernel
An autoencoder is an unsupervised technique for representation learning using neural networks [12] based on a signal reconstruction problem. The output of the neural network is trained to be an approximation of the input, as restricted by the network model itself. The corresponding optimization problem for applying an autoencoder for our kernel method is defined by,
| 3.2 |
where both the input z and output o in equation (3.1) are now set to the X-ray CT image x. The optimization essentially seeks an adaptive CNN representation of the image x, without requiring a large training database.
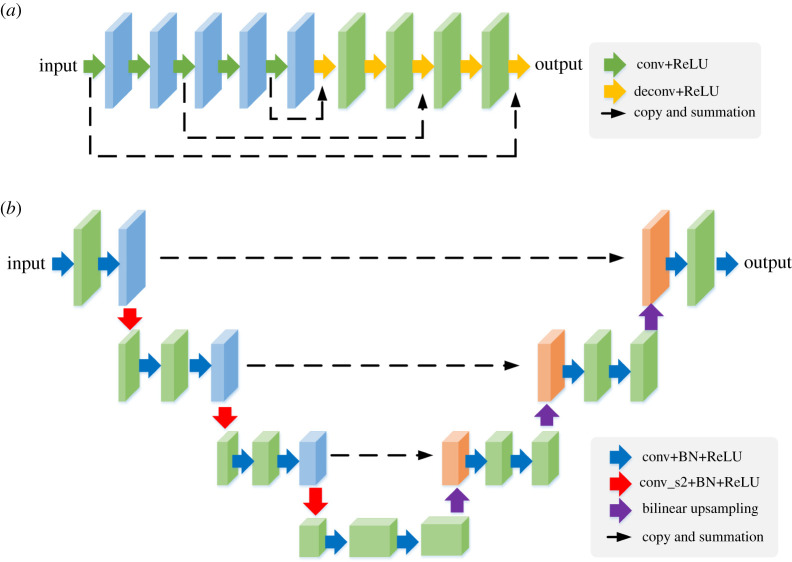
We specifically consider two types of CNN for ϕ, as shown in figure 1. One is the residual encoder–decoder convolutional neural network (RED-CNN) that has been used for low-dose CT denoising [21]. The other one is a Unet model that is widely used for image segmentation and reconstruction (e.g. [22]). In the RED-CNN, the encoders consist of a series of 5 × 5 convolutions followed by rectified linear unit (ReLU) activation step by step. A series of 5 × 5 deconvolution layers are used with residual mapping to recover the structural details. For the Unet, a modified structure [22] is used, which consists of a left-side encoder path and a right-side decoder path with residual connection from the left to the right. All convolutional filters have a size of 3 × 3. Stride 2 × 2 is used for downsampling and 2 × 2 bilinear interpolation is used for upsampling. This results in approximately 7 × 10⁵ parameters in the RED-CNN model and 3.4 × 10⁵ parameters in the Unet model, when compared with the input image of 32400 pixels in our study.
Figure 1.
CNN models used for feature extraction in an unsupervised form. (a) RED-CNN. (b) Unet. Each solid arrow denotes a layer and each three-dimensional block indicates the feature output of a layer. (Online version in colour.)
Once the model is trained using equation (3.2), the feature set of pixel j is obtained by,
| 3.3 |
where denotes the output of the ℓth layer of the CNN model, which corresponds to the ℓth three-dimensional block in figure 1. Note that ℓ can only be set to a layer that provides multi-channel feature maps of the same size as the input image. Thus, a general choice is the penultimate layer which commonly provides an intermediate output that has the same image size as the final output and also consists of a number of channels. Compared to the intensity-based features, the CNN-derived features form a different nonlinearly transformed space based on which the built kernel method may have a better performance, as illustrated later in the Results section.
For the kernel methods, the extracted CNN feature set is fed into the kernel calculation, for instance, using a radial Gaussian kernel,
| 3.4 |
where σ is a hyper-parameter which can be set to 1 if the feature set is normalized [6]. Note that the full consideration of all (j, l) pairs for kernel representation would result in a full matrix K, which is impractical for efficient implementation because of its large size. Similar to the previous kernel methods [6], K is built to be sparse using the k-nearest neighbours (kNN) strategy [23].
4. Computer simulation studies
(a) . Simulation set-up
We simulated a GE Discovery 690 PET/CT scanner in two dimensions. The TOF timing resolution of this PET scanner is about 550 ps. The simulation was conducted using one chest slice of the XCAT phantom. The true PET activity image and 511 keV attenuation image are shown in figure 2a,b, respectively. The images were first forward projected to generate a noise-free sinogram of 11 TOF bins. A 40% uniform background was included to simulate random and scattered events. Poisson noise was then generated using 5 million expected events. The X-ray CT image at a low-energy 80 keV was also simulated from XCAT and is shown in figure 2c.
Figure 2.
The digital phantom used in the PET/CT computer simulation. (a) PET activity image in Bq/cc; (b) PET attenuation image at 511 keV in cm−1; (c) X-ray CT image at 80 keV; (d) illustration of a liver ROI ‘L’ and a spine bone ROI ‘B’. (Online version in colour.)
(b) . Reconstruction methods for comparison
Four types of reconstruction were compared, including (1) standard MLAA [5], (2) existing kernel MLAA [4] with fj being the pixel intensities of X-ray CT image x in a 3 × 3 image patch centred at pixel j, (3) RED kernel MLAA: proposed autoencoder kernel method with fj extracted from RED-CNN, and (4) Unet kernel MLAA: proposed autoencoder kernel method with fj extracted using the Unet. Based on the findings in [4], we used the 511 keV attenuation map converted from the X-ray CT image as the initial estimate of μ in the MLAA reconstructions for accelerated convergence. All different kernel matrices were built using kNN [23] with k = 50 based on the Euclidean distance between fl and fj in the same way as used in [6]. All MLAA reconstructions were run for 3000 iterations for the purpose of studying the convergence of different MLAA algorithms. Within each outer iteration, one inner iteration was used for the λ-estimation step and one inner iteration was used for the μ-estimation step. These parameters were chosen for approximately optimal image quality.
(c) . Autoencoder convolutional neural network learning and feature visualization
We used the Adam optimization algorithm to train the RED-CNN and Unet of the X-ray CT image with 300 epochs on a workstation with a Nvidia GeForce RTX 2080 Ti GPU. The learning rates of RED-CNN and Unet were chosen to be 10−4 and 10−2, respectively, for approximately optimal performance. The training time was approximately 20 s for both RED-CNN and Unet in this two-dimensional simulation study.
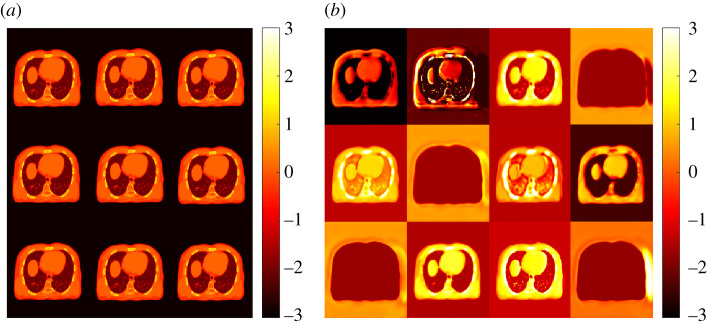
To demonstrate the differences between the autoencoder kernel and standard kernel, figure 3 visualizes the maps of the feature set used by the two types of kernels. Each subimage corresponds to one element of the feature vector fj or at all different pixels. The standard intensity-based kernel was formed from 3 × 3 neighbouring patches, which explains why the feature maps look similar. The Unet-derived CNN features were learned using an autoencoder as the output of the penultimate layer (12 channels) and extracted intrinsic, differential features from the X-ray CT image.
Figure 3.
Maps of the feature set used by (a) standard kernel and (b) proposed Unet kernel. (Online version in colour.)
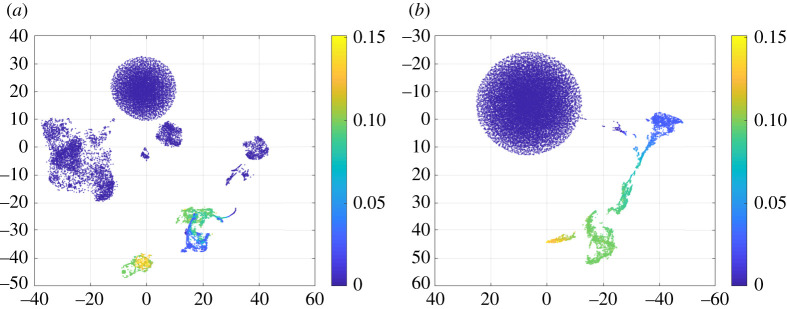
Figure 4 shows the two-dimensional manifold visualization of these high-dimensional (9 and 12, respectively) feature vectors using the t-distributed stochastic neighbour embedding (t-SNE) algorithm [24]. The t-SNE is a nonlinear dimension reduction technique that locates each high-dimensional data point in a low-dimensional embedding space with intrinsic structures preserved. Image pixels (equivalently points in the figure 4) are clustered but less organized in the embedding space of the intensity-based features. In comparison, pixels are more organized in the embedding space of the Unet-derived features and follow a continuous change of colour, which may be an indication of improvement for kernel MLAA.
Figure 4.
Low-dimensional manifold visualization of (a) standard intensity-based and (b) CNN-derived feature sets. Each axis represents a dimension of the manifold embedding. Each point corresponds to an image pixel and colour represents different GCT attenuation values. (Online version in colour.)
(d) . Evaluation metrics
Different MLAA methods were first compared for the image quality of GCT using the mean squared error (MSE) defined by
| 4.1 |
where represents the reconstructed GCT image by each MLAA method and denotes the ground truth. The ensemble bias and standard deviation (SD) of the mean intensity in regions of interest (ROIs) were also calculated to evaluate ROI quantification in a liver region and a bone region shown in figure 2d,
| 4.2 |
where is the noise-free intensity and denotes the mean of Nr realizations. Nr = 10 in this study. In addition to the evaluation of bias and SD for ROI quantification, pixel-based ensemble bias and SD in percentage were also calculated and reported in average for specific regions in the same way as used in [6].
Different MLAA algorithms were further compared for dual-energy CT multi-material decomposition. Similarly, image MSE, ROI-based bias and SD, as well as pixel-based bias and SD were calculated for each of the material basis fraction images. Because our focus is on dual-energy CT imaging, we did not intend to evaluate PET activity image reconstruction in this study.
(e) . Comparison results for GCT image quality
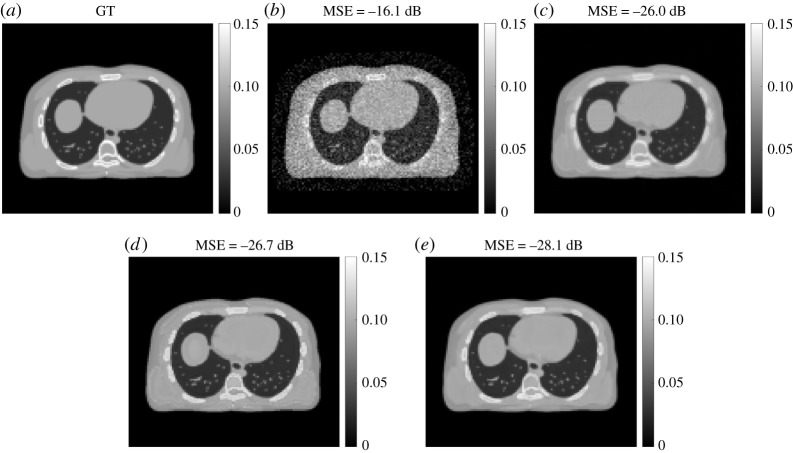
Figure 5 shows examples of the reconstructed GCT image μ by different MLAA algorithms with a specific iteration number 600. While the standard MLAA reconstruction was noisy, all the kernel MLAA reconstructions significantly improved the result according to both visual quality and image MSE. The RED kernel MLAA had a slightly better MSE than the standard kernel MLAA and both were with artefacts in the images. By contrast, the Unet kernel MLAA demonstrated least artefacts with good visual quality and achieved the lowest MSE among different algorithms.
Figure 5.
GCT images by different reconstruction algorithms. (a) Ground truth, (b) standard MLAA, (c) standard kernel MLAA, (d) RED-CNN kernel MLAA and (e) Unet kernel MLAA.
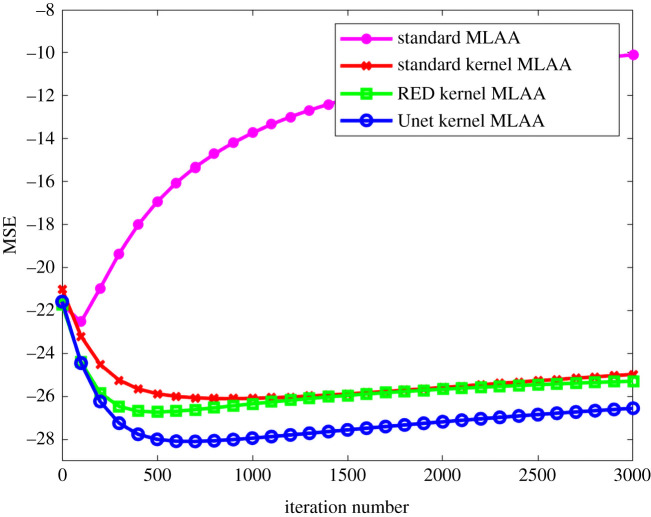
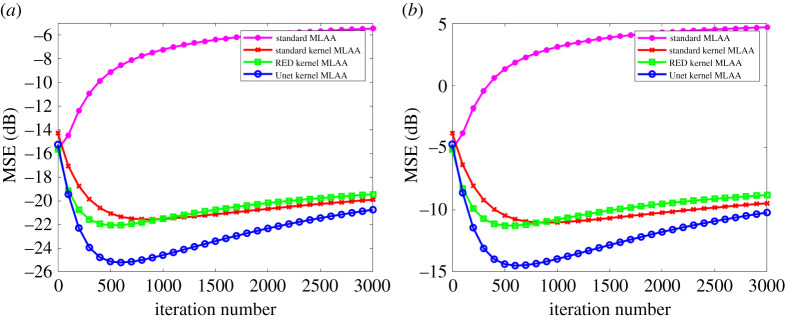
Figure 6 further shows image MSE as a function of iteration number for different algorithms. The iteration number varies from 0 to 3000 with a step of 100 iterations. Compared to the standard kernel MLAA, the RED kernel MLAA only had a slightly better image MSE at early iterations. The Unet kernel MLAA outperformed the standard kernel MLAA across all iterations.
Figure 6.
Plot of image MSE as a function of iteration number for different MLAA reconstruction algorithms. (Online version in colour.)
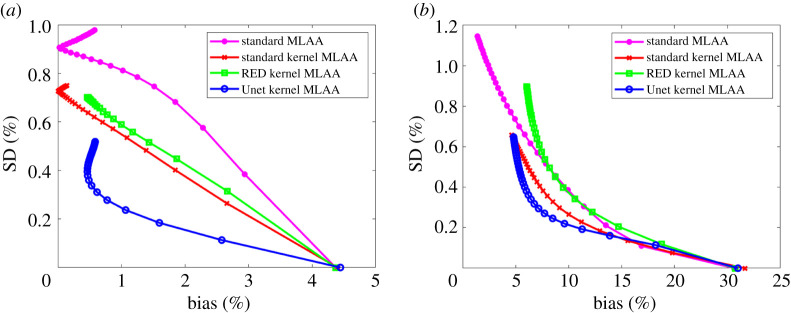
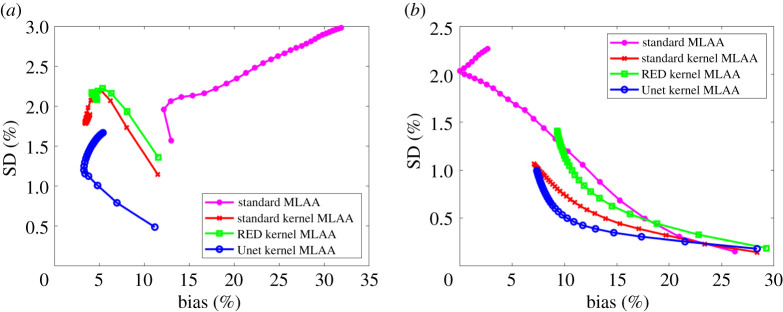
The comparison of ensemble bias versus SD for GCT ROI quantification is shown in figure 7 by varying the iteration number. As iteration number increases, the bias of ROI quantification is reduced while the SD is increased. All the kernel MLAA algorithms outperformed the standard MLAA. While the RED kernel MLAA did not outperform the standard kernel MLAA, the Unet kernel MLAA achieved the best performance among different algorithms for both liver and bone ROIs. At a fixed bias level, the Unet kernel MLAA has lower SD than the other two kernel-based approaches.
Figure 7.
Plot of bias versus standard deviation (SD) trade-off for GCT ROI quantification. (a) Results of the liver ROI quantification; (b) results of the bone ROI quantification. (Online version in colour.)
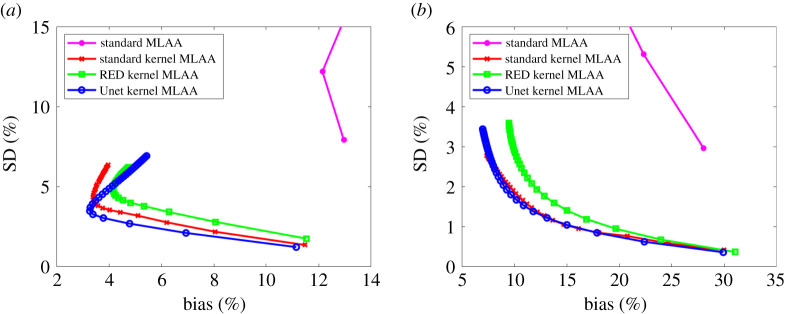
Figure 8 shows the comparison using pixel-based bias versus SD trade-off in the two regions (liver and bone). Again, all the kernel MLAA algorithms outperformed the standard MLAA. The SD level in the pixel-based evaluation is much higher than in the ROI-based evaluation (figure 7) because spatial correlation is taken into account in the latter. The Unet kernel MLAA achieved a better result than the standard kernel MLAA in the liver region for early iterations but became worse for late iterations. In the bone region, the Unet kernel demonstrated a slightly worse performance than the standard kernel but overall the two algorithms were comparable to each other for the pixel-based bias-SD evaluation in this region.
Figure 8.
Plot of pixel-based bias versus standard deviation (SD) trade-off for GCT image evaluation in a liver region (a) and a bone region (b). For the standard MLAA, only early iterations stay in the display window. (Online version in colour.)
(f) . Comparison results for material decomposition
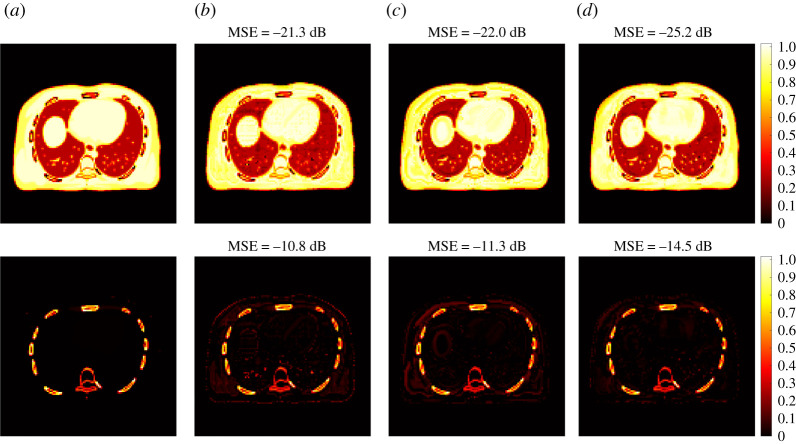
Figure 9 shows the fractional basis images of soft tissue and bone from multi-material decomposition of the PET-enabled dual-energy CT images. The results were obtained from the MLAA reconstructions with 600 iterations. The ground truth of the soft tissue and bone bases was generated using the noise-free data. Compared to the standard MLAA and RED kernel MLAA, the Unet kernel MLAA reconstruction led to better visual quality and decreased image MSE. Figure 10 shows image MSE as a function of iteration number for each basis fractional image. All the kernel MLAAs were superior to the standard MLAA, with the best MSE performance from the Unet kernel MLAA.
Figure 9.
True and estimated fractional images of two basis materials using different reconstruction algorithms: soft tissue (top row) and bone (bottom row). (a) Ground truth, (b) standard kernel MLAA, (c) proposed RED kernel MLAA, (d) proposed Unet kernel MLAA. (Online version in colour.)
Figure 10.
Plot of image MSE as a function of iteration number for each basis fractional image. (a) Soft tissue, (b) bone. (Online version in colour.)
To demonstrate the performance of different reconstruction algorithms for ROI quantification on basis fractional images, figure 11 shows the bias versus SD trade-off plot for ROI quantification on the soft tissue and bone fractional images. The Unet kernel MLAA outperformed other algorithms for ROI quantification in the liver and bone regions. For bone ROI quantification, all kernel MLAAs demonstrated a noticeable bias when compared with the standard kernel MLAA. The bias in the bone ROI quantification of the fractional basis image was supposed to be propagated from the GCT image reconstruction (as demonstrated in figure 7b).
Figure 11.
Bias versus standard deviation trade-off for ROI quantification on the fractional image of (a) soft tissue and (b) bone basis materials. (Online version in colour.)
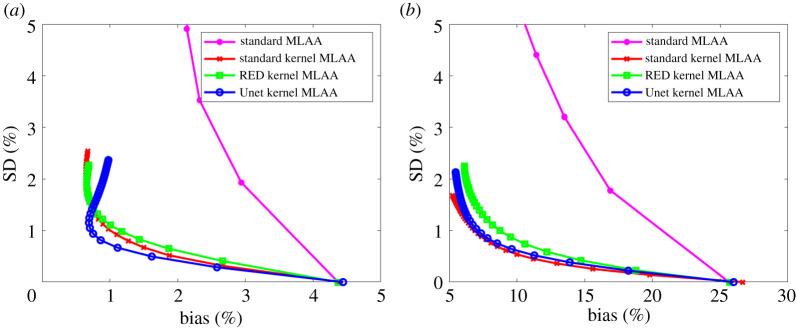
The result from pixel-based evaluations is shown in figure 12. Overall, the Unet kernel MLAA demonstrated a better or at least comparable performance as compared to the standard kernel MLAA and other algorithms.
Figure 12.
Pixel-based evaluation of ensemble bias versus standard deviation trade-off for the fractional image of (a) soft tissue and (b) bone basis materials. For the standard MLAA, only early iterations stay in the display window. (Online version in colour.)
5. Discussions
This paper combines autoencoder-based representation learning with kernel MLAA to improve PET-enabled dual-energy CT imaging. This work falls into the scope of applying deep learning to MLAA. Compared to direct application of CNN for MLAA (e.g. [25,26]), the proposed approach has the advantages of not requiring a large training dataset and being patient specific. The training is also computationally efficient as it is based on a single image.
The autoencoder-derived feature maps in figure 3b indicate a smoothing effect exists as compared to the intensity-based feature maps in figure 3a. The smoothing might be due to the downsampling and upsampling in the Unet. In our investigation, applying smoothing to the X-ray CT led to reduced GCT image quality (results not shown), which can be explained by the loss of spatial resolution. This suggests the smoothing effect in the feature maps may have compromised the performance of the proposed approach and possibly caused the bias in the bone region. This problem can be potentially overcome by using a modified Unet architecture (e.g. [27]) and/or by our other ongoing effort [28] that combines deep image prior [22,29] as an implicit regularization on α in the kernel MLAA method.
In addition, there are multiple options of layer location to extract the CNN features after the autoencoder learning. This paper does not intend to identify the optimal location but introduces and demonstrates the feasibility for kernel MLAA. It is possible to combine the feature extraction process and kernel optimization into an integrated deep learning framework to further improve the autoencoder kernel MLAA approach.
Based on the quantitative MSE and bias-SD curves shown in this paper, 600 iterations of reconstruction seem a reasonable choice for the kernel MLAA reconstructions. Here, the number of iterations is based on not using any ordered subsets. If 30 subsets were used, the needed number of iterations would be approximately 20, which is computationally feasible for clinical practice.
TOF PET data can determine the GCT image but the solution is non-unique due to a scaling constant in the sinogram domain [30]. The scaling problem was less severe in our application partly because the available X-ray CT provides a very good initial estimate and also the anatomical prior information from X-ray CT could further mitigate the problem in the kernel MLAA reconstructions. Dedicated approaches for the scaling problem are being developed in the field (e.g. [31]), which may be combined with the kernel MLAA method to improve GCT quantification.
Another limitation of this work is the simulation study used the XCAT phantom that was generated mono-energetically without artefacts. The resulting X-ray CT prior could be very strong and may be less realistic in practice. Our future work will test the method directly using physical phantom and patient data.
6. Conclusion
We have developed an autoencoder kernel MLAA reconstruction method for PET-enabled dual-energy CT. The autoencoder-derived feature set can provide an improved kernel representation to incorporate X-ray CT as the image prior for GCT image reconstruction from PET emission data. Computer simulation results have demonstrated the improvement of the autoencoder kernel MLAA over existing MLAA algorithms for GCT image quality and dual-energy CT material decomposition. The proposed method can suppress noise, reduce image artefacts, and improve ROI quantification. A weakness of the kernel methods is they may potentially over-smooth a bone region and induce a bias in bone ROI quantification. Our future work will further optimize the method and identify a solution to overcome the limitation.
Data accessibility
The code and data are available on GitHub. https://github.com/SiqiLi1020/Autoencoder-Kernel-MLAA
Authors' contributions
G.W. and S.L. conceived of and designed the study. S.L. carried out the experiments. S.L. and G.W. drafted and revised the manuscript. All authors read and approved the manuscript.
Competing interests
UC Davis has a revenue-sharing agreement with United Imaging Healthcare.
Funding
This work is supported by National Institutes of Health under grant no. R21 EB027346.
References
- 1.McCollough CH, Leng S, Yu L, Fletcher JG. 2015. Dual-and multi-energy CT: principles, technical approaches, and clinical applications. Radiology 276, 637-653. ( 10.1148/radiol.2015142631) [DOI] [PMC free article] [PubMed] [Google Scholar]
- 2.Wu H et al. 2020. Clinical utility of dual-energy CT used as an add-on to 18F FDG PET/CT in the preoperative staging of resectable NSCLC with suspected single osteolytic metastases. Lung Cancer 140, 80-86. ( 10.1016/j.lungcan.2019.10.032) [DOI] [PubMed] [Google Scholar]
- 3.Wang G. 2018. PET-enabled dual-energy CT: a proof-of-concept simulation study. In 2018 IEEE Nuclear Science Symp. and Medical Imaging Conf. Proc. (NSS/MIC), Nov.
- 4.Wang G. 2020. PET-enabled dual-energy CT: image reconstruction and a proof-of-concept computer simulation study. Phys. Med. Biol. 65, 245028. ( 10.1088/1361-6560/abc5ca) [DOI] [PMC free article] [PubMed] [Google Scholar]
- 5.Rezaei A et al. 2012. Simultaneous reconstruction of activity and attenuation in time-of-flight PET. IEEE Trans. Med. Imaging 31, 2224-2233. ( 10.1109/TMI.2012.2212719) [DOI] [PubMed] [Google Scholar]
- 6.Wang G, Qi J. 2015. PET image reconstruction using kernel method. IEEE Trans. Med. Imaging 34, 61-71. ( 10.1109/TMI.2014.2343916) [DOI] [PMC free article] [PubMed] [Google Scholar]
- 7.Hutchcroft W, Wang G, Chen K, Catana C, Qi J. 2016. Anatomically-aided PET reconstruction using the kernel method. Phys. Med. Biol. 61, 6668-6683. ( 10.1088/0031-9155/61/18/6668) [DOI] [PMC free article] [PubMed] [Google Scholar]
- 8.Novosad P, Reader AJ. 2016. MR-guided dynamic PET reconstruction with the kernel method and spectral temporal basis functions. Phys. Med. Biol. 61, 4624-4645. ( 10.1088/0031-9155/61/12/4624) [DOI] [PubMed] [Google Scholar]
- 9.Gong K, Cheng-Liao J, Wang GB, Chen KT, Catana C, Qi J. 2018. Direct Patlak reconstruction from dynamic PET data using kernel method with MRI information based on structural similarity. IEEE Trans. Med. Imaging 37, 955-965. ( 10.1109/TMI.2017.2776324) [DOI] [PMC free article] [PubMed] [Google Scholar]
- 10.Deidda D et al. 2019. Hybrid PET-MR list-mode kernelized expectation maximization reconstruction. Inverse Prob. 35, 044001. ( 10.1088/1361-6420/ab013f) [DOI] [Google Scholar]
- 11.LeCun Y, Bengio Y, Hinton G. 2015. Deep learning. Nature 521, 436-444. ( 10.1038/nature14539) [DOI] [PubMed] [Google Scholar]
- 12.Kramer MA. 1991. Nonlinear principal component analysis using autoassociative neural networks. AlChE J. 37, 233-243. ( 10.1002/aic.690370209) [DOI] [Google Scholar]
- 13.Shepp LS, Vardi Y. 1982. Maximum likelihood reconstruction for emission tomography. IEEE Trans. Med. Imaging 1, 113-122. ( 10.1109/TMI.1982.4307558) [DOI] [PubMed] [Google Scholar]
- 14.Erdogan H, Fessler JA. 1999. Monotonic algorithms for transmission tomography. IEEE Trans. Med. Imaging 18, 801-814. ( 10.1109/42.802758) [DOI] [PubMed] [Google Scholar]
- 15.Panin VY, Aykac M, Casey ME. 2013. Simultaneous reconstruction of emission activity and attenuation coefficient distribution from TOF data, acquired with external transmission source. Phys. Med. Biol. 58, 3649-3669. ( 10.1088/0031-9155/58/11/3649) [DOI] [PubMed] [Google Scholar]
- 16.Bousse A, Bertolli O, Atkinson D, Arridge S, Ourselin S, Hutton BF, Thielemans K. 2016. Maximum-likelihood joint image reconstruction/motion estimation in attenuation-corrected respiratory gated PET/CT using a single attenuation map. IEEE Trans. Med. Imaging 35, 217-228. ( 10.1109/TMI.2015.2464156) [DOI] [PubMed] [Google Scholar]
- 17.Mehranian A, Zaidi H. 2015. Joint estimation of activity and attenuation in whole-Body TOF PET/MRI using constrained Gaussian mixture models. IEEE Trans. Med. Imaging 34, 1808-1821. ( 10.1109/TMI.2015.2409157) [DOI] [PubMed] [Google Scholar]
- 18.Ahn S, Cheng L, Shanbhag DD, Qian H, Kaushik SS, Jansen FP, Wiesinger F. 2018. Joint estimation of activity and attenuation for PET using pragmatic MR-based prior: application to clinical TOF PET/MR whole-body data for FDG and non-FDG tracers. Phys. Med. Biol. 63, 045006. ( 10.1088/1361-6560/aaa8a6) [DOI] [PubMed] [Google Scholar]
- 19.Defrise M, Rezaei A, Nuyts J. 2014. Transmission-less attenuation correction in time-of-flight PET: analysis of a discrete iterative algorithm. Phys. Med. Biol. 59, 1073-1095. ( 10.1088/0031-9155/59/4/1073) [DOI] [PubMed] [Google Scholar]
- 20.Berker Y, Li YS. 2016. Attenuation correction in emission tomography using the emission data a review. Med. Phys. 43, 807-832. ( 10.1118/1.4938264) [DOI] [PMC free article] [PubMed] [Google Scholar]
- 21.Chen H et al. 2017. Low-Dose CT with a residual encoder-decoder convolutional neural network. IEEE Trans. Med. Imaging 36, 2524-2535. ( 10.1109/TMI.2017.2715284) [DOI] [PMC free article] [PubMed] [Google Scholar]
- 22.Gong K, Catana C, Qi J, Li Q. 2019. PET image reconstruction using deep image prior. IEEE Trans. Med. Imaging 38, 1655-1665. ( 10.1109/TMI.2018.2888491) [DOI] [PMC free article] [PubMed] [Google Scholar]
- 23.Friedman JH, Bentely J, Finkel RA. 1977. An algorithm for finding best matches in logarithmic expected time. ACM Trans. Math. Softw. 3, 209-226. ( 10.1145/355744.355745) [DOI] [Google Scholar]
- 24.van der Maaten L, Hinton G. 2008. Visualizing data using t-SNE. J. Mach. Learn. Res. 9, 2579-2605. [Google Scholar]
- 25.Hwang D, Kim KY, Kang SK, Seo S, Paeng JC, Lee DS, Lee JS. 2018. Improving the accuracy of simultaneously reconstructed activity and attenuation maps using deep learning. J. Nucl. Med. 59, 1624-1629. ( 10.2967/jnumed.117.202317) [DOI] [PubMed] [Google Scholar]
- 26.Hwang D, Kang SK, Kim KY, Seo S, Paeng JC, Lee DS, Lee JS. 2019. Generation of PET attenuation map for whole-body time-of-flight 18F-FDG PET/MRI using a deep neural network trained with simultaneously reconstructed activity and attenuation maps. J. Nucl. Med. 60, 1183-1189. ( 10.2967/jnumed.118.219493) [DOI] [PMC free article] [PubMed] [Google Scholar]
- 27.Ye JC, Han Y, Cha E. 2018. Deep convolutional framelets: a general deep learning framework for inverse problems. SIAM J. Imaging Sci. 11, 991-1048. ( 10.1137/17M1141771) [DOI] [Google Scholar]
- 28.Li S, Wang G. 2021. Neural MLAA for PET-enabled Dual-Energy CT Imaging. Proc. of SPIE Medical Imaging 2021: Physics of Medical Imaging, 115951G. 10.1117/12.2582317. [DOI]
- 29.Ulyanov D, Vedaldi A, Lempitsky V. 2020. Deep image prior. Int. J. Comput. Vision 128, 1867-1888. ( 10.1007/s11263-020-01303-4) [DOI] [Google Scholar]
- 30.Defrise M, Rezaei A, Nuyts J. 2012. Time-of-flight PET data determine the attenuation sinogram up to a constant. Phys. Med. Biol. 57, 885-899. ( 10.1088/0031-9155/57/4/885) [DOI] [PubMed] [Google Scholar]
- 31.Li Y, Matej S, Karp JS. 2020. Practical joint reconstruction of activity and attenuation with autonomous scaling for time-of-flight PET. Phys. Med. Biol. 65, 235037. ( 10.1088/1361-6560/ab8d75) [DOI] [PMC free article] [PubMed] [Google Scholar]
Associated Data
This section collects any data citations, data availability statements, or supplementary materials included in this article.
Data Availability Statement
The code and data are available on GitHub. https://github.com/SiqiLi1020/Autoencoder-Kernel-MLAA


