Abstract
CARD-containing MAGUK protein 3 (CARMA3) is associated with tumor occurrence and progression. However, the signaling pathways involved in CARMA3 function remain unclear. We aimed to analyze the association between CARMA3 and stathmin (STMN1) through the NF-κB pathway, which is associated with cell proliferation and invasion, in clear cell renal cell carcinoma (ccRCC). We evaluated the effects of CARMA3 and STMN1 expression on cell migration, proliferation, and invasion in various cell lines, and their expression in tissue samples from patients with ccRCC. CARMA3 was highly expressed in ccRCC tissues and cell lines. Moreover, CARMA3 promoted the proliferation and invasion of RCC cells by activating the NF-κB pathway to transcribe STMN1. Stathmin exhibited a consistent profile with CARMA3 in ccRCC tissue, and could be an effector for CARMA3-activated cell proliferation and invasion of ccRCC cells. In summary, CARMA3 may serve as a promising target for ccRCC treatment.
Keywords: renal cell carcinoma, CARMA3, STMN1
Introduction
Clear cell renal cell carcinoma (ccRCC) is a common lethal malignant tumor. 1 The development of ccRCC is often concealed, which leads to surgery delays or inadequacy. Treatment for advanced ccRCC remains a challenge because of resistance to chemotherapy or radiation. Drugs acting on protein receptor tyrosine kinases (RTKs), such as sunitinib, have played an important role in the treatment of ccRCC, but these tumors often resist treatment and continue to progress. 2 Although immune therapy has recently been applied as a second-line regimen, the efficacy rate is variable because the machinery of immune cells reactivates. Therefore, more effective therapy options and novel targets are urgently needed for ccRCC treatment.
CARD-containing MAGUK protein 3 (CARMA3), also called CARD10, is a member of the CARD protein family. In response to most RTKs, CARMA3 activates the nuclear factor kappa B (NF-κB) pathway, generates both p65 and p50, and finally engages in the transcription process. CARMA3 also collaborates with the PKC family by participating in the phosphorylation process, and thus activating the NF-κB, mTOR, MAPK, and Wnt pathways in different situations. 3,4 CARMA3 is overexpressed in a variety of solid tumors, such as lung and breast cancers, and is associated with poor prognosis. The multiplicity of cellular functions of CARMA3, such as promoting tumor growth or metastasis, makes it a key player in tumor biology. 5,6 These reports suggest that CARMA3 may be a highly potent target for cancer treatment.
Malignant tumors are known to display extreme heterogeneity, and the phenotypes of tumor cell switches are accompanied by tumor progression. Acting as an intermediator in signal transduction, CARMA3 transmits different signals to alter the status of cells or the microenvironment that is beneficial for tumor cell survival. Although the phenotypes caused by CARMA3 are largely established, the molecular mechanism driven by CARMA3 in different tumor-associated events is still ambiguous. 5,6 Stathmin (STMN1) is associated with cell proliferation and invasion in various types of malignancies and functions as a phosphoprotein that regulates tubulin polymerization and microtubule destabilization, and can be regarded as an effector for cell cycle and cell motility. 7,8 Using data mining, a positive correlation has been found between CARMA3 and stathmin in the ccRCC datasets. In this study, we investigated whether CARMA3 might affect the proliferation and invasion of ccRCC cells via STMN1 regulation, as well as the pathway involved in this regulation.
Materials and Methods
Cell Culture Reagents
The Caki-1, OS-RC-2, 769-P, and 786-O human ccRCC cell lines, HK-2 human renal tubular epithelial cell line, and HEK-293 T cell line were purchased from the Chinese Academy of Sciences Cell Bank. Cell lines were cultured in suitable media including RPMI-1640 (Hyclone, USA), minimal essential medium (MEM, Hyclone), McCoy’s 5A (Hyclone), Dulbecco’s modified Eagle medium (DMEM/F12, Hyclone), and high glucose DMEM (Hyclone) supplemented with 10% fetal bovine serum (Hyclone) at 37°C in an atmosphere of 5% CO2. The reagents used to treat the cell lines included 5 μg/mL puromycin (Sigma-Aldrich, USA) and 20 µM pyrrolidinedithiocarbamic acid (PDTC, Beyotime, China). The cells were used 24 h after PDTC treatment.
Tissue Samples
Tissue samples were surgically obtained from 45 patients with ccRCC treated in our department. The patients’ information is shown in Table 1. All patients provided signed informed consent forms, and the collection and use of tissue samples were approved by the Institutional Ethics Committee of the First Affiliated Hospital of China Medical University. The collected tissue samples were frozen at −80 °C.
Table 1.
Patient Features of 45 ccRCC Patients.
| Characteristics | Case |
|---|---|
| All cases | 45 (100%) |
| Age (years) | |
| <60 | 19 (42.2%) |
| ≥60 | 26 (57.8%) |
| Gender | |
| Male | 32 (71.1%) |
| Female | 13 (28.9%) |
| TNM stage | |
| pTa-pT1 | 34 (75.6%) |
| pT2-pT4 | 11 (24.4%) |
| Histological type | |
| Clear cell carcinoma | 45 (100%) |
Real-Time Reverse-Transcription Quantitative PCR (RT-qPCR)
RT-qPCR was conducted as previously described. 9 Total RNA was extracted from tissues or cells using TRIzol reagent (Takara, China) following the manufacturer’s instructions. The mRNA expression levels were tested using the PrimeScript RT Reagent Kit and SYBR Premix Ex Taq (Takara) according to the manufacturer’s instructions. The primer sequences used are listed in Table 2.
Table 2.
Sequences of Primers and siRNAs.
| Primers | ||
|---|---|---|
| CARMA3 | Forward | CCCCTAAGAGATCCTTCAGCAG |
| Reverse | CCACACGCTGTCAGAGGATG | |
| STMN1 | Forward | GTTCCAGAATTCCCCCTTTC |
| Reverse | TCTCGTGCTCTCGTTTCTCA | |
| GAPDH | Forward | GGAGCGAGATCCCTCCAAAAT |
| Reverse | GGCTGTTGTCATACTTCTCATGG |
Transfection
Cells were transfected using Lipofectamine 3000 (Life Technologies, USA) with designed small interfering RNAs (siRNAs, JTSBIO Co., China) and were incubated for analysis 48 h later. Briefly, OS-RC-2 and 786-O cells were transfected with an shRNA plasmid (OBIO, China), according to the siCARMA3 sequence. After 24 h, the transfected cells were treated with puromycin (5 µg/mL). STMN1-restored models were constructed by overexpressing STMN1 (OBIO, China) to establish the knockdown of CARMA3 cell lines. Transiently transfected cells were used 48 h after transfection.
Western Blot Analysis
Western blot analysis was performed as previously described. 10 Total protein was extracted using RIPA Lysis Buffer (Beyotime) containing phenylmethylsulfonyl fluoride (Beyotime) and a phosphatase inhibitor cocktail (Beyotime). Proteins were separated by sodium dodecyl sulfate polyacrylamide gel electrophoresis, transferred onto polyvinylidene fluoride membranes (Merck Millipore, USA), and blocked with 5% skim milk powder. The primary antibodies used were polyclonal anti-CARMA3 (ab137383, 1:1000 dilution, Abcam, USA), polyclonal anti-STMN1 (#13655, 1:1000 dilution, Cell Signaling Technology), polyclonal anti-p-IκBa (Ser32/36) (#9246, 1:1000 dilution, Cell Signaling Technology), and polyclonal anti-GAPDH (#5174, 1:1000 dilution, Cell Signaling Technology). After incubation with primary and secondary antibodies, blots were imaged using an enhanced chemiluminescence kit (Merck Millipore) and a Microchemi 4.2 Imaging System (DNR, USA).
Cell Proliferation Assay
The Cell-Light 5-ethynyl-2-deoxyuridine (EdU) DNA Cell Proliferation Kit (Beyotime) was used to detect cell proliferation. Transiently transfected cells were incubated in fresh medium containing 50 µM EdU in the original environment for 2 h, 48 h after transfection. The cells were then fixed with 4% paraformaldehyde for 15 min and permeabilized with 0.3% Triton X-100 for 10 min. Subsequently, the cells were cultured with click addition solution and Hoechst 33342 for 30 min and 10 min, respectively. Images were captured using a fluorescence microscope (Olympus, Tokyo, Japan).
Cell Counting Kit-8 (CCK-8) Assay
Treated cells were seeded in 96-well plates, and cell counting Kit-8 (CCK-8) assay reagent (Dojindo Molecular Technologies, China) was co-cultured with the culture medium for 30 min before measurement. The absorbance at 450 nm was measured using an absorbance reader (Bio-Rad, USA). The proliferation curve was standard using a mock contract and recorded 5 days after seeding.
Transwell Assay
For the assay, 24-well transwell permeable chambers (Corning, USA) were used. For migration assays, 600 µL of medium was added to the lower chambers, and 48 h after transfection, transiently transfected cells at a density of 3 × 10⁴ cells/mL were suspended in 200 µL of serum-free medium and added to the upper chambers. After 24 h, the cells in the chambers were stained with 0.5% crystal violet and photographed. Additionally, for invasion assays, 25 µL of Matrigel (1 mg/mL) (BD Biosciences, USA) and 25 µL of serum-free medium were embedded into the upper chambers and dried at 37°C before use.
Luciferase Report Assay
HEK-293 T cells (3 × 10⁴ cells/mL) were transfected with NF-κB1 plasmids and wild-type or mutated STMN1 promoter plasmids in 24-well plates. After 48 h of incubation, we used a dual-luciferase reporter assay system (Promega, USA), according to the manufacturer’s protocol, and luciferase activity was analyzed using a Spectra Max i3x multifunctional microplate detection system (Molecular Devices, USA).
Statistical Analysis
The experimental data were analyzed as described previously. 11 All experiments were performed independently with at least 3 biological replicates. Data are presented as mean ± standard deviation (SD) and were analyzed using GraphPad Prism7. Differences between the 2 groups and differences between paired tissues were analyzed using Student’s t-test and Wilcoxon test, respectively. Pearson’s correlation coefficient was calculated using the expression data. P < 0.05 was considered statistically significant.
Results
The Expression of CARMA3 Was Elevated in ccRCC Tissues and Cells
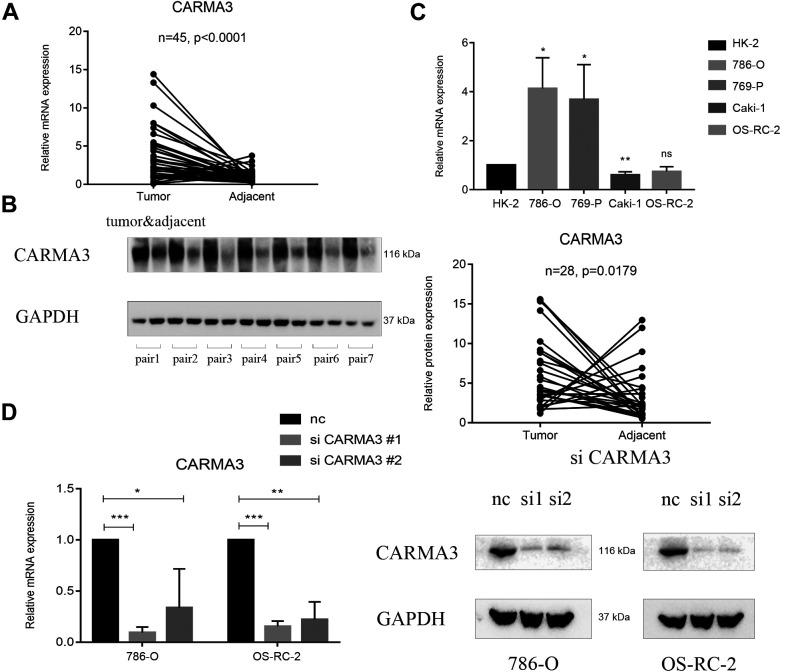
The 45 pairs of samples were randomly selected from our specimen database, and the level of CARMA3 expression was determined to be higher in the tumor tissues than in the paired adjacent tissues (Figure 1A). Further analysis of the CARMA3 protein levels revealed a positive trend in relation to CARMA3 mRNA expression (Figure 1B). Thus, we concluded that CARMA3 was highly expressed in ccRCC tissues, which might be a phenomenon caused by tumor development. In different ccRCC cell types, compared with that in HK-2 normal cells, CARMA3 expression was significantly higher in the 769-P and 786-O ccRCC cell lines but showed no apparent change in the Caki-1 and OS-RC-2 cells (Figure 1C). We found that only a portion of ccRCC cell lines highly expressed CARMA3, which suggested that the effect of CARMA3 might be limited in different ccRCC cells. To investigate whether the function of CARMA3 was different based on the expression level, we further selected the 786-O and OS-RC-2 cell lines as 2 different expression models to confirm the function of CARMA3 in ccRCC cells.
Figure 1.
Expression of CARMA3 in clear cell renal cell carcinoma (ccRCC) samples and cells. A, Reverse-transcription polymerase chain reaction (RT-PCR) analysis of the CARMA3 expression level in 45 ccRCC samples paired with normal tissues. B, Western blot analysis of the CARMA3 expression level in 45 ccRCC samples paired with normal tissues, shown in partial examples and statistical plots. C, RT-PCR analysis of the CARMA3 expression level in ccRCC cell lines and normal renal tubular epithelial cells. D, RT-PCR and western blot analyses of the CARMA3 expression level in CARMA3-shRNA-knockdown ccRCC cells. *P < 0.05, **P < 0.01 and ***P < 0.001.
Manipulating the Expression of CARMA3 Controlled the Growth and Invasion of ccRCC Cells
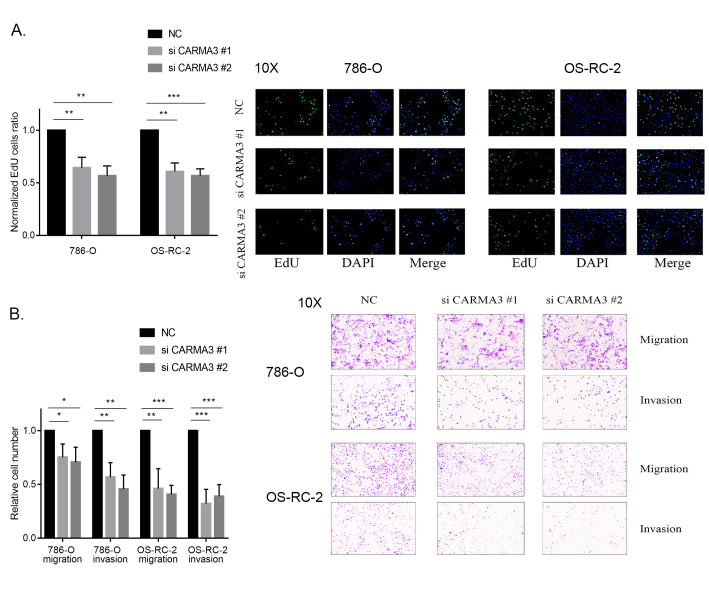
To change the expression of CARMA3, we knocked down CARMA3 using 2 different siRNAs. PCR and western blot analysis showed a significant decrease in the expression of CARMA3, confirming its knockdown (Figure 1D). The results from our EdU assays showed that cell proliferation in both the 786-O and OS-RC-2 siRNA groups was significantly lower than that in the negative control group due to slower DNA synthesis rates (Figure 2A). In addition, CCK-8 assays showed that a decrease in CARMA3 expression inhibited cell proliferation (Supplementary Figure S1A and S1B). For migration and invasion of ccRCC cells, transwell assay results indicated that the number of migrated cells with or without Matrigel was significantly decreased in the 786-O and OS-RC-2 siRNA groups (Figure 2B). These results showed that cell motility was disturbed by the inhibition of CARMA3 expression. In general, we inferred that CARMA3 promoted proliferation, migration, and invasion of ccRCC cells.
Figure 2.
CARMA3 promoted the growth and invasion of clear cell renal cell carcinoma (ccRCC) cells. A, Proliferation ability of CARMA3-knockdown cells measured using 5-ethynyl-2′-deoxyuridine (EdU) assays, normalized to the negative control group. B, Migration and invasion ability of CARMA3-knockdown cells measured using transwell assays, normalized to the negative control group. *P < 0.05, **P < 0.01 and ***P < 0.001.
CARMA3 Regulated the Expression of STMN1 Via the NF-κB Pathway
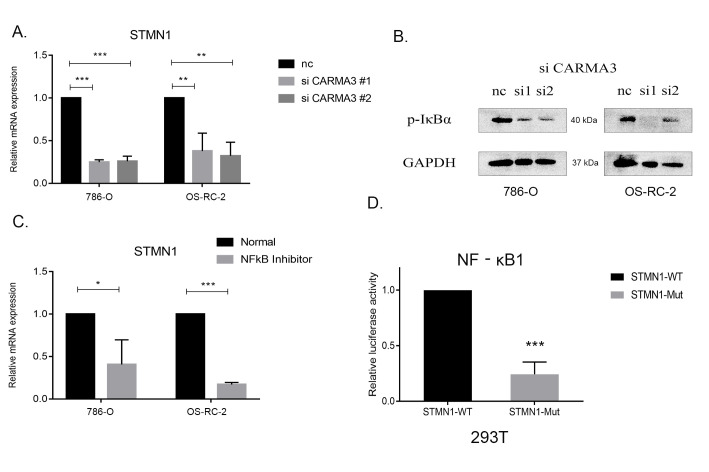
STMN1 is a protein that is known to destroy the structural stability of microtubules and affect cell mitosis and movement. We previously found in our transcriptome data that STMN1 levels were decreased due to CARMA3-knockdown. 11 In ccRCC cells, when CARMA3 was knocked down, the expression of STMN1 was shown to decrease at both the RNA and protein levels, which could indicate a correlation between the 2 proteins (Figure 3A). As CARMA3 is known to activate the NF-κB pathway (3), the level of p-IκBα, an activator of NF-κB, was decreased when CARMA3 was knocked down (Figure 3B). These results preliminarily demonstrated the inhibitory effect of CARMA3 knockdown on NF-κB. Using PDTC, an NF-κB inhibitor to block the activity of NF-κB, also caused a significant decrease in the expression of STMN1 (Figure 3C). Therefore, a probable correlation was established between CARMA3, NF-κB pathway, and STMN1.
Figure 3.
CARMA3 regulated the expression of STMN1 via the NF-κB pathway. A, Reverse-transcription polymerase chain reaction (RT-PCR) analysis of the STMN1 expression level in CARMA3-shRNA-knockdown clear cell renal cell carcinoma (ccRCC) cells. B, Western blot analysis of the IκBα phosphorylation level in CARMA3-shRNA-knockdown ccRCC cells. C, RT-PCR analysis of the STMN1 expression level after application of the pyrrolidinedithiocarbamic acid NF-κB inhibitor. D, Luciferase assays of the NF-κB1 transcription activity between the wild-type and mutated STMN1 promotors. *P < 0.05, **P < 0.01 and ***P < 0.001.
To further explore whether a transcriptional relationship exists between the NF-κB pathway and STMN1, we predicted potential binding sites between STMN1 and NF-κB transcription factors using the JASPAR database (http://jaspar.genereg.net/). NF-κB1 was predicted to bind to both strands of the promoter region of STMN1, upstream from 1,510 to 1,520 bp. We constructed a luciferase reporter system by mutating this potential passage and then transferring it into 293 T cells to test whether it could be transcribed by NF-κB1. Compared with the wild-type group, luciferase activity was significantly decreased in the mutated STMN1 promoter group (Figure 3D). Therefore, we hypothesized that CARMA3 might regulate STMN1 via NF-κB1.
High Expression of STMN1 Was Associated With CARMA3 and Promoted the Proliferation and Invasion of ccRCC Tissues and Cells
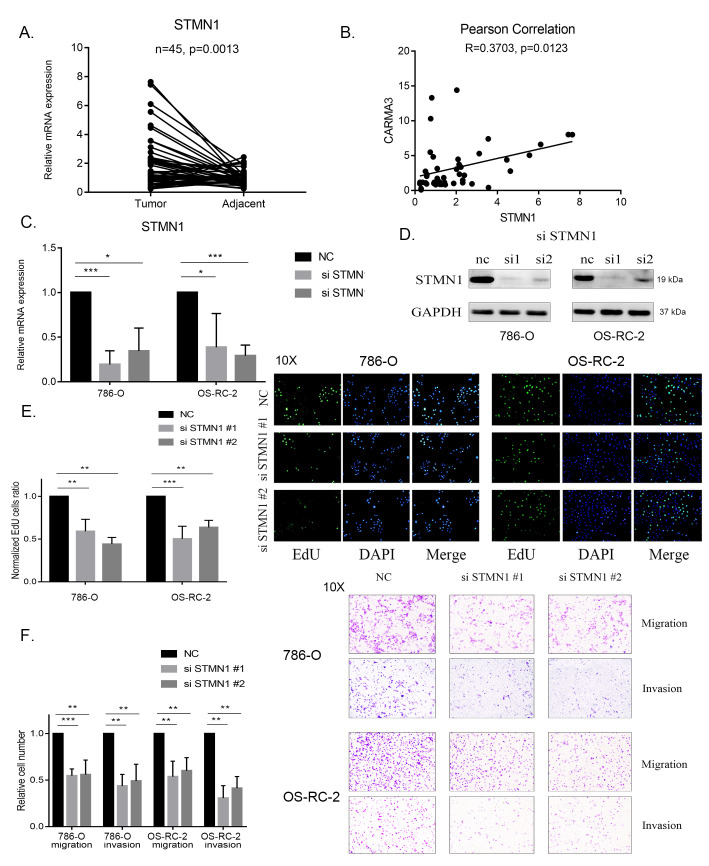
We further confirmed the function of STMN1 in ccRCC and showed that STMN1 expression was also higher in the previously used 45 ccRCC tissues than that in the normal tissues (Figure 4A). The Pearson correlation coefficient between the expression of CARMA3 and STMN1 in the collected tissue was 0.3702, indicating a positive correlation (Figure 4B). We also evaluated the function of STMN1 in ccRCC cells. We used 2 siRNAs to knock down STMN1 and confirmed the knockdown by PCR and western blot analysis (Figure 4C and D). EdU assay results showed that cell proliferation in both the 786-O and OS-RC-2 siRNA groups was significantly lower than that in the negative control group, which showed a suppression of cell growth (Figure 4E). CCK-8 assays showed that a decrease in STMN1 expression inhibited cell proliferation (Supplementary Figure S1A and S1B). Likewise, transwell assay results indicated that the number of migrating and invading cells was significantly decreased in both the 786-O and OS-RC-2 siRNA groups (Figure 4F). Based on these results, we hypothesized that CARMA3 might realize its function in proliferation and invasion by regulating STMN1.
Figure 4.
Highly expressed STMN1 promoted the growth and invasion of clear cell renal cell carcinoma (ccRCC) cells. A, Reverse-transcription polymerase chain reaction (RT-PCR) analysis of the STMN1 expression level in 45 ccRCC samples paired with normal tissues. B, The Pearson correlation coefficient calculated between the expression levels of CARMA3 and STMN1 in ccRCC samples. C, RT-PCR analysis of the STMN1 expression level in STMN1-shRNA-knockdown ccRCC cells. D, Western blot analysis of the STMN1 expression level in STMN1-shRNA-knockdown ccRCC cells. E, Proliferation ability of STMN1-knockdown cells measured using 5-ethynyl-2′-deoxyuridine (EdU) assays, normalized to the negative control group. F, Migration and invasion ability of STMN1-knockdown cells measured using transwell assays, normalized to the negative control group. *P < 0.05, **P < 0.01 and ***P < 0.001.
STMN1 Restored the Proliferation and Invasion Effects of CARMA3 in ccRCC Cells
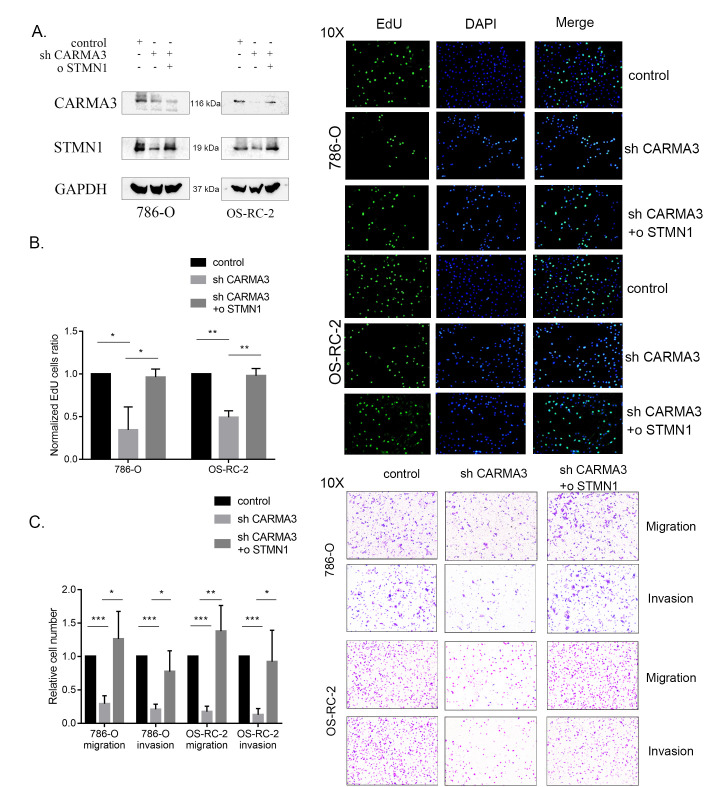
To verify the consistency in cellular function between CARMA3 and STMN1, we established stable STMN1-overexpressing cell lines by knocking down CARMA3 (Figure 5A) and performed EdU and transwell assays. In the overexpression group, the ratio of cells in the EdU assay (Figure 5B) and the number of migrating cells in the transwell assay (Figure 5C) were increased. CCK-8 assays also showed a recovery trend in cell proliferation (Supplementary Figure S1C and S1D). Therefore, we concluded that STMN1 could restore the proliferation, migration, and invasion activities of ccRCC cells affected by CARMA3 knockdown. Therefore, we confirmed STMN1 as an effector of CARMA3-induced ccRCC cell growth and movement.
Figure 5.
STMN1 restored the proliferation and invasion effects caused by the knockdown of CARMA3 in clear cell renal cell carcinoma (ccRCC) cells. A, Western blot analysis of the expression levels of CARMA3 and STMN1 in stable CARMA3-shRNA-knockdown and STMN1-overexpressing ccRCC cells. B, Proliferation ability of stable CARMA3-shRNA-knockdown and STMN1-overexpressing cells measured using 5-ethynyl-2′-deoxyuridine (EdU) assays, normalized to the control group. C, Migration and invasion ability of stable CARMA3-shRNA-knockdown and STMN1-overexpressing cells measured using transwell assays, normalized to the control group. *P < 0.05, **P < 0.01 and ***P < 0.001.
Discussion
Previous studies have demonstrated that CARMA3 is highly expressed in ccRCC and affects prognosis. 12,13 Our present study identified high CARMA3 expression in a cohort of patients with ccRCC. We found that CARMA3 promoted the proliferation, migration, and invasion of ccRCC cells. We identified that these effects were achieved by regulation of the expression of STMN1 through the NF-κB pathway. The CARMA3 protein is known to respond to upstream receptor proteins and transmit intracellular signals to downstream targets, such as NF-κB. In addition, forced overexpression of CARMA3 in transfected cells has been shown to activate downstream targets. 6 In particular, CARMA3 has been demonstrated to affect cell proliferation and stemness, angiogenesis and metastasis, DNA damage repair, and drug resistance in response to different cell signaling pathways in various malignant tumors. 5,14 -17
Generally, in tumor research, NF-κB is considered to be a pro-cancer and pro-inflammatory factor, which is widely involved in the process of tumor initiation, proliferation, metastasis, and angiogenesis. In addition, many chemotherapeutic drugs and radiation can activate the NF-κB pathway, leading to a resistance response during tumor treatment. 18 Therefore, inhibition of the NF-κB pathway is considered a feasible treatment strategy. At present, approximately 750 inhibitors suppress the NF-κB pathway in the process of inhibiting tumor proliferation or increasing the sensitivity of tumor cells to chemotherapy drugs. However, because NF-κB pathway is not fully understood, these inhibitors have uncertain effects and serious adverse reactions, and no NF-κB pathway inhibitors have entered phase III clinical trials. 19,20 Thus, we considered that CARMA3, upstream of the NF-κB complex, could be a potential target for therapy. We also investigated stathmin, as an indicator of activated CARMA3.
The main function of the stathmin protein is the destabilization of microtubules in the microtubule filament system, 21 through the prevention of microtubule assembly and promotion of its disassembly. 22 In addition, STMN1 has been reported to be highly expressed in various malignant tumors, as the alteration of microtubules has been associated with cell proliferation, mitosis, and motility. 23 -27 In addition, STMN1 is involved in the initiation of epithelial-mesenchymal transition. 28 Overexpression of STMN1 is reported to be related to tumor metastasis, and targeting STMN1 has been found to result in decreased cell proliferation and metastasis and increased apoptosis. 29 -32 Accordingly, our findings provided evidence that STMN1 could also affect cell proliferation and migration in ccRCC cells.
ccRCC is a special type of cancer that is characterized by several metabolic changes, especially glucose and lipid metabolism due to hypoxia, and ccRCC cells are rich in lipid droplets. 33,34 Our previous study in other types of cancer showed that CARMA3 might regulate amino acid metabolism through the NF-κB pathway, but whether CARMA3 regulates cell metabolism in the same way through the NF-κB pathway should be discussed further.
We concluded that CARMA3 was highly expressed in ccRCC samples, promoting the proliferation, migration, and invasion of ccRCC cells by activating the NF-κB pathway and transcriptional regulation of the expression of STMN1. STMN1 is regulated by the MAPK pathway, which is indirectly mediated by the NF-κB pathway. Thus, it might indicate that the regulation of STMN1 by CARMA3 might also occur indirectly. In conclusion, we identified STMN1 as an effector of CARMA3 that could affect the proliferation and metastasis of ccRCC. Our findings might inform the confirmation of CARMA3 as a potential therapeutic target for ccRCC treatment.
Supplemental Material
Supplemental Material, sj-tif-1-tct-10.1177_15330338211027915 for CARMA3 Transcriptional Regulation of STMN1 by NF-κB Promotes Renal Cell Carcinoma Proliferation and Invasion by Du Shi, Zhe Zhang and Chuize Kong in Technology in Cancer Research & Treatment
Footnotes
Authors’ Note: Tissue samples were obtained surgically from 45 patients with RCC treated in the First Affiliated Hospital of China Medical University. All patients provided signed informed consent forms, and the collection and use of tissue samples were approved by the Institutional Ethics Committee of the First Affiliated Hospital of China Medical University (Grant No. [2019]67).
Declaration of Conflicting Interests: The author(s) declared no potential conflicts of interest with respect to the research, authorship, and/or publication of this article.
Funding: The author(s) disclosed receipt of the following financial support for the research, authorship, and/or publication of this article: This work was supported by Shenyang Plan Project of Science and Technology (Grant No. F19-112-4-098), National key R & D plan key research projects of precision medicine (2017YFC0908000), Shenyang Clinical Medical Research Center (Grant No. 20-204-4-42), and Liaoning Clinical Medical Research Center (Grant No. [2020]44).
ORCID iDs: Du Shi  https://orcid.org/0000-0003-1865-0696
Zhe Zhang  https://orcid.org/0000-0001-6711-2259
Supplemental Material: Supplemental material for this article is available online.
References
- 1. Siegel RL, Miller KD, Jemal A. Cancer statistics, 2019. CA Cancer J Clin. 2019;69(1):7–34. [DOI] [PubMed] [Google Scholar]
- 2. Hsieh JJ, Purdue MP, Signoretti S, et al. Renal cell carcinoma. Nat Rev Dis Primers. 2017;3:17009. [DOI] [PMC free article] [PubMed] [Google Scholar]
- 3. Zhu L, Li Y, Xie X, et al. TBKBP1 and TBK1 form a growth factor signalling axis mediating immunosuppression and tumourigenesis. Nat Cell Biol. 2019;21(12):1604–1614. [DOI] [PMC free article] [PubMed] [Google Scholar]
- 4. Staal J, Driege Y, Haegman M, et al. Defining the combinatorial space of PKC: CARD-CC signal transduction nodes. FEBS J. 2021;288(5):1630–1647. [DOI] [PubMed] [Google Scholar]
- 5. McAuley JR, Freeman TJ, Ekambaram P, Lucas PC, McAllister-Lucas LM. CARMA3 is a critical mediator of G protein-coupled receptor and receptor tyrosine kinase-driven solid tumor pathogenesis. Front Immunol. 2018;9:1887. [DOI] [PMC free article] [PubMed] [Google Scholar]
- 6. Zhang S, Lin X. CARMA3: scaffold protein involved in NF-kappaB signaling. Front Immunol. 2019;10:176. [DOI] [PMC free article] [PubMed] [Google Scholar]
- 7. Rana S, Maples PB, Senzer N, Nemunaitis J. Stathmin 1: a novel therapeutic target for anticancer activity. Expert Rev Anticancer Ther. 2008;8(9):1461–1470. [DOI] [PubMed] [Google Scholar]
- 8. Watanabe A, Suzuki H, Yokobori T, et al. Stathmin1 regulates p27 expression, proliferation and drug resistance, resulting in poor clinical prognosis in cholangiocarcinoma. Cancer Sci. 2014;105(6):690–696. [DOI] [PMC free article] [PubMed] [Google Scholar]
- 9. Gao R, Zhang N, Yang J, et al. Long non-coding RNA ZEB1-AS1 regulates miR-200b/FSCN1 signaling and enhances migration and invasion induced by TGF-beta1 in bladder cancer cells. J Exp Clin Cancer Res. 2019;38(1):111. [DOI] [PMC free article] [PubMed] [Google Scholar]
- 10. Gao Z, Man X, Li Z, et al. PLK1 promotes proliferation and suppresses apoptosis of renal cell carcinoma cells by phosphorylating MCM3. Cancer Gene Ther. 2019;27(6):412–423. [DOI] [PubMed] [Google Scholar]
- 11. Liu X, Zhang X, Bi J, Li Z, Zhang Z, Kong C. Caspase recruitment domain family member 10 regulates carbamoyl phosphate synthase 1 and promotes cancer growth in bladder cancer cells. J Cell Mol Med. 2019;23(12):8128–8138. [DOI] [PMC free article] [PubMed] [Google Scholar]
- 12. Wu GL, Yuan JL, Huang XD, et al. Evaluating the expression of CARMA3 as a prognostic tumor marker in renal cell carcinoma. Tumour Biol. 2013;34(6):3431–3435. [DOI] [PubMed] [Google Scholar]
- 13. Peng L, He K, Cao Z, et al. CARD10 promotes the progression of renal cell carcinoma by regulating the NFkappaB signaling pathway. Mol Med Rep. 2020;21(1):329–337. [DOI] [PMC free article] [PubMed] [Google Scholar]
- 14. Zhang S, Pan D, Jia XM, Lin X, Zhao X. The CARMA3-BCL10-MALT1 (CBM) complex contributes to DNA damage-induced NF-kappaB activation and cell survival. Protein Cell. 2017;8(11):856–860. [DOI] [PMC free article] [PubMed] [Google Scholar]
- 15. Ekambaram P, Lee JL, Hubel NE, et al. The CARMA3-Bcl10-MALT1 signalosome drives NFkappaB activation and promotes aggressiveness in angiotensin II receptor-positive breast cancer. Cancer Res. 2018;78(5):1225–1240. [DOI] [PMC free article] [PubMed] [Google Scholar]
- 16. Chang YW, Chiu CF, Lee KY, et al. CARMA3 represses metastasis suppressor NME2 to promote lung cancer stemness and metastasis. Am J Respir Crit Care Med. 2015;192(1):64–75. [DOI] [PubMed] [Google Scholar]
- 17. Man X, Liu T, Jiang Y, et al. Silencing of CARMA3 inhibits bladder cancer cell migration and invasion via deactivating beta-catenin signaling pathway. Onco Targets Ther. 2019;12:6309–6322. [DOI] [PMC free article] [PubMed] [Google Scholar]
- 18. Vallabhapurapu S, Karin M. Regulation and function of NF-kappaB transcription factors in the immune system. Annu Rev Immunol. 2009;27:693–733. [DOI] [PubMed] [Google Scholar]
- 19. Hoffmann A, Natoli G, Ghosh G. Transcriptional regulation via the NF-kappaB signaling module. Oncogene. 2006;25(11):6706–6716. [DOI] [PubMed] [Google Scholar]
- 20. Cole SW. Chronic inflammation and breast cancer recurrence. J Clin Oncol. 2009;27(21):3418–3419. [DOI] [PMC free article] [PubMed] [Google Scholar]
- 21. Morris EJ, Kawamura E, Gillespie JA, et al. Stat3 regulates centrosome clustering in cancer cells via stathmin/PLK1. Nat Commun. 2017;8:15289. [DOI] [PMC free article] [PubMed] [Google Scholar]
- 22. Nemunaitis J. Stathmin 1: a protein with many tasks. New biomarker and potential target in cancer. Expert Opin Ther Targets. 2012;16(7):631–634. [DOI] [PubMed] [Google Scholar]
- 23. Nie W, Xu MD, Gan L, Huang H, Xiu Q, Li B. Overexpression of stathmin 1 is a poor prognostic biomarker in non-small cell lung cancer. Lab Invest. 2015;95(1):56–64. [DOI] [PubMed] [Google Scholar]
- 24. Hsieh SY, Huang SF, Yu MC, et al. Stathmin1 overexpression associated with polyploidy, tumor-cell invasion, early recurrence, and poor prognosis in human hepatoma. Mol Carcinog. 2010;49(5):476–487. [DOI] [PubMed] [Google Scholar]
- 25. Mao Q, Chen Z, Wang K, Xu R, Lu H, He X. Prognostic role of high stathmin 1 expression in patients with solid tumors: evidence from a meta-analysis. Cell Physiol Biochem. 2018;50(1):66–78. [DOI] [PubMed] [Google Scholar]
- 26. Wu H, Deng WW, Yang LL, Zhang WF, Sun ZJ. Expression and phosphorylation of stathmin 1 indicate poor survival in head and neck squamous cell carcinoma and associate with immune suppression. Biomark Med. 2018;12(7):759–769. [DOI] [PubMed] [Google Scholar]
- 27. Ma HL, Jin SF, Ju WT, et al. Stathmin is overexpressed and regulated by mutant p53 in oral squamous cell carcinoma. J Exp Clin Cancer Res. 2017;36(1):109. [DOI] [PMC free article] [PubMed] [Google Scholar]
- 28. Lu Y, Liu C, Xu YF, et al. Stathmin destabilizing microtubule dynamics promotes malignant potential in cancer cells by epithelial-mesenchymal transition. Hepatobiliary Pancreat Dis Int. 2014;13(4):386–394. [DOI] [PubMed] [Google Scholar]
- 29. Lu Y, Liu C, Cheng H, et al. Stathmin, interacting with Nf-kappaB, promotes tumor growth and predicts poor prognosis of pancreatic cancer. Curr Mol Med. 2014;14(3):328–339. [DOI] [PubMed] [Google Scholar]
- 30. Miceli C, Tejada A, Castaneda A, Mistry SJ. Cell cycle inhibition therapy that targets stathmin in in vitro and in vivo models of breast cancer. Cancer Gene Ther. 2013;20(5):298–307. [DOI] [PubMed] [Google Scholar]
- 31. Feng W, Xiaoyan X, Xuan Y, et al. Silencing stathmin-modulating efficiency of chemotherapy for esophageal squamous cell cancer with paclitaxel. Cancer Gene Ther. 2015;22(3):115–121. [DOI] [PubMed] [Google Scholar]
- 32. Byrne FL, Yang L, Phillips PA, et al. RNAi-mediated stathmin suppression reduces lung metastasis in an orthotopic neuroblastoma mouse model. Oncogene. 2014;33(7):882–890. [DOI] [PubMed] [Google Scholar]
- 33. Bianchi C, Meregalli C, Bombelli S, et al. The glucose and lipid metabolism reprogramming is grade-dependent in clear cell renal cell carcinoma primary cultures and is targetable to modulate cell viability and proliferation. Oncotarget. 2017;8(69):113502–113515. [DOI] [PMC free article] [PubMed] [Google Scholar]
- 34. Lucarelli G, Ferro M, Loizzo D, et al. Integration of lipidomics and transcriptomics reveals reprogramming of the lipid metabolism and composition in clear cell renal cell carcinoma. Metabolites. 2020;10(12):509. [DOI] [PMC free article] [PubMed] [Google Scholar]
Associated Data
This section collects any data citations, data availability statements, or supplementary materials included in this article.
Supplementary Materials
Supplemental Material, sj-tif-1-tct-10.1177_15330338211027915 for CARMA3 Transcriptional Regulation of STMN1 by NF-κB Promotes Renal Cell Carcinoma Proliferation and Invasion by Du Shi, Zhe Zhang and Chuize Kong in Technology in Cancer Research & Treatment


