Abstract
Super‐resolution imaging has revealed that key synaptic proteins are dynamically organized within sub‐synaptic domains (SSDs). To examine how different inhibitory receptors are regulated, we carried out dual‐color direct stochastic optical reconstruction microscopy (dSTORM) of GlyRs and GABAARs at mixed inhibitory synapses in spinal cord neurons. We show that endogenous GlyRs and GABAARs as well as their common scaffold protein gephyrin form SSDs that align with pre‐synaptic RIM1/2, thus creating trans‐synaptic nanocolumns. Strikingly, GlyRs and GABAARs occupy different sub‐synaptic spaces, exhibiting only a partial overlap at mixed inhibitory synapses. When network activity is increased by 4‐aminopyridine treatment, the GABAAR copy numbers and the number of GABAAR SSDs are reduced, while GlyRs remain largely unchanged. This differential regulation is likely the result of changes in gephyrin phosphorylation that preferentially occurs outside of SSDs. The activity‐dependent regulation of GABAARs versus GlyRs suggests that different signaling pathways control the receptors' sub‐synaptic clustering. Taken together, our data reinforce the notion that the precise sub‐synaptic organization of GlyRs, GABAARs, and gephyrin has functional consequences for the plasticity of mixed inhibitory synapses.
Keywords: direct stochastic optical reconstruction microscopy, GABAAR, GlyR, single‐molecule localization microscopy, sub‐synaptic domains
Subject Categories: Neuroscience
This study analyzes the internal organization of mixed inhibitory spinal cord synapses using dSTORM and reveals the existence of trans‐synaptic nanocolumns containing GlyRs and GABAARs that are differentially regulated in response to altered network activity.

Introduction
The application of single‐molecule localization microscopy (SMLM) has provided new information about the nanoscale organization of synapses. Numerous post‐synaptic proteins are heterogeneously distributed at synapses and compartmentalized in sub‐synaptic domains (SSDs) (discussed in Yang & Specht, 2019). At excitatory synapses, AMPARs assemble dynamically in SSDs that are stabilized by the scaffold protein PSD‐95 (MacGillavry et al, 2013; Nair et al, 2013). At inhibitory synapses, gephyrin molecules also form SSDs, which are re‐organized during inhibitory synaptic plasticity (Specht et al, 2013; Pennacchietti et al, 2017). Furthermore, Tang and colleagues have shown that post‐synaptic SSDs at excitatory synapses are aligned with pre‐synaptic SSDs, forming so‐called trans‐synaptic nanocolumns (Tang et al, 2016). This led to the proposal that sub‐synaptic domains are functional units underlying synaptic plasticity.
Glycine receptors (GlyRs) and gamma‐aminobutyric acid type A receptors (GABAARs) are the two main inhibitory receptors mediating fast inhibition in the central nervous system. In the spinal cord, GlyRs and GABAARs co‐exist at the same post‐synaptic density (PSD) during development and into adulthood (Triller et al, 1987; Todd et al, 1996; Chery & de Koninck, 1999; Dumoulin et al, 2000; Legendre, 2001). These synapses are referred to as mixed inhibitory synapses. The corresponding neurotransmitters, glycine and GABA, are co‐released from the same pre‐synaptic vesicles (Jonas et al, 1998; Keller et al, 2001; O'Brien & Berger, 2001). Glycinergic and GABAergic mIPSCs have distinct kinetics, the latter exhibiting slower decay times (Alvarez, 2017). Moreover, previous studies have shown that the lateral diffusion of synaptic GlyRs and GABAARs are differentially regulated at mixed inhibitory synapses by excitatory activity and microglia‐dependent signaling (Levi et al, 2008; Cantaut‐Belarif et al, 2017). These observations raise the possibility that the selective control of GlyRs and GABAARs underlie the plasticity of mixed inhibitory synapses.
Gephyrin is the main scaffold protein at inhibitory synapses and a key player for both GlyR and GABAAR clustering. Biochemical studies have shown that gephyrin molecules form stable trimers through interactions of their G‐domains and that they can dimerize via their E‐domains (Schrader et al, 2004; Sola et al, 2004; Saiyed et al, 2007). It has thus been proposed that gephyrin molecules form a hexagonal lattice below the post‐synaptic membrane (Kneussel & Betz, 2000). Gephyrin provides binding sites for both GlyRs and GABAARs, even though the affinity for GlyRs is substantially higher than that of GABAARs (reviewed in Tretter et al, 2012). The binding sites for the different receptor subunits in the gephyrin E‐domain overlap, resulting in a competition between GlyRs and GABAARs for the same binding pocket of gephyrin at mixed inhibitory synapses (Maric et al, 2011). Furthermore, gephyrin molecules are prone to numerous post‐translational modifications such as phosphorylation at multiple amino acid residues within the C‐domain, which are important for the regulation of receptor binding and/or gephyrin clustering (Tyagarajan et al, 2011; Kuhse et al, 2012; Tyagarajan et al, 2013; Kalbouneh et al, 2014; Ghosh et al, 2016; Niwa et al, 2019).
In this study, we focused on the nanoscale organization of mixed inhibitory synapses in spinal cord neurons and investigated how endogenous GlyRs and GABARs are regulated at the sub‐synaptic level using two‐color direct stochastic optical reconstruction microscopy (dSTORM). Our data identify trans‐synaptic nanocolumns comprising SSDs of RIM1/2, a component of the pre‐synaptic active zone (AZ), as well as the post‐synaptic scaffold protein gephyrin, GlyRs, and GABAARs. Interestingly, the two types of receptor were partially segregated, each dominating different sub‐synaptic domains. While GlyR clustering was insensitive to short‐term changes in network activity, GABAARs were differentially regulated by neuronal activity, implying a role in the plasticity of mixed inhibitory synapses.
Results
Trans‐synaptic nanocolumns at inhibitory synapses in spinal cord neurons
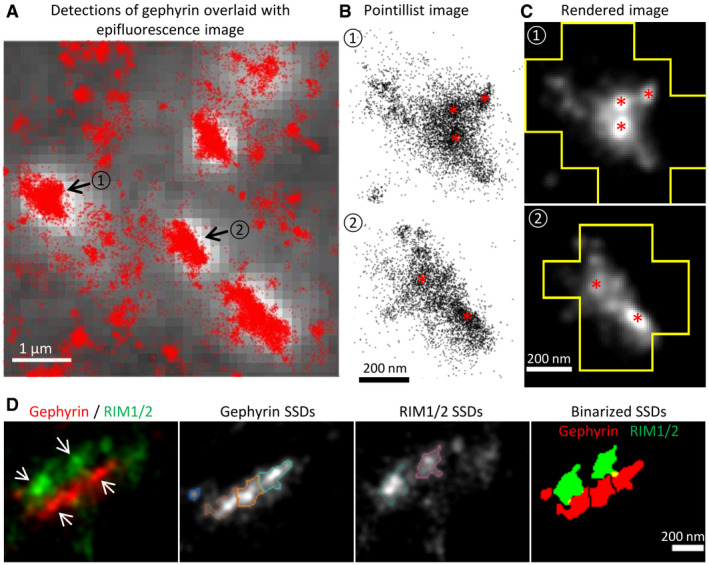
To probe the spatial relationship between pre‐ and post‐synaptic elements at inhibitory synapses in spinal cord neurons, we conducted dual‐color dSTORM imaging in native tissue. Semi‐thin sections (2 µm) of mouse spinal cord tissue were immuno‐labeled with antibodies against the post‐synaptic scaffold protein gephyrin and the pre‐synaptic AZ protein RIM1/2 and imaged by dSTORM (Fig 1). The gephyrin clusters in dSTORM images exhibited a heterogeneous distribution, forming sub‐synaptic domains (SSDs) that are visible both in pointillist representations and in rendered images (Fig 1A–C). Two‐color dSTORM images of gephyrin and RIM1/2 further revealed a close association between gephyrin SSDs and RIM1/2 SSDs (Fig 1D). This alignment of pre‐ and post‐synaptic SSDs is reminiscent of trans‐synaptic nanocolumns that have been identified at excitatory synapses in primary cultured neurons (Tang et al, 2016). The existence of gephyrin SSDs at native inhibitory synapses and their alignment with pre‐synaptic release sites may indicate a possible role in synaptic function.
Figure 1. Gephyrin SSDs and their alignment with pre‐synaptic RIM1/2 in vivo .
-
A–CdSTORM imaging of gephyrin in sucrose impregnated cryosections of adult mouse spinal cord. (A) dSTORM detections of gephyrin (red dots) overlaid with the epifluorescence image (white with gray background). Synaptic clusters of gephyrin in dSTORM images were identified by the epifluorescence puncta. Scale bar: 1 µm. (B) Enlarged pointillist images of the two gephyrin clusters indicated in (A). (C) Rendered images of the two gephyrin clusters outlined with the boundaries of the epifluorescence mask. Gephyrin SSDs are indicated with red asterisks in (B) and (C). Scale bar: 200 nm.
-
DTwo‐color dSTORM imaging of RIM1/2 and gephyrin in cryosections. From left to right: rendered images of RIM1/2 and gephyrin clusters showing the aligned SSDs (arrows); gephyrin SSDs segmented by H‐watershed outlined with different colors; RIM1/2 SSDs outlined with different colors; binary SSDs of gephyrin and RIM1/2. Inhibitory synapses were identified by the gephyrin clusters in the epifluorescence images. Scale bar: 200 nm. RIM1/2 was labeled with Alexa 647, gephyrin (mAb7a) with Cy3B in these experiments.
Source data are available online for this figure.
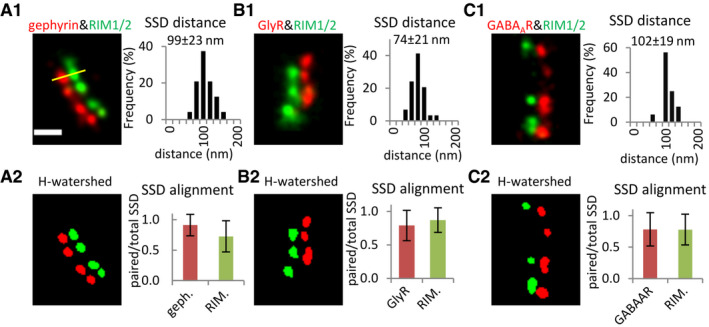
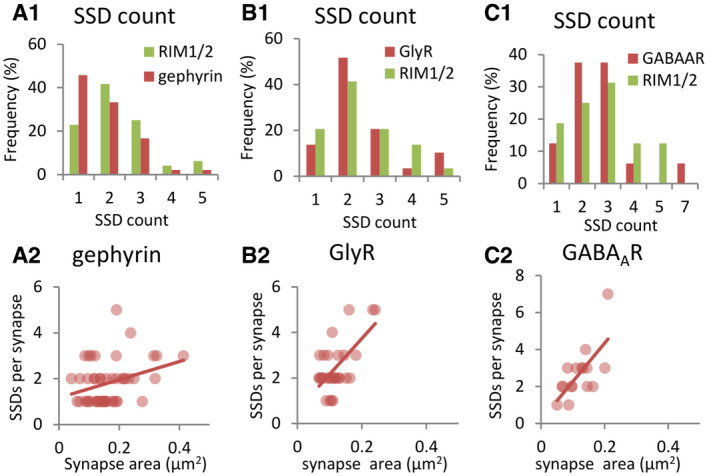
For a closer characterization of the spatial organization, we made use of cultured spinal cord neurons for our subsequent experiments. Two‐color dSTORM imaging of synapses in cultured neurons was conducted on the target proteins in a pairwise manner (see Materials and Methods). To quantify the pre‐ and post‐synaptic organization along the trans‐synaptic axis, super‐resolution images of synapses with side view profiles were selected from the rendered dSTORM images. These images revealed a heterogeneous distribution of RIM1/2, gephyrin (antibody mAb7a), GlyRs and GABAARs, all of which formed distinctive SSDs at inhibitory synapses (Fig 2). The number of SSDs per synaptic cluster for these proteins was generally one to four (Fig EV1A1–C1), and the SSD counts increased with the synaptic cluster area (Fig EV1A2–C2). Importantly, post‐synaptic SSDs of gephyrin, GlyRs, and GABAARs were often aligned with pre‐synaptic RIM1/2 SSDs (Fig 2).
Figure 2. Trans‐synaptic alignment at inhibitory synapses in cultured spinal cord neurons.
-
A–CAlignment of SSDs of pre‐synaptic RIM1/2 and SSDs of post‐synaptic gephyrin, GlyRs, and GABAARs, respectively. (A1–C1) Distances were measured between the intensity peaks of paired SSDs in rendered dual‐color dSTORM images (yellow line, values given in mean ± SD). RIM1/2 was labeled with Alexa 647 and gephyrin (mAb7a) with Cy3B in (A1). RIM1/2 was labeled with Cy3B, while GlyRs or GABAARs were labeled with Alexa 647 in (B1) and (C1). (A2–C2) Trans‐synaptic alignment of SSDs of gephyrin, GlyRs, GABAARs, and RIM1/2. SSDs were segmented by H‐watershed. Data are plotted as mean ± SD. Number of synapses: n = 48 (A1, A2) from three independent experiments (no treatment), n = 30 (B1, B2) from two experiments with TTX treatment, n = 16 (C1, C2) from two experiments with TTX. Only synapses with side view profiles were included. All images are adjusted to the same scale. Scale bar: 200 nm.
Source data are available online for this figure.
Figure EV1. Sub‐synaptic domains of inhibitory synaptic proteins.
-
A–CNumber of SSDs per synapse. (A1–C1) Histograms of SSD numbers of RIM1/2 and gephyrin, GlyRs, and GABAARs, respectively. (A2–C2) Correlation between SSD numbers and synaptic cluster sizes of different post‐synaptic proteins. Spearman R test, P > 0.5 in (A2) and (B2), P < 0.5 in (C2). Quantification was done on synapses with side view profiles as shown in Fig 2. Number of synapses: n = 48 (A1, A2), n = 30 (B1, B2), n = 16 (C1, C2).
Source data are available online for this figure.
We measured the distances between the paired pre‐synaptic SSDs and post‐synaptic SSDs (Fig 2A1–C1, see Materials and Methods). The average distance between SSDs of pre‐synaptic RIM1/2 and post‐synaptic gephyrin was 99 ± 23 nm (mean ± SD, from 48 synapses), well within the range of similar measurements between RIM1 and post‐synaptic scaffold proteins at excitatory synapses (Dani et al, 2010). The distance between SSDs of RIM1/2 and GABAARs was similar, measuring 102 ± 19 nm (n = 16 synapses), while the apparent distance between RIM1/2 and GlyR SSDs was slightly shorter at 74 ± 21 nm (n = 30 synapses). Next, we quantified the degree of alignment between pre‐ and post‐synaptic structures, expressed as the ratio of paired SSDs divided by the total number of SSDs for each target protein (Fig 2A2–C2). The majority of gephyrin SSDs were aligned with RIM1/2 SSDs (0.91 ± 0.18, mean ± SD), and most RIM1/2 SSDs were in turn also aligned with SSDs of gephyrin (0.73 ± 0.26). Similarly, RIM1/2 SSDs were aligned with GlyR and GABAAR SSDs (0.87 ± 0.18 and 0.78 ± 0.24, respectively) and vice versa (0.79 ± 0.23 and 0.78 ± 0.27, respectively). These results confirm the existence of trans‐synaptic nanocolumns at inhibitory synapses in cultured spinal cord neurons.
Figure EV2. Two‐color dSTORM imaging of GABAARs and GlyRs.
-
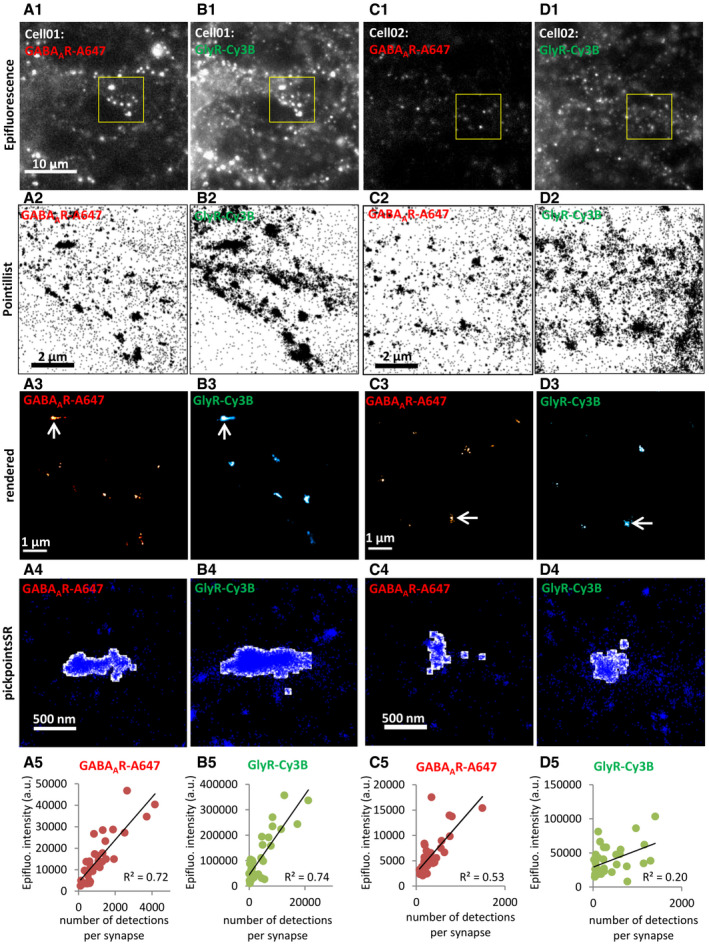
A–DWorkflow of the dual‐color dSTORM experiments. (A1–D1) Epifluorescence images of two fields of views of spinal cord neurons labeled for GABAARs (with Alexa 647) and GlyRs (with Cy3B). The brightness and contrast between A1 and C1, and between B1 and D1 are adjusted to the same dynamic range. Scale bar: 10 µm. (A2–D2) Pointillist images showing the dSTORM detections within the regions in the yellow boxes in A1–D1. Scale: 2 µm. (A3–D3) Rendered images from the detections shown in A2–D2. Super‐resolution GABAAR clusters are shown in red hot false colors, GlyR clusters in cyan hot. Arrows indicate the synaptic clusters shown in the magnified images A4–D4. Scale: 1 µm. (A4–D4) Detections (blue dots) overlaid with synaptic masks (in white) in the pickpointsSR program in Matlab. Synaptic masks were produced by binarizing the corresponding super‐resolution clusters indicated by arrows in A3–D3. Scale: 500 nm. (A5–D5) Correlation between the total fluorescence intensity of synaptic clusters measured in epifluorescence images and the number of detections per synapse in dSTORM. Spearman R test, P < 0.0001 in A5, B5, C5, P < 0.05 in D5. Each data point represents one synapse (n = 33 in A5 and B5, n = 35 in C5 and D5).
Source data are available online for this figure.
Trans‐synaptic nanocolumns consisting of RIM1/2 and gephyrin SSDs may recruit both GlyRs and GABAARs at mixed inhibitory synapses. This is consistent with a recent study using STED and SIM super‐resolution imaging, showing that gephyrin SSDs and GABAAR SSDs were closely associated with RIM1/2 SSDs at hippocampal and cortical synapses (Crosby et al, 2019). Given that trans‐synaptic nanocolumns were also observed at excitatory synapses (MacGillavry et al, 2013; Tang et al, 2016; Haas et al, 2018), it appears likely that they have a common functional role in fine‐tuning synaptic transmission.
Partial overlap of GlyR and GABAAR SSDs at mixed inhibitory synapses
The majority of inhibitory synaptic boutons in cultured spinal cord neurons are opposed to PSDs containing both GlyRs and GABAARs (Dumoulin et al, 2000). We therefore compared the relative distributions of GlyRs and GABAARs at mixed inhibitory synapses using two‐color dSTORM. In these experiments, the choice of fluorescent dyes is one of the main factors determining the quality of the reconstructed super‐resolution images (Dempsey et al, 2011; van de Linde et al, 2011). In addition, it is essential to achieve dense labeling, which is challenging in the case of synaptic proteins, particularly neurotransmitter receptors (discussed in Yang & Specht, 2020). We tested different antibody and dye combinations for the detection of GlyR and GABAAR clusters in two‐color dSTORM. The best combination was to label GABAARs with secondary antibodies conjugated with Alexa Fluor 647 (A647) and GlyRs with Cy3B (Fig EV2), since the number of detections in dSTORM was closely correlated with the cluster intensity in the epifluorescence images (Fig EV2A5–B5). The detection efficiency of this dye combination was also relatively good when the amount of receptor labeling was low (Fig EV2C and D).
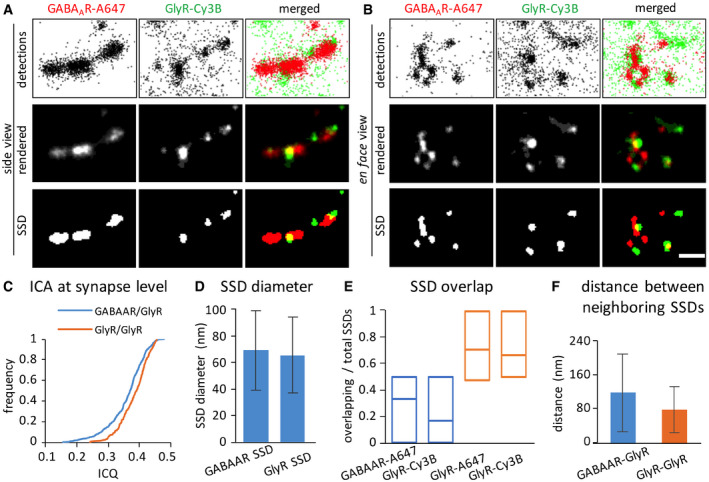
Using this labeling protocol, we compared the spatial organization of GlyRs and GABAARs at mixed inhibitory synapses in cultured spinal cord neurons. Receptor clusters in rendered dSTORM images were highly variable and formed sub‐synaptic domains. However, the shape and the size of the overall synaptic structure were similar (Fig 3A and B upper panels). Image correlation analysis (ICA) of the rendered dual‐color dSTORM images of synaptic clusters gave a mean ICQ value of 0.36 ± 0.06 SD (Fig 3C), showing a relatively good correspondence between the GABAAR and GlyR distribution. Nevertheless, the SSDs of GlyRs and GABAARs displayed only limited co‐localization (Fig 3A and B lower panels). With an average diameter of 70 nm (Fig 3D), the size of GlyR and GABAAR SSDs was similar to the reported size of SSDs of AMPA receptors at excitatory synapses (Nair et al, 2013).
Figure 3. Differential organization of GlyRs and GABAARs at mixed inhibitory synapses.
-
A, BRepresentative dSTORM images of GlyRs and GABAARs at synapses in side view (A) or en face view (B). The top row of images shows the pointillist representation of the detections, the second row the rendered images, and the bottom row the corresponding segmented SSDs. GlyRs were labeled with Cy3B and GABAARs with Alexa Fluor 647 in these experiments. Scale bar: 200 nm.
-
CImage correlation analysis (ICA) of GlyR and GABAAR clusters at the same PSDs. The ICQ values between GlyR and GABAAR clusters (blue trace, 0.36 ± 0.06, n = 395 synapses from three independent experiments) are significantly lower than between GlyR clusters labeled with two secondary antibodies conjugated with different fluorophores (yellow trace, 0.38 ± 0.04, n = 218 synapses from two independent experiments; MW test, P < 0.0001).
-
DThe mean diameter of GlyR SSDs is 65 ± 29 nm (mean ± SD, n = 1,105 SSDs from 395 synapses and three independent experiments), that of GABAAR SSDs is 69 ± 30 nm (mean ± SD, n = 733 SSDs from 395 synapses and three experiments).
-
EPartial overlap between the SSDs of GlyRs and GABAARs. The fraction of overlapping SSDs was calculated based on the binarized images for each synapse (without selection for synapse orientation), dividing the number of overlapping SSDs by the total number of SSDs for each receptor. Data are shown as median, 25 and 75% quartiles of the population (only synaptic clusters with ≥ 2 SSDs in the respective channel; n = 183 for GABAAR‐A647, n = 277 for GlyR‐Cy3B, from three independent experiments). GlyRs labeled with both A647‐ and Cy3B‐conjugated secondary antibodies for the same primary antibody were used as positive control (n = 158 GlyR‐A647 and n = 171 GlyR‐Cy3B clusters from two independent experiments). The GABAAR‐GlyR overlap is significantly lower than the GlyR‐GlyR match (KW test, P < 0.0001).
-
FDistance measurement between GlyR SSDs and GABAAR SSDs (blue bar; mean ± SD, n = 556 SSDs from 395 synapses and three independent experiments) and between double‐labeled GlyR SSDs (yellow, mean ± SD, n = 403 SSDs from 218 synapses and two experiments).
Source data are available online for this figure.
To quantify the degree of co‐localization, we calculated the number of overlapping SSDs divided by the total number of SSDs for each fluorescent channel (Fig 3E). According to this analysis, an average of about 30% of GlyR and GABAAR SSDs overlap with one another. The surprisingly low degree of overlap could be due to the inherent stochasticity of dSTORM imaging that underestimates the true level of co‐localization (see Discussion). We therefore performed a control experiment in which the same primary, but two different secondary antibodies were used to detect GlyR SSDs (Fig 3C, E and F). The overlap of GlyR SSDs in the two dSTORM images was on average 65%, representing the maximum value that can be obtained in our assay for perfectly matched epitopes (Fig 3E). The fact that the overlap between GlyR and GABAAR SSDs was significantly lower than in the GlyR control experiment (KW test P < 0.0001) indicates an incomplete sub‐synaptic co‐localization of GlyRs and GABAARs. Furthermore, the distance between GlyR and GABAAR SSDs (117 ± 91 nm, mean ± SD) was substantially larger than that between GlyR SSDs in the two channels (79 ± 54 nm, MW P < 0.0001, Fig 3F). Together, these measurements confirm that GlyRs and GABAARs occupy partially overlapping, yet distinct domains at mixed inhibitory PSDs.
Differential regulation of GlyRs and GABAARs in response to altered network activity
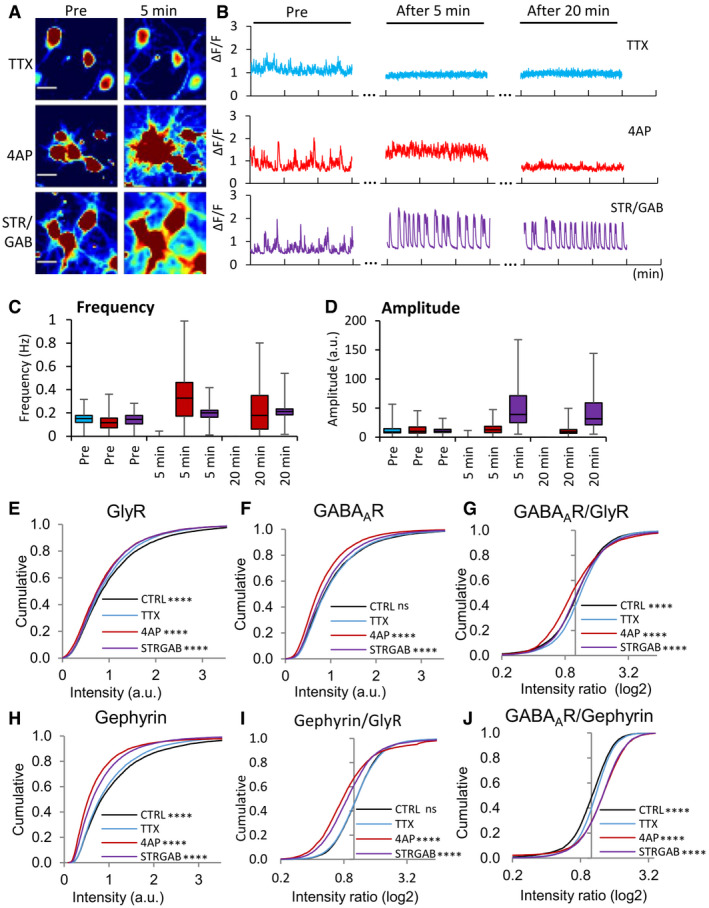
Since GlyRs and GABAARs occupy different sub‐synaptic compartments, we hypothesized that they may be controlled through different clustering mechanisms. To investigate whether GlyRs and GABAARs were differentially regulated by neuronal activity, we adopted a pharmacological approach. Spinal cord neurons were treated either with tetrodotoxin (TTX) or with 4‐aminopyridine (4‐AP) to reduce or to increase the neuronal network activity, respectively. We observed few calcium signals in neurons under control conditions, suggesting a low basal activity in cultured spinal cord neurons. TTX completely abolished the calcium signals, while 4‐AP increased the firing frequency but did not change the amplitude of the calcium transients (Fig EV3A–D). Experiments were also carried out with strychnine and gabazine (STR/GAB) to block inhibitory neurotransmission, which led to a strong increase in the amplitude and synchronicity of calcium transients.
Figure EV3. Calcium imaging and immunocytochemistry (ICC) of cultured spinal cord neurons in response to changes in network activity.
-
ACalcium signals before treatment (pre) and after a 5‐min application of TTX (top), 4‐AP (middle), or strychnine/gabazine (bottom, false color). The brightness and contrast were adjusted to the same range across all the images. Note that cells active at baseline were chosen in order to better illustrate the effects of the treatments. Scale bar: 20 μm.
-
BMeasurement of calcium signals at the beginning of the recording (pre) and after 5 and 20 min of bath application of TTX (top, blue traces), 4‐AP (middle, red traces), or strychnine/gabazine (bottom, purple traces) to induce changes in neuronal network activity.
-
C, DQuantification of the amplitudes and frequency of the calcium signals. The amplitude was calculated as the average intensity of calcium transients per cell during the 3 min recordings. Before treatment (pre), baseline activity had a frequency of 0.15 ± 0.06 Hz/0.12 ± 0.07 Hz/0.14 ± 0.06 Hz, and an amplitude of 12.72 ± 9.21/12.34 ± 8.04/11.33 ± 5.25 (in cells treated with TTX, 4‐AP, and strychnine/gabazine, respectively). TTX blocked all neuronal activity, as judged by the lack of calcium signals after application. Five minutes after 4‐AP treatment, the frequency of calcium transients was greatly increased (0.33 ± 0.21 Hz, Friedman test with Dunn's post hoc test, P < 0.0001) and the amplitude was unchanged (14.56 ± 9.43, P = 0.31). On the other hand, 5 min strychnine/gabazine treatment increased both the frequency (0.20 ± 0.06, P < 0.0001) and the amplitude (52.68 ± 39.23, P < 0.0001). Number of cells: n = 117 for 4‐AP (red bars), n = 70 for TTX treatment (blue bars), n = 114 for strychnine/gabazine (purple bars), from three independent experiments, data are represented as box plots showing the median, 25 and 75% quartiles, as well as the minimum and the maximum of the population.
-
E–JDifferential regulation of GlyRs, GABAARs, and gephyrin through altered network activity. (E–G) Quantification of synaptic levels of GlyRs, GABAARs, and GABAAR/GlyR ratios using ICC. Some of these data are the same as in Fig 4 (TTX and 4‐AP treatment). (H) Treatment of cultured spinal cord neurons with 4‐AP strongly reduced gephyrin immuno‐labeling (KW test, P < 0.0001). Gephyrin was detected with mAb7a antibody that recognizes the phosphorylated S270 epitope of gephyrin. (I, J) Intensity ratios of gephyrin/GlyR and GABAAR/gephyrin, showing their relative changes at the same synapses (KW test, P < 0.0001 in I and J). The control (CTRL) condition was without any pharmacological treatment. Number of synapses: n = 9,416 in TTX (blue traces), n = 6,949 in 4‐AP (red), n = 8,856 in CTRL (black), n = 8,150 in strychnine/gabazine conditions (purple) from three independent experiments. KW test/Dunn's test, P values indicate the comparison to the TTX condition. ns: not significant, ****P < 0.0001.
Source data are available online for this figure.
To examine whether GlyRs and GABAARs were affected by changes in network activity, neurons were treated with TTX and 4‐AP for 1 h, then fixed and triple labeled with antibodies against GlyRs, GABAARs, and gephyrin. Epifluorescence images in the three channels were taken with conventional fluorescence microscopy (Fig 4A). Synaptic clusters were detected by generating masks based on the gephyrin labeling. The apparent size of the gephyrin puncta (area in pixels) did not differ between the TTX and 4‐AP conditions (Fig 4B). The gephyrin masks were then used to measure the intensities of the different associated synaptic receptors. Interestingly, GABAAR but not GlyR intensities were significantly decreased after 4‐AP treatment compared to the TTX condition that served as control in these experiments (Fig 4C). In order to directly compare how the two receptors reacted at the same PSDs, we calculated the ratio of GABAAR/GlyR intensity for each synapse. Lower GABAAR/GlyR ratios under 4‐AP treatment confirmed that higher network activity decreases synaptic GABAAR levels, but had no or little effect on GlyRs at the same PSDs (Fig 4D). Receptor and gephyrin levels under basal conditions in untreated neurons (CTRL) were generally close to the TTX condition, whereas treatment with STR/GAB resembled more closely the 4‐AP condition (Fig EV3E–J). However, the CTRL condition was also more variable between individual experiments, indicating that basal network activity can be different (see also Fig EV5C–E). To further investigate the activity‐dependence of the sub‐synaptic organization of GlyRs and GABAARs, we therefore conducted super‐resolution imaging in neurons exposed to altered network activity focusing on the pharmacologically defined states with TTX and 4‐AP.
Figure 4. Reduced GABAAR levels but not GlyRs at mixed inhibitory synapses by 4‐AP treatment.
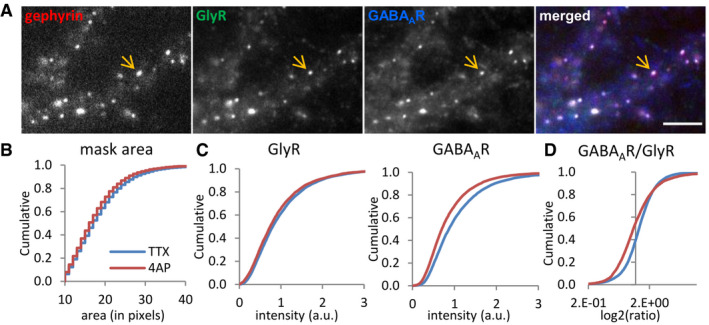
- Triple immuno‐labeling of gephyrin, GlyRs, and GABAARs at mixed inhibitory synapses (arrow) imaged with conventional fluorescence microscopy. Scale bar: 5 µm.
- Quantification of the apparent synaptic area (in pixels) of gephyrin clusters (KS test P < 0.0001).
- Lower fluorescence intensity of GABAARs but only a minor reduction of GlyRs at synaptic gephyrin clusters (KS test, P < 0.0001, both panels).
- Reduced GABAAR/GlyR intensity ratio at mixed inhibitory synapses (KS test, P < 0.0001). Number of synapses: n = 9,416 in TTX and n = 6,949 in 4‐AP conditions from three independent experiments.
Source data are available online for this figure.
Figure EV5. Co‐localization of pS270 gephyrin and total gephyrin at synapses.
-
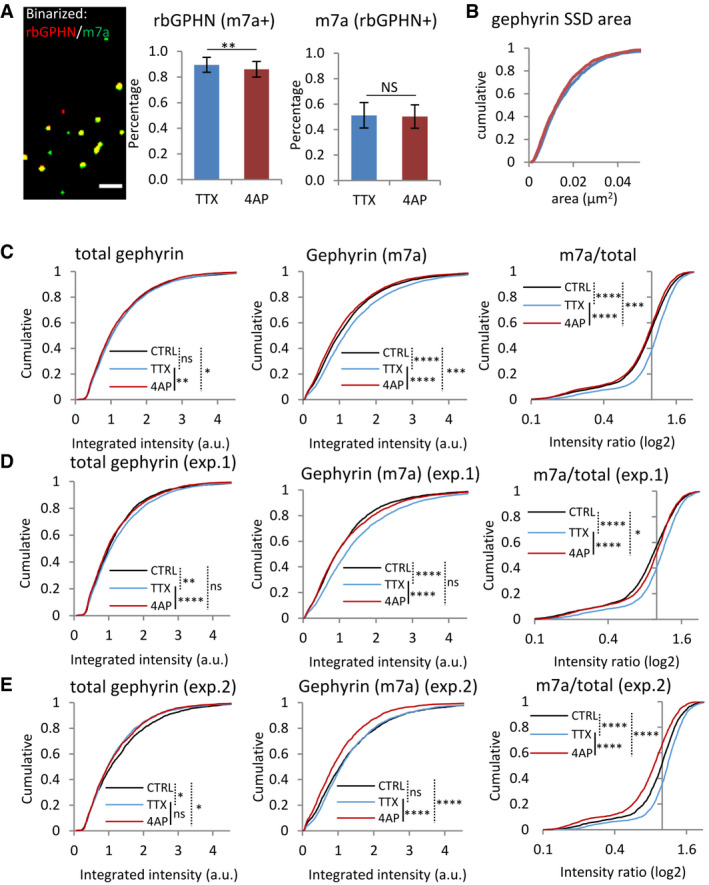
ACo‐localization of total gephyrin (rbGPHN) and phosphorylated pS270 gephyrin clusters (mAb7a) in conventional epifluorescence images. This is a binarized version of the image shown in Fig 7A. Scale bar: 2 µm. After 4‐AP treatment, the percentage of rbGPHN clusters positive for mAb7a (binarized) showed only a minor reduction (middle panel, MW test, **P < 0.01), possibly as a result of decreased mAb7a immunoreactivity. The percentage of mAb7a clusters positive for rbGPHN was not changed (right panel, MW test P = 0.74). mean ± SD; TTX: n = 4,040 synapses, 4‐AP: n = 3,818, from two independent experiments.
-
BGephyrin SSDs segmented from mAb7a clusters in dSTORM images did not show differences in size after 4‐AP treatment (KS test, P = 0.05, n = 810 synapses in TTX and n = 727 in 4‐AP conditions from three experiments).
-
C–EVariability of network activity in the control condition (CTRL, no treatment) in primary spinal cord neuron cultures. (C) The pooled results of two independent experiments (shown in D and E) show that the immunoreactivity of pS270 gephyrin (mAb7a antibody) is differentially modulated by pharmacological treatments that increase (4‐AP, red traces) or decrease (TTX, blue) network activity, relative to the control condition (CTRL, black). Some of these data (TTX and 4‐AP) are the same as the ones shown in Fig 7B and C. Number of synapses: n = 4,040 in TTX (blue traces), n = 3,818 in 4‐AP (red), n = 3,946 in the CTRL condition (black) from two independent experiments. (D, E) Separate analysis of the two experiments shows that while the difference between the TTX and 4‐AP conditions is consistent, the control can vary substantially between experiments. Number of synapses: n = 2,362 in CTRL, n = 2,577 in TTX and n = 2,283 in 4‐AP conditions in (D), and n = 1,584 in CTRL, n = 1,463 in TTX and n = 1,535 in 4‐AP in (E). KW test/Dunn's test, ns: not significant, *P < 0.05, **P < 0.01, ***P < 0.001, ****P < 0.0001.
Source data are available online for this figure.
Activity‐dependent changes of the sub‐synaptic organization of GlyRs and GABAARs
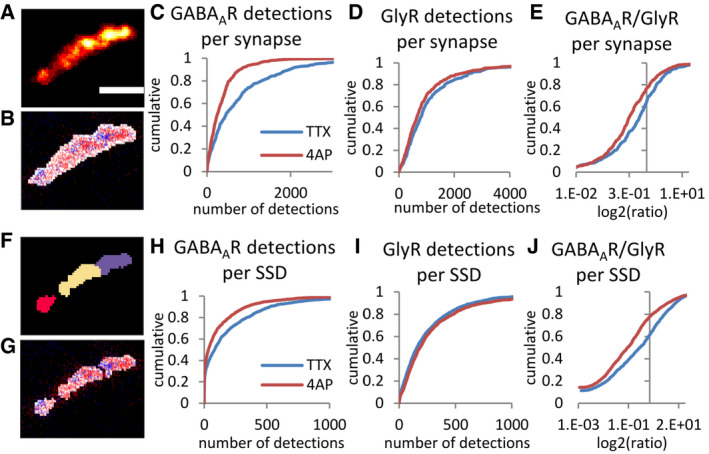
Two‐color dSTORM imaging of GlyRs and GABAARs was performed after 1 h of TTX or 4‐AP bath application. In order to compare the number of detections of GlyRs and GABAARs within the same synapse, the rendered dSTORM images of GlyR and GABAAR clusters were combined to produce total synaptic clusters that we refer to as integrated receptor clusters (Fig 5A). These clusters were binarized to produce a mask of the overall synapse, within which the number GlyR and GABAAR detections were determined (Fig 5B). After 4‐AP treatment, the number of GABAAR detections was significantly decreased, while that of GlyRs did not change (Fig 5C and D). In agreement with the data shown in Fig 4, the ratios of GABAAR/GlyR detections per synapse were reduced, confirming that this phenomenon occurred within individual PSDs (Fig 5E). We also saw a reduction in the area of the integrated receptor clusters following 4‐AP treatment (Fig EV4A). Together, these results established that the copy numbers of GABAARs and GlyRs at synapses are differentially regulated by network activity.
Figure 5. Differential sub‐synaptic re‐organization of GABAARs and GlyRs by 4‐AP treatment.
-
A–ECharacterization of the nanoscale organization of GABAARs and GlyRs at mixed inhibitory synapses. (A) Synaptic receptor cluster rendered from detections of both GABAARs (labeled with Alexa 647) and GlyRs (labeled with Cy3B). (B) Detections of GABAARs (red dots) and GlyRs (blue dots) overlaid with binary synaptic mask (white). (C–E) Detections of GABAARs, but not GlyRs were strongly decreased at mixed synapses after 4‐AP treatment (KS test, P < 0.0001 in C and E, P < 0.001 in D). Scale bar: 200 nm.
-
F–JSub‐synaptic characterization of GABAAR and GlyR domains. (F) Watershed segmentation of sub‐synaptic domains (SSDs). Each SSD is shown in different colors. (G) Detections of GABAARs (red dots) and GlyRs (blue dots) overlaid with SSDs (white). (H–J) Detections of GABAARs but not GlyRs at the same SSDs were reduced after 4‐AP treatment (KS, P < 0.0001 in H and J, P < 0.01 in I). Number of synapses: n = 439 in TTX, n = 531 in 4‐AP condition, from three independent experiments.
Source data are available online for this figure.
Figure EV4. Size measurement of synaptic clusters and SSDs in dSTORM.

-
ASynaptic receptor areas were calculated from the combined clusters of GABAARs and GlyRs in dSTORM images.
-
BReceptor SSDs were segmented from the combined receptor clusters.
-
C, DGABAAR SSDs were segmented from rendered dSTORM images of GABAAR detections, and GlyR SSDs from dSTORM images of GlyR detections. 4‐AP treatment led to a decrease in the total synapse area (A, KS test, P < 0.0001), but not the size of receptor SSDs (B, KS test, P = 0.21), GABAAR SSDs (C, KS test, P = 0.50) or GlyR SSDs (D, KS test, P = 0.23).
Source data are available online for this figure.
Next, we segmented the integrated receptor clusters into SSDs, referred to as receptor SSDs, and counted the number of detections of GlyRs and GABAARs within each of them (Fig 5F and G). This allowed us to compare the relative changes of GlyRs and GABAARs within the same sub‐synaptic domains. The size of the receptor SSDs was not affected by the treatments (Fig EV4B–D). However, the number of GABAAR detections was decreased by 4‐AP, whereas the number of GlyR detections did not change (Fig 5H and I). The reduction of GABAAR relative to GlyR numbers occurred within the same SSDs, as shown by the ratio of detections per SSD (Fig 5J). These results indicate that the activity‐dependent re‐distribution of GABAARs versus GlyRs occurs also at the sub‐synaptic level.
To express these changes in quantitative terms, we considered the number of detections that were recorded for each secondary antibody (50.4 ± 3.3 for IgG‐Alexa 647, and 47.6 ± 3.3 for IgG‐Cy3B, mean ± SEM, see Yang & Specht, 2020). When these values are extrapolated to the total number of detections, absolute copy numbers of immuno‐labeled receptors can be calculated. Accordingly, we estimate to have labeled on the order of 20 GABAARs (IgG‐Alexa 647) and approximately 29 GlyRs (IgG‐Cy3B) per synapse in the control condition. The average number of GABAARs per SSD was 5 and that of GlyRs 8. Increased network activity by 4‐AP treatment reduced the number of detected GABAARs to 8 per synapse and to 3 per SSD, without affecting the number of GlyRs (23 per synapse, 8 per SSD).
The spatial organization at mixed inhibitory synapses was further assessed by quantifying the number of GlyRs and GABAARs SSDs separately (Fig 6). The number of integrated receptor SSDs per synapse was reduced after 4‐AP treatment (Fig 6A), but not their size (Fig EV4B). This reduction could be attributed to a large extent to GABAARs rather than GlyRs, since the number of GABAAR SSDs was strongly reduced (49% of the TTX condition, P < 0.0001, MW test), compared to that of GlyR SSDs (88%, P < 0.01; Fig 6B and C). Together, these data support the idea that the spatial organization of GABAR and GlyR domains is differentially regulated at mixed inhibitory synapses.
Figure 6. Reduced number of GABAAR SSDs after 4‐AP treatment.
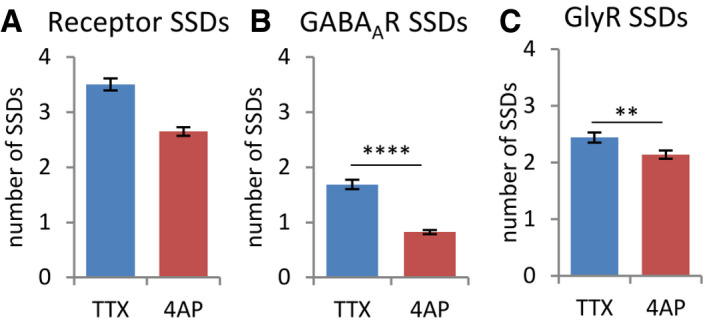
- The number of receptor SSDs, segmented from the combined receptor clusters of GABAARs and GlyRs, was decreased after 4‐AP treatment (MW test, P < 0.0001).
- This was mostly due to the loss of GABAAR SSDs that were segmented from the rendered images of GABAAR detections only (MW, ****P < 0.0001).
- The number of GlyR SSDs (based on GlyR detections) was only marginally reduced (MW, **P < 0.01).
Data information: Number of synapses: n = 452 in TTX, n = 583 in 4‐AP condition, from three independent experiments. Mean ± SEM. These analyses are based on the same dataset as in Fig 5.
Source data are available online for this figure.
Sub‐synaptic regulation of gephyrin phosphorylation
In order to explore a possible mechanism by which synaptic activity could differentially regulate GlyRs and GABAARs at mixed inhibitory synapses, we studied the phosphorylation of gephyrin at the regulatory site S270 (reviewed in Alvarez, 2017; Specht, 2020). We took advantage of the fact that the monoclonal antibody mAb7a specifically recognizes phosphorylated gephyrin (Kuhse et al, 2012). Hence, we examined how this post‐translational modification responded to neuronal activity changes.
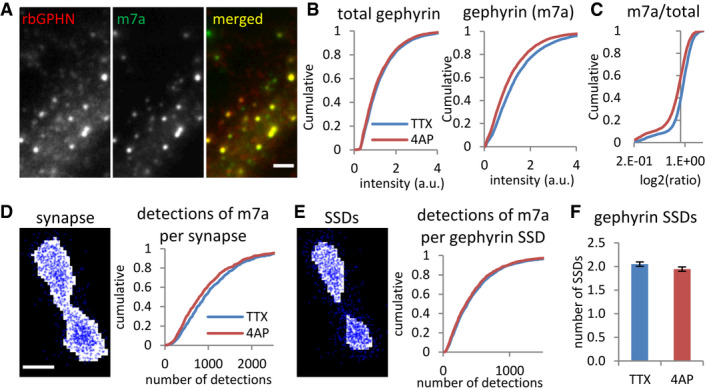
We first compared the amount of total gephyrin (probed by the polyclonal antibody rbGPHN) and of S270 phosphorylated gephyrin (probed by mAb7a) using conventional fluorescence microscopy (Fig 7A–C). The co‐localization of rbGPHN and mAb7a puncta did not differ between the TTX and 4‐AP conditions (Fig EV5A). Using a binary mask of rbGPHN clusters, we measured the fluorescence intensity of both rbGPHN and mAb7a signals at the same puncta. The fluorescence intensity of mAb7a but not rbGPHN was significantly decreased by 4‐AP treatment (Fig 7B, see also Fig EV3H). This was also true at individual synapses, as indicated by the fluorescence intensity ratio (Fig 7C). It should be noted that the difference between the TTX and the 4‐AP condition was observed consistently, whereas the non‐treated control condition showed some variability between experiments (Fig EV5C–E). The unchanged total number of gephyrin molecules at synapses suggests that the gephyrin scaffold persists during changes in network activity, while the S270 phosphorylation is dynamically regulated. We therefore explored the sub‐synaptic distribution of S270 phosphorylated gephyrin after 4‐AP treatment with dSTORM. The number of mAb7a detections per synapse was decreased by 4‐AP (Fig 7D), as expected from the reduction of mAb7a labeling seen with conventional fluorescence microscopy (Fig 7B). At the sub‐synaptic level, neither the number of detections of pS270 gephyrin (mAb7a) per SSD nor the number of SSDs was altered following 4‐AP treatment (Fig 7E and F). Moreover, the size of pS270 gephyrin SSDs did not change (Fig EV5B). It thus appears that pS270 gephyrin is concentrated within regions of the synaptic scaffold that are not affected by 4‐AP treatment, suggesting that S270 de‐phosphorylation occurs predominantly at gephyrin molecules located outside of these SSDs.
Figure 7. Reduction of gephyrin phosphorylation at synapses but not within SSDs by 4‐AP.
-
A–CReduced immunoreactivity of S270 phosphorylated gephyrin but not total gephyrin levels after 4‐AP treatment, revealed by conventional fluorescence microscopy (KS test, P < 0.001 in B1 and P < 0.0001 in B2, P < 0.0001 in C). Total gephyrin was probed with polyclonal rabbit primary antibody (rbGPHN), and pS270 phosphorylated gephyrin with monoclonal mouse primary antibody (m7a). Number of synapses: n = 4,040 in TTX and n = 3,818 in 4‐AP conditions from two independent experiments. Scale bar: 2 µm.
-
D–FReduced numbers of pS270 gephyrin (m7a) detections were recorded by dSTORM for the entire synaptic area (D, KS test, P < 0.01). The number of detections of pS270 gephyrin per SSD (E, KS test, P = 0.18) and the number of SSDs (F, MW test, P = 0.11) were not changed by 4‐AP treatment. Gephyrin was probed with mAb7a antibody and Alexa 647 dye. Number of synapses: n = 810 in TTX and n = 727 in 4‐AP conditions from three independent experiments; (F) mean ± SEM. Scale bar: 100 nm.
Source data are available online for this figure.
Discussion
The heterogeneity of synaptic protein distributions has been frequently observed using super‐resolution imaging with different techniques such as SMLM, STED, and SIM (MacGillavry et al, 2013; Nair et al, 2013; Specht et al, 2013; Pennacchietti et al, 2017; Wegner et al, 2018; Crosby et al, 2019). Sub‐synaptic domains (SSDs) have been defined as a sub‐compartment within the synaptic complex, in which the density of a given protein is higher than in the surrounding area (Yang & Specht, 2019). Here, we have shown that several components of mixed inhibitory synapses in spinal cord neurons form SSDs, including RIM1/2, gephyrin, GlyRs, and GABAARs.
To exclude that the inherent stochasticity of dSTORM imaging could be behind the observation of SSDs, we estimated the number of labeled receptors by taking into account the number of detections per secondary antibody in our experiments (Yang & Specht, 2020). According to these calculations, approximately 20 GABAARs and 29 GlyRs were detected at an average synapse, while the number of GABAARs per SSD was 5 and GlyRs 8. Although these values are lower than the absolute receptor copy numbers at synapses obtained by immuno‐EM, PALM‐based single‐molecule counting or cryo‐EM (Nusser et al, 1997; Patrizio et al, 2017; Liu et al, 2020), the efficiency of the immuno‐labeling nonetheless allows for an accurate structural description.
We found that pre‐synaptic RIM1/2 SSDs and post‐synaptic gephyrin SSDs are aligned in trans‐synaptic nanocolumns at mixed inhibitory synapses (Fig 8). This arrangement is similar to that observed at excitatory synapses, consisting of RIM1/2 and the post‐synaptic scaffold protein PSD‐95 (Tang et al, 2016). Moreover, GlyR SSDs and GABAAR SSDs were also aligned with RIM1/2. This suggests that GlyRs and GABAARs are integrated into inhibitory nanocolumns. Modeling predicts that the positioning of receptors in front of vesicle release sites can increase the efficacy of synaptic transmission at excitatory (MacGillavry et al, 2013; Haas et al, 2018) and at GABAergic inhibitory synapses (Pugh & Raman, 2005; Petrini et al, 2011). The alignment of GlyR and GABAAR SSDs with RIM1/2 may similarly ensure effective inhibitory neurotransmission at mixed inhibitory synapses and provide a means of regulation by slightly shifting receptors from their relative positions.
Figure 8. Differential regulation of GlyRs, GABAARs, and gephyrin at mixed inhibitory synapses.
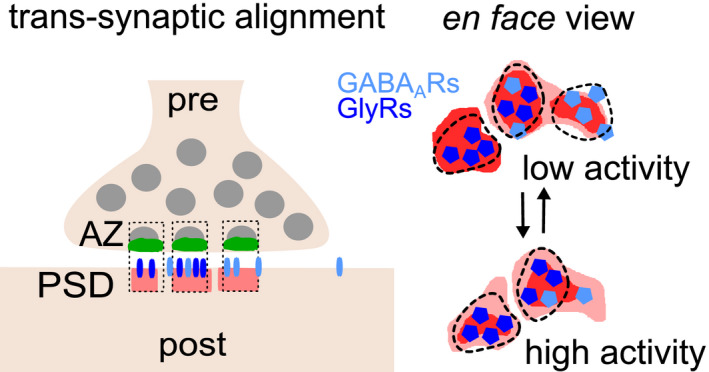
Left: Inhibitory GlyRs (dark blue), GABAARs (light blue), and gephyrin scaffolds (red) are organized in sub‐synaptic domains (SSD) and are aligned with pre‐synaptic release sites (green), forming trans‐synaptic nanocolumns (dotted boxes). Right: Increased network activity differentially affects the numbers of GABAAR complexes (light blue pentagons) and the phosphorylation status of gephyrin (phospho‐S270 domain, dark red), while GlyRs and total gephyrin levels are largely unaffected.
The measured distance between pre‐synaptic RIM1/2 and post‐synaptic GlyRs was slightly smaller than between RIM1/2 and GABAARs or gephyrin. This difference is likely due to the fact that GlyRs were labeled using antibodies against an extracellular epitope, whereas GABAARs were labeled at an intracellular epitope. The apparent distance of 28 nm between the extracellular and intracellular labeling is consistent with the longitudinal dimension of receptor complexes (~ 20 nm; Patriarchi et al, 2018) and the size of a single antibody (12–15 nm; Maidorn et al, 2016). This suggests that sequential immuno‐labeling with classical antibodies does not necessarily add cumulative lengths in distance measurements, possibly due to the random orientation of the antibodies.
At mixed inhibitory synapses, the apparent overlap of GlyR SSDs and GABAAR SSDs was surprisingly low, with an average of 30% of SSDs overlapping between the two channels (Fig 3E). An overlap of about 62% had been expected (0.79*0.78*100%), since both GlyRs and GABAARs were closely aligned with RIM1/2 SSDs (0.79 ± 0.04 and 0.78 ± 0.07, respectively; Fig 2). This apparent discrepancy can be attributed to several factors. Firstly, there was no selection of synapses in this experiment as opposed to Fig 2. Instead, the analysis was performed on hundreds of synapses regardless of whether they were seen in side view or en face. Second, the labeling of GlyRs at an extracellular epitope and of GABAARs at an intracellular epitope could increase the distance between the fluorophore detections in the two channels, thus lowering the apparent overlap (see above). Most importantly, antibody labeling, dSTORM imaging, and cluster analysis introduce a degree of stochasticity that can lead to an underestimation of the true level of co‐localization between synaptic components. However, a positive control experiment in which the same primary GlyR antibody was detected with two different secondary antibodies gave a much better level of overlap of about 65% (Fig 3E). It can therefore be concluded that the co‐localization between GlyRs and GABAARs is imperfect at the sub‐synaptic level, despite their overall correspondence at mixed inhibitory synapses (Fig 3C).
Taken together, our data demonstrate that GlyRs and GABAARs occupy distinct domains that overlap only partially (Fig 8). This pattern is reminiscent of the differential distribution of AMPARs and GluN2A or GluN2B‐containing NMDARs at excitatory synapses, where the nanoscale organization of the receptors regulates access to released glutamate (MacGillavry et al, 2013; Kellermayer et al, 2018). In the case of inhibitory receptors, the distribution of GlyR and GABAAR SSDs may have a similar impact on their activation depending on the alignment with vesicle release sites (e.g., Pugh & Raman, 2005; Petrini et al, 2011). However, the situation could be more complicated at mixed inhibitory synapses, since GlyRs and GABAARs are activated by different neurotransmitters, both of which are released from the same pre‐synaptic vesicles (Jonas et al, 1998; Aubrey & Supplisson, 2018). The relative vesicle load and binding affinity of the two neurotransmitters therefore add to the complexity resulting from the nanoscale organization that controls the distance of GlyRs and GABAARs to the release site. Furthermore, the organization of inhibitory receptor clusters appears to undergo developmental refinement, as suggested by the detection of mixed mIPSCs in young spinal cord neurons and purely glycinergic and GABAergic mIPSCs in more mature neurons (Keller et al, 2001).
It is generally accepted that gephyrin molecules are organized into a relatively stable lattice at inhibitory PSDs (Sola et al, 2004; Alvarez, 2017). We found that gephyrin SSDs contain high levels of phosphorylated gephyrin molecules (pS270), as judged using the phospho‐specific antibody mAb7a. SSDs of phosphorylated gephyrin have also been detected in previous studies (Pennacchietti et al, 2017; Crosby et al, 2019), suggesting that the ratio between total and phosphorylated pS270 gephyrin may be a key regulatory switch at inhibitory synapses (e.g., Lorenz‐Guertin et al, 2019; Niwa et al, 2019). Given that gephyrin phosphorylation was reduced in response to 4‐AP treatment without altering the total gephyrin levels, it is possible that pS270 gephyrin is concentrated within sub‐domains of the gephyrin scaffold at mixed inhibitory synapses (Fig 8). This is confirmed by the observation that the distribution of S270 in SSDs does not change with 4‐AP (Fig 7). In other words, the loss of pS270 signal appears to occur in regions of the PSD that do not form part of the SSDs. This interpretation is in line with the reduction in the size of synaptic pS270 clusters downstream of cAMP signaling via EPAC that did not alter the total levels of recombinant mEos4‐gephyrin at synapses (Niwa et al, 2019). The relative stability of gephyrin phosphorylation inside and out of SSDs may thus provide a potential mechanism for the differential regulation of GlyR and GABAAR clustering at mixed inhibitory synapses. However, it should be kept in mind that gephyrin is subject to multiple post‐translational modifications, meaning that the phosphorylation status of S270 is only one proxy for a variety of potentially overlapping signaling processes (Ghosh et al, 2016).
When network activity levels were altered, the nanoscale organization of GlyRs and GABAARs was differentially adjusted (Figs 5 and 6). While GABAAR clustering was reduced in response to higher activity after 4‐AP treatment, GlyRs remained largely unchanged. GlyR levels may be sustained by the gephyrin scaffold independently of changes of its phosphorylation status due to the high binding affinity of the GlyRβ subunit for gephyrin. In contrast, de‐phosphorylation of gephyrin outside of SSDs could be responsible for the reduction of GABAARs under 4‐AP (Fig 8). This is in agreement with the reduced GABAAR clustering downstream of gephyrin de‐phosphorylation induced by cAMP signaling (Niwa et al, 2019). Taken together, our results demonstrate that GlyRs and GABAARs are differentially regulated by gephyrin through different signaling pathways. The fact that GlyRs and GABAARs occupy distinct sub‐synaptic domains and are regulated by different signaling pathways provides a new angle for the understanding of co‐transmission at mixed inhibitory synapses in spinal cord neurons.
Materials and Methods
Primary spinal cord neuron culture
All procedures using animals follow the regulations of the French Ministry of Agriculture and the Direction départementale des services vétérinaires de Paris (Ecole Normale Supérieure, animalerie des rongeurs, license B 75‐05‐20). Primary spinal cord neurons were prepared from embryonic Sprague Dawley rats on embryonic day E14 as described (Specht et al, 2013), with some modifications. Dissociated neurons were plated on 18 mm glass coverslips (thickness 0.16 mm, No. 1.5, VWR #6310153) that were pre‐washed with ethanol and coated with 70 μg/ml poly‐dl‐ornithine. Cells were seeded at a density of 6 × 10⁴ cells/cm2 in Neurobasal medium (Thermo Fisher), supplemented with B‐27, 2 mM glutamine, and antibiotics (5 U/ml penicillin and 5 µg/ml streptomycin). Neurons were cultured at 37°C with 5% CO2, and the medium was replenished twice a week by replacing half of the volume with BrainPhys neuronal medium (Stemcell Technologies) supplemented with SM1 and antibiotics. Cells were used for experiments between DIV14 and DIV21.
Calcium imaging
Spinal cord neurons were loaded with 0.5 µM Fluo‐4 AM (F14201, Life Technologies) diluted in culture medium and incubated for 10 min. Cells were then imaged within pre‐warmed imaging medium, containing 130 mM NaCl, 5 mM KCl, 2 mM CaCl2, 1 mM MgCl2, 30 mM glucose, and 10 mM HEPES, pH 7.4. Time lapse recordings were acquired for 3 min at 10 Hz before and after application of TTX (1 µM), 4‐AP (50 µM), or strychnine (1 µM) and gabazine (5 µM). Background corrected calcium signals were measured in cell bodies using Fiji (Schindelin et al, 2012). The frequency and peak amplitude was detected using a custom written program (courtesy from Anastasia Ludwig) in Matlab (MathWorks).
Pharmacological treatment and immunocytochemistry
Cultured neurons were treated for 1 h with tetrodotoxin citrate (TTX, Cat. No. 1069, Tocris) or 4‐aminopyridine (4‐AP, Cat. No. 0940, Tocris), diluted in culture medium at a final concentration of 1 and 50 µM, respectively. The cultures were then fixed with 100% methanol at −20°C for 10 min. Unspecific binding sites were blocked with 3% BSA in PBS (blocking buffer) for at least 30 min. Cells were sequentially incubated for 1 h at room temperature with primary antibodies and with secondary antibodies diluted in blocking solution. Each step was followed by several washes with PBS.
The following primary antibodies were used: mouse monoclonal mAb7a (m7a, Synaptic Systems, #147011), rat monoclonal mAb7a (rb7a, Synaptic Systems, #147208), and rabbit polyclonal (rbGPHN, Synaptic Systems, #147002) antibodies against gephyrin; mouse monoclonal antibody against GABAAR β3 (UC Davis/NIH NeuroMab, #75‐149, RRID: AB_2109585), rabbit polyclonal antibody against RIM1/2 (Synaptic Systems, #140203), guinea pig polyclonal antibody against RIM1/2 (Synaptic Systems, #140205), and custom‐made rabbit polyclonal antibody against GlyR α1 (Triller lab, #2353). The primary antibodies were used at a dilution of 1:500, following the manufacturer's instructions. The following commercial secondary antibodies were used: Alexa Fluor 647‐conjugated donkey anti‐guinea pig IgG (Jackson ImmunoResearch, Cat. No. 706‐605‐148), donkey anti‐rabbit (Jackson, Cat. No. 711‐605‐152), donkey anti‐mouse (Jackson, Cat. No. 715‐605‐151), and goat anti‐rat IgG (Invitrogen, Cat. No. A21247); Cy3‐conjugated goat anti‐rabbit (Jackson, Cat. No. 111‐165‐144) and goat anti‐mouse IgG (Jackson, Cat. No. 115‐165‐166); Alexa 488‐conjugated goat anti‐mouse IgG (Jackson, Cat. No. 115‐545‐166). Secondary antibodies were diluted at 1:500 or 1:1,000, following the manufacturers' recommendations. Secondary antibodies that had been conjugated with Cy3B in our laboratory were diluted at 1:50 or 1:100 to compensate for the dilution during the purification process.
Conjugation of secondary antibodies with Cy3B dye
Unconjugated secondary antibodies, donkey anti‐mouse IgG (Jackson ImmunoResearch, #715‐005‐151), donkey anti‐rabbit IgG (Jackson ImmunoResearch, #711‐005‐152), and donkey anti‐guinea pig IgG (Jackson ImmunoResearch, #706‐005‐148) were coupled with Cy3B mono‐reactive NHS ester (PA63101, GE Healthcare) according to the supplier's protocol. Antibodies were then purified using size exclusion columns (Illustra NAP‐5 columns, #17085302, GE Healthcare). The absorption of IgG at 280 nm and Cy3B dye at 559 nm of the reaction products was measured by spectrophotometry (NanoDrop ND‐1000 Spectrophotometer), from which the number of dyes per IgG was calculated. The estimated dye/IgG ratio was generally between 3 and 5.
Cryosection preparation and immunohistochemistry
Adult male mice (C57BL/6J, 10 weeks old) were deeply anesthetized with pentobarbital and intracardially perfused with 4% PFA and 0.1% glutaraldehyde in PBS. The cervical to thoracic spinal cord segments was dissected and post‐fixed in 4% PFA at 4°C overnight. The segments were then cut into 1 mm3 cubes and incubated in 2.3 M sucrose at 4°C for 2–3 days. The tissue was then cut into sections of 2 µm thickness with an ultra‐microtome (Leica EM UC6). Sections were placed on glass coverslips for immunohistochemistry.
Sucrose impregnated cryosections were first subjected to a heat‐induced antigen retrieval (HIAR) protocol (Rousseau et al, 2012). Briefly, sections were immersed in a citrate‐based antigen retrieval buffer and placed in a de‐cloaking chamber (Biocare Medical) for 20 min at 110°C. They were then treated with 15% methanol and 0.3% H2O2 in PBS for 15 min, followed by 1% sodium borohydride in PBS for 45 min. Sections were thoroughly rinsed with PBS after each step. Unspecific binding sites were blocked with 3% BSA in PBS at room temperature for at least 2 h. Primary antibodies, including rabbit polyclonal antibody against RIM1/2 and mouse monoclonal mAb7a, were diluted in blocking buffer and applied overnight at 4°C. Sections were then incubated with Alexa 647‐conjugated donkey anti‐rabbit IgG (Jackson ImmunoResearch, Cat. No. 711‐605‐152, dilution 1:500) and laboratory‐made Cy3B‐conjugated donkey anti‐mouse secondary antibodies (dilution 1:100) for 2 h at room temperature.
Conventional fluorescence microscopy and image analysis
After immuno‐labeling, coverslips were mounted in an open chamber in PBS. Images were acquired on an inverted Nikon Eclipse Ti microscope, equipped with a 100× oil immersion objective (HP APO TIRF 100× oil, NA 1.49, Nikon). A mercury lamp (Intensilight C‐HGFIE, Nikon) was used for illumination, with specific band pass filters for the far‐red (excitation FF01‐650/13, emission FF02‐684/24, Semrock), red (ex. FF01‐560/25, em. FF01‐607/36), and green channels (ex. FF02‐485/20, em. FF01‐525/30). Ten image frames of 100 or 200 ms exposure (depending on the channel) were recorded for each field of view. For a given set of experiments, all imaging parameters were kept constant between all experimental conditions. The stacks of images were combined by average projection of the 10 frames in Fiji. Binary masks were then produced from the gephyrin immuno‐labeling using the wavelet function in Icy (de Chaumont et al, 2012), to measure the intensities of all the different labeled proteins within the synaptic cluster. The integrated intensity within the binary masks was determined using a laboratory‐made program (Hennekinne et al, 2013) written in Matlab.
Sequential two‐color dSTORM imaging
The dSTORM setup is built on the same Nikon Ti microscope described above. It includes several continuous laser lines with emission wavelengths at 640, 561, and 405 nm (Coherent) with nominal maximum power of 1 W, 1 W, and 120 mW, respectively. The setup is equipped with a total internal reflection fluorescence (TIRF) arm to set the angle of the illumination laser, an acousto‐optic tunable filter (AOTF) to control the intensity of the lasers, a perfect focusing system (PFS) to maintain the focal plane during imaging, and an electron‐multiplying charge‐coupled device (EMCCD) camera (Andor iXon Ultra) for image acquisition. All elements of the microscope are controlled by NIS‐Elements software (Nikon). The dSTORM recordings were taken at a magnification of 100x, resulting in image pixel size of 160 nm.
On the day of imaging, immuno‐labeled neurons on glass coverslips were incubated with 100 nm beads (TetraSpeck, Thermo Fisher, Cat. No. T7279) and mounted on glass slides with a cavity (diameter 15–18 mm, depth 0.6–0.8 mm) containing freshly prepared Gloxy imaging buffer (0.5 mg/ml glucose oxidase, 40 μg/ml catalase, 0.5 M d‐glucose, 50 mM β‐mercaptoethylamine (MEA) in PBS, pH 7.4, degassed with nitrogen). The coverslips were sealed with silicone rubber (Picodent twinsil speed 22), and the slide was mounted on the microscope. Prior to dSTORM recordings, conventional epifluorescence images of each field of view were taken with the mercury lamp (Fig EV2A1–D1). These epifluorescence images were used as reference during the dSTORM data processing. Sequential two‐color dSTORM imaging was then carried out first in the far‐red channel (Alexa 647), followed by the red channel (Cy3B). No UV light was applied during the recording of Alexa 647, and however, the blinking of Cy3B was supported by low‐intensity 405 nm laser illumination. Highly inclined illumination was used to reduce the background fluorescence. Recordings of 20,000 or 30,000 frames with an exposure time of 50 ms per frame were acquired. The frame numbers were kept constant for each set of experiments. For single‐color dSTORM imaging, only the signals of Alexa 647 in the far‐red channel were collected.
dSTORM data processing
Processing steps of the imaging data included single‐particle detection, lateral drift correction, two‐channel registration, and image reconstruction (Yang & Specht, 2020). Single‐particle detection was realized by applying Gaussian fitting to the PSF of each fluorophore signal, using an adapted version of the multiple‐target tracing (MTT) program (Serge et al, 2008) in Matlab. We obtained a localization precision of 6 ± 3 nm for Alexa 647 signals, and 7 ± 2 nm for Cy3B, by the approximation of ∆/√N, where ∆ is the full width at half‐maximum (FWHM) of the point spread function (PSF) and N is the number of collected photons. Lateral drift was corrected in the Matlab program PALMvis (Lelek et al, 2012) using beads as fiducial markers. At this stage, we obtained the coordinate‐based localization data in both channels (Fig EV2A2–D2). The drift‐corrected coordinates were then rendered into super‐resolution dSTORM images (pixel size 10 nm) by representing each localization as a Gaussian function with a standard deviation σ = 15 nm (Fig EV2A3–D3). Image rendering was done either with PALMvis to obtain a well‐defined structural representation or with LAMA software (Malkusch & Heilemann, 2016) if a consistent representation of detection numbers was required.
SSD segmentation and feature extraction
To define the regions of interest (mixed inhibitory synapses), individual synaptic clusters were cropped from the rendered images using binary masks produced from the epifluorescence images. SSDs were segmented from these individual synaptic clusters using the H‐watershed plugin developed by Benoit Lombardot (http://imagej.net/Interactive_Watershed) in Fiji. The SSD counts per synaptic cluster and SSD area were extracted using extended particle analyzer (Brocher, 2014) in Fiji.
Quantification of trans‐synaptic SSD distances and alignment
Rendered dSTORM images of the two proteins of interest were composed and transformed to RGB format in Fiji. SSD distances and alignment were only measured in synapses seen in cross section. We manually selected these side views following the following criteria: clusters showing obvious elongated shapes in both channels, or synapses with elongated shapes in only one of the two channels and with clear signals in the other channel. After SSD segmentation, the paired SSDs of two different proteins were identified. In the RGB images, a line was drawn through the intensity peaks of the paired SSDs and the distance between the peaks was taken as SSD distance. When there was more than one pair of SSDs per synapse, the average of all measured distances was taken as SSD distance for that synapse. Paired SSDs of pre‐synaptic and post‐synaptic proteins were counted manually. For each protein, the degree of alignment was calculated as the number of paired SSDs divided by the total number of SSDs for that protein, values expressed on a scale from 0 to 1 (fraction of aligned SSDs).
Intensity correlation analysis
Reconstructed images of corresponding GlyR and GABAAR clusters of individual synapses were loaded in ImageJ. ICA was performed with the JACoP plugin (Bolte & Cordelières, 2006) to determine intensity correlation quotients (ICQ; Li et al, 2004).
Quantification of the fraction of overlapping SSDs
The analysis was done in Fiji using binary images of segmented GlyR and GABAAR SSDs for each synapse. The number of SSDs overlapping by at least one pixel was divided by the total number of SSDs in each channel (only clusters with ≥ 2 SSDs).
Distance measurements between GlyR and GABAAR SSDs at the same PSD
Binary images of segmented GlyR and GABAAR SSDs were opened in ImageJ. The distances between the geometric centers of the neighboring GlyR and GABAAR SSDs were calculated by the object‐based methods implemented in the JACoP plugin (Bolte & Cordelières, 2006). Only the nearest pairs of GlyR and GABAAR SSDs were included for distance measurements.
Counting dSTORM detections per synapse and per SSD
To obtain the binary masks of synaptic area, the rendered images from the two dSTORM channels generated with LAMA software were combined and binarized without thresholding. For one‐color dSTORM, the rendered images were binarized directly to obtain synaptic masks. Binary SSD images were produced with the H‐watershed plugin in Fiji. The detection coordinates were then overlaid with the binary images and detections within the synaptic masks or SSDs were counted using the pickpointsSR program (courtesy from Marianne Renner, IFM, Paris) written in Matlab (Fig EV2A4–D4).
Statistics
Data were first tested for normality with the D'Agostino & Pearson normality test. Where the data passed the normality test, the analysis was done with Student's t‐test or one‐way ANOVA followed by Tukey's post hoc test. Where the data were not normally distributed, statistical analysis was generally done using the non‐parametric Mann–Whitney U‐test (MW), Kolmogorov–Smirnov test (KS), multi‐comparison Kruskal–Wallis test (KW) for unpaired data and Friedman test for paired data, followed by Dunn's post hoc multiple comparison test (in Fig EV3C and D). Correlation statistics was done with the Spearman method. Data are represented as bar graphs showing the mean ± SD or mean ± SEM as stated, the median and the quartiles of the distribution (in Figs 3E and EV3C and D), or in the form of cumulative probability distributions.
Author contributions
XY, PL, AT, and CGS planned the experiments; XY performed the experiments; HLC and PL performed unpublished control experiments; XY, PL, and CGS analyzed the data; XY and CGS wrote the manuscript; all authors read and approved the manuscript.
Conflict of interest
The authors declare that they have no conflict of interest.
Supporting information
Expanded View Figures PDF
Source Data for Expanded View
Review Process File
Source Data for Figure 1
Source Data for Figure 2
Source Data for Figure 3
Source Data for Figure 4
Source Data for Figure 5
Source Data for Figure 6
Source Data for Figure 7
Acknowledgements
We thank Marianne Renner for providing the pickpointsSR program, Philippe Rostaing and Oliver Gemin for preparing cryosections, Felipe Delestro and Auguste Genovesio for technical support in data analysis. Funding was provided by the European Research Council (ERC, Plastinhib), Agence Nationale de la Recherche (ANR, Synaptune, and Syntrack), Labex (Memolife), and France‐BioImaging (FBI). XY was supported by the China Scholarship Council.
EMBO reports (2021) 22: e52154.
Contributor Information
Antoine Triller, Email: antoine.triller@ens.psl.eu.
Christian G Specht, Email: christian.specht@inserm.fr.
Data availability
The raw imaging data of this publication have been deposited in the Zenodo database (https://zenodo.org) and assigned the unique identifier https://doi.org/10.5281/zenodo.4545025.
References
- Alvarez FJ (2017) Gephyrin and the regulation of synaptic strength and dynamics at glycinergic inhibitory synapses. Brain Res Bull 129: 50–65 [DOI] [PubMed] [Google Scholar]
- Aubrey KR, Supplisson S (2018) Heterogeneous signaling at GABA and glycine co‐releasing terminals. Front Synaptic Neurosci 10: 40 [DOI] [PMC free article] [PubMed] [Google Scholar]
- Bolte S, Cordelières FP (2006) A guided tour into subcellular colocalization analysis in light microscopy. J Microsc 224: 213–232 [DOI] [PubMed] [Google Scholar]
- Brocher J (2014) Qualitative and quantitative evaluation of two new histogram limiting binarization algorithms. Int J Image Process 8: 30–48 [Google Scholar]
- Cantaut‐Belarif Y, Antri M, Pizzarelli R, Colasse S, Vaccari I, Soares S, Renner M, Dallel R, Triller A, Bessis A (2017) Microglia control the glycinergic but not the GABAergic synapses via prostaglandin E2 in the spinal cord. J Cell Biol 216: 2979–2989 [DOI] [PMC free article] [PubMed] [Google Scholar]
- Chery N, de Koninck Y (1999) Junctional versus extrajunctional glycine and GABA(A) receptor‐mediated IPSCs in identified lamina I neurons of the adult rat spinal cord. J Neurosci 19: 7342–7355 [DOI] [PMC free article] [PubMed] [Google Scholar]
- Crosby KC, Gookin SE, Garcia JD, Hahm KM, Dell'Acqua ML, Smith KR (2019) Nanoscale subsynaptic domains underlie the organization of the inhibitory synapse. Cell Rep 26: 3284–3297.e3283 [DOI] [PMC free article] [PubMed] [Google Scholar]
- Dani A, Huang B, Bergan J, Dulac C, Zhuang X (2010) Superresolution imaging of chemical synapses in the brain. Neuron 68: 843–856 [DOI] [PMC free article] [PubMed] [Google Scholar]
- de Chaumont F, Dallongeville S, Chenouard N, Hervé N, Pop S, Provoost T, Meas‐Yedid V, Pankajakshan P, Lecomte T, Le Montagner Y et al (2012) Icy: an open bioimage informatics platform for extended reproducible research. Nat Methods 9: 690–696 [DOI] [PubMed] [Google Scholar]
- Dempsey GT, Vaughan JC, Chen KH, Bates M, Zhuang X (2011) Evaluation of fluorophores for optimal performance in localization‐based super‐resolution imaging. Nat Methods 8: 1027–1036 [DOI] [PMC free article] [PubMed] [Google Scholar]
- Dumoulin A, Levi S, Riveau B, Gasnier B, Triller A (2000) Formation of mixed glycine and GABAergic synapses in cultured spinal cord neurons. Eur J Neurosci 12: 3883–3892 [DOI] [PubMed] [Google Scholar]
- Ghosh H, Auguadri L, Battaglia S, Simone Thirouin Z, Zemoura K, Messner S, Acuña MA, Wildner H, Yévenes GE, Dieter A et al (2016) Several posttranslational modifications act in concert to regulate gephyrin scaffolding and GABAergic transmission. Nat Commun 7: 13365 [DOI] [PMC free article] [PubMed] [Google Scholar]
- Haas KT, Compans B, Letellier M, Bartol TM, Grillo‐Bosch D, Sejnowski TJ, Sainlos M, Choquet D, Thoumine O, Hosy E (2018) Pre‐post synaptic alignment through neuroligin‐1 tunes synaptic transmission efficiency. Elife 7: e31755 [DOI] [PMC free article] [PubMed] [Google Scholar]
- Hennekinne L, Colasse S, Triller A, Renner M (2013) Differential control of thrombospondin over synaptic glycine and AMPA receptors in spinal cord neurons. J Neurosci 33: 11432–11439 [DOI] [PMC free article] [PubMed] [Google Scholar]
- Jonas P, Bischofberger J, Sandkuhler J (1998) Corelease of two fast neurotransmitters at a central synapse. Science 281: 419–424 [DOI] [PubMed] [Google Scholar]
- Kalbouneh H, Schlicksupp A, Kirsch J, Kuhse J (2014) Cyclin‐dependent kinase 5 is involved in the phosphorylation of gephyrin and clustering of GABAA receptors at inhibitory synapses of hippocampal neurons. PLoS One 9: e104256 [DOI] [PMC free article] [PubMed] [Google Scholar]
- Keller AF, Coull JA, Chery N, Poisbeau P, De Koninck Y (2001) Region‐specific developmental specialization of GABA‐glycine cosynapses in laminas I‐II of the rat spinal dorsal horn. J Neurosci 21: 7871–7880 [DOI] [PMC free article] [PubMed] [Google Scholar]
- Kellermayer B, Ferreira JS, Dupuis J, Levet F, Grillo‐Bosch D, Bard L, Linarès‐Loyez J, Bouchet D, Choquet D, Rusakov DA et al (2018) Differential nanoscale topography and functional role of GluN2‐NMDA receptor subtypes at glutamatergic synapses. Neuron 100: 106–119.e107 [DOI] [PubMed] [Google Scholar]
- Kneussel M, Betz H (2000) Clustering of inhibitory neurotransmitter receptors at developing postsynaptic sites: the membrane activation model. Trends Neurosci 23: 429–435 [DOI] [PubMed] [Google Scholar]
- Kuhse J, Kalbouneh H, Schlicksupp A, Mukusch S, Nawrotzki R, Kirsch J (2012) Phosphorylation of gephyrin in hippocampal neurons by cyclin‐dependent kinase CDK5 at Ser‐270 is dependent on collybistin. J Biol Chem 287: 30952–30966 [DOI] [PMC free article] [PubMed] [Google Scholar]
- Legendre P (2001) The glycinergic inhibitory synapse. Cell Mol Life Sci 58: 760–793 [DOI] [PMC free article] [PubMed] [Google Scholar]
- Lelek M, Di Nunzio F, Henriques R, Charneau P, Arhel N, Zimmer C (2012) Superresolution imaging of HIV in infected cells with FlAsH‐PALM. Proc Natl Acad Sci USA 109: 8564–8569 [DOI] [PMC free article] [PubMed] [Google Scholar]
- Levi S, Schweizer C, Bannai H, Pascual O, Charrier C, Triller A (2008) Homeostatic regulation of synaptic GlyR numbers driven by lateral diffusion. Neuron 59: 261–273 [DOI] [PubMed] [Google Scholar]
- Li Q, Lau A, Morris TJ, Guo L, Fordyce CB, Stanley EF (2004) A syntaxin 1, Galpha(o), and N‐type calcium channel complex at a presynaptic nerve terminal: analysis by quantitative immunocolocalization. J Neurosci 24: 4070–4081 [DOI] [PMC free article] [PubMed] [Google Scholar]
- van de Linde S, Löschberger A, Klein T, Heidbreder M, Wolter S, Heilemann M, Sauer M (2011) Direct stochastic optical reconstruction microscopy with standard fluorescent probes. Nat Protoc 6: 991–1009 [DOI] [PubMed] [Google Scholar]
- Liu YT, Tao CL, Zhang X, Xia W, Shi DQ, Qi L, Xu C, Sun R, Li XW, Lau PM et al (2020) Mesophasic organization of GABA(A) receptors in hippocampal inhibitory synapses. Nat Neurosci 23: 1589–1596 [DOI] [PMC free article] [PubMed] [Google Scholar]
- Lorenz‐Guertin JM, Bambino MJ, Das S, Weintraub ST, Jacob TC (2019) Diazepam accelerates GABAAR synaptic exchange and alters intracellular trafficking. Front Cell Neurosci 13: 163 [DOI] [PMC free article] [PubMed] [Google Scholar]
- MacGillavry HD, Song Y, Raghavachari S, Blanpied Thomas A (2013) Nanoscale scaffolding domains within the postsynaptic density concentrate synaptic AMPA receptors. Neuron 78: 615–622 [DOI] [PMC free article] [PubMed] [Google Scholar]
- Maidorn M, Rizzoli SO, Opazo F (2016) Tools and limitations to study the molecular composition of synapses by fluorescence microscopy. Biochem J 473: 3385–3399 [DOI] [PubMed] [Google Scholar]
- Malkusch S, Heilemann M (2016) Extracting quantitative information from single‐molecule super‐resolution imaging data with LAMA ‐ LocAlization Microscopy Analyzer. Sci Rep 6: 34486 [DOI] [PMC free article] [PubMed] [Google Scholar]
- Maric HM, Mukherjee J, Tretter V, Moss SJ, Schindelin H (2011) Gephyrin‐mediated γ‐aminobutyric acid type A and glycine receptor clustering relies on a common binding site. J Biol Chem 286: 42105–42114 [DOI] [PMC free article] [PubMed] [Google Scholar]
- Nair D, Hosy E, Petersen JD, Constals A, Giannone G, Choquet D, Sibarita JB (2013) Super‐resolution imaging reveals that AMPA receptors inside synapses are dynamically organized in nanodomains regulated by PSD95. J Neurosci 33: 13204–13224 [DOI] [PMC free article] [PubMed] [Google Scholar]
- Niwa F, Patrizio A, Triller A, Specht CG (2019) cAMP‐EPAC‐dependent regulation of gephyrin phosphorylation and GABAAR trapping at inhibitory synapses. iScience 22: 453–465 [DOI] [PMC free article] [PubMed] [Google Scholar]
- Nusser Z, Cull‐Candy S, Farrant M (1997) Differences in synaptic GABA(A) receptor number underlie variation in GABA mini amplitude. Neuron 19: 697–709 [DOI] [PubMed] [Google Scholar]
- O'Brien JA, Berger AJ (2001) The nonuniform distribution of the GABA(A) receptor alpha 1 subunit influences inhibitory synaptic transmission to motoneurons within a motor nucleus. J Neurosci 21: 8482–8494 [DOI] [PMC free article] [PubMed] [Google Scholar]
- Patriarchi T, Buonarati OR, Hell JW (2018) Postsynaptic localization and regulation of AMPA receptors and Cav1.2 by β2 adrenergic receptor/PKA and Ca(2+)/CaMKII signaling. EMBO J 37: e99771 [DOI] [PMC free article] [PubMed] [Google Scholar]
- Patrizio A, Renner M, Pizzarelli R, Triller A, Specht CG (2017) Alpha subunit‐dependent glycine receptor clustering and regulation of synaptic receptor numbers. Sci Rep 7: 10899 [DOI] [PMC free article] [PubMed] [Google Scholar]
- Pennacchietti F, Vascon S, Nieus T, Rosillo C, Das S, Tyagarajan SK, Diaspro A, Del Bue A, Petrini EM, Barberis A et al (2017) Nanoscale molecular reorganization of the inhibitory postsynaptic density is a determinant of GABAergic synaptic potentiation. J Neurosci 37: 1747–1756 [DOI] [PMC free article] [PubMed] [Google Scholar]
- Petrini EM, Nieus T, Ravasenga T, Succol F, Guazzi S, Benfenati F, Barberis A (2011) Influence of GABAAR monoliganded states on GABAergic responses. J Neurosci 31: 1752–1761 [DOI] [PMC free article] [PubMed] [Google Scholar]
- Pugh JR, Raman IM (2005) GABAA receptor kinetics in the cerebellar nuclei: evidence for detection of transmitter from distant release sites. Biophys J 88: 1740–1754 [DOI] [PMC free article] [PubMed] [Google Scholar]
- Rousseau CV, Dugué GP, Dumoulin A, Mugnaini E, Dieudonné S, Diana MA (2012) Mixed inhibitory synaptic balance correlates with glutamatergic synaptic phenotype in cerebellar unipolar brush cells. J Neurosci 32: 4632–4644 [DOI] [PMC free article] [PubMed] [Google Scholar]
- Saiyed T, Paarmann I, Schmitt B, Haeger S, Sola M, Schmalzing G, Weissenhorn W, Betz H (2007) Molecular basis of gephyrin clustering at inhibitory synapses: role of G‐ and E‐domain interactions. J Biol Chem 282: 5625–5632 [DOI] [PubMed] [Google Scholar]
- Schindelin J, Arganda‐Carreras I, Frise E, Kaynig V, Longair M, Pietzsch T, Preibisch S, Rueden C, Saalfeld S, Schmid B et al (2012) Fiji: an open‐source platform for biological‐image analysis. Nat Methods 9: 676–682 [DOI] [PMC free article] [PubMed] [Google Scholar]
- Schrader N, Kim EY, Winking J, Paulukat J, Schindelin H, Schwarz G (2004) Biochemical characterization of the high affinity binding between the glycine receptor and gephyrin. J Biol Chem 279: 18733–18741 [DOI] [PubMed] [Google Scholar]
- Serge A, Bertaux N, Rigneault H, Marguet D (2008) Dynamic multiple‐target tracing to probe spatiotemporal cartography of cell membranes. Nat Methods 5: 687–694 [DOI] [PubMed] [Google Scholar]
- Sola M, Bavro VN, Timmins J, Franz T, Ricard‐Blum S, Schoehn G, Ruigrok RWH, Paarmann I, Saiyed T, O'Sullivan GA et al (2004) Structural basis of dynamic glycine receptor clustering by gephyrin. EMBO J 23: 2510–2519 [DOI] [PMC free article] [PubMed] [Google Scholar]
- Specht CG, Izeddin I, Rodriguez PC, El Beheiry M, Rostaing P, Darzacq X, Dahan M, Triller A (2013) Quantitative nanoscopy of inhibitory synapses: counting gephyrin molecules and receptor binding sites. Neuron 79: 308–321 [DOI] [PubMed] [Google Scholar]
- Specht CG (2020) Fractional occupancy of synaptic binding sites and the molecular plasticity of inhibitory synapses. Neuropharmacology 169: 107493 [DOI] [PubMed] [Google Scholar]
- Tang AH, Chen H, Li TP, Metzbower SR, MacGillavry HD, Blanpied TA (2016) A trans‐synaptic nanocolumn aligns neurotransmitter release to receptors. Nature 536: 210–214 [DOI] [PMC free article] [PubMed] [Google Scholar]
- Todd AJ, Watt C, Spike RC, Sieghart W (1996) Colocalization of GABA, glycine, and their receptors at synapses in the rat spinal cord. J Neurosci 16: 974–982 [DOI] [PMC free article] [PubMed] [Google Scholar]
- Tretter V, Mukherjee J, Maric HM, Schindelin H, Sieghart W, Moss SJ (2012) Gephyrin, the enigmatic organizer at GABAergic synapses. Front Cell Neurosci 6: 23 [DOI] [PMC free article] [PubMed] [Google Scholar]
- Triller A, Cluzeaud F, Korn H (1987) gamma‐Aminobutyric acid‐containing terminals can be apposed to glycine receptors at central synapses. J Cell Biol 104: 947–956 [DOI] [PMC free article] [PubMed] [Google Scholar]
- Tyagarajan SK, Ghosh H, Yevenes GE, Nikonenko I, Ebeling C, Schwerdel C, Sidler C, Zeilhofer HU, Gerrits B, Muller D et al (2011) Regulation of GABAergic synapse formation and plasticity by GSK3beta‐dependent phosphorylation of gephyrin. Proc Natl Acad Sci USA 108: 379–384 [DOI] [PMC free article] [PubMed] [Google Scholar]
- Tyagarajan SK, Ghosh H, Yevenes GE, Imanishi SY, Zeilhofer HU, Gerrits B, Fritschy JM (2013) Extracellular signal‐regulated kinase and glycogen synthase kinase 3beta regulate gephyrin postsynaptic aggregation and GABAergic synaptic function in a calpain‐dependent mechanism. J Biol Chem 288: 9634–9647 [DOI] [PMC free article] [PubMed] [Google Scholar]
- Wegner W, Mott AC, Grant SGN, Steffens H, Willig KI (2018) In vivo STED microscopy visualizes PSD95 sub‐structures and morphological changes over several hours in the mouse visual cortex. Sci Rep 8: 219 [DOI] [PMC free article] [PubMed] [Google Scholar]
- Yang X, Specht CG (2019) Subsynaptic domains in super‐resolution microscopy: the treachery of images. Front Mol Neurosci 12: 161 [DOI] [PMC free article] [PubMed] [Google Scholar]
- Yang X, Specht CG (2020) Practical guidelines for two‐color SMLM of synaptic proteins in cultured neurons. In Single Molecule Microscopy in Neurobiology, Okada Y, Yamamoto N (eds), pp 173–202. New York, NY: Springer; [Google Scholar]
Associated Data
This section collects any data citations, data availability statements, or supplementary materials included in this article.
Supplementary Materials
Expanded View Figures PDF
Source Data for Expanded View
Review Process File
Source Data for Figure 1
Source Data for Figure 2
Source Data for Figure 3
Source Data for Figure 4
Source Data for Figure 5
Source Data for Figure 6
Source Data for Figure 7
Data Availability Statement
The raw imaging data of this publication have been deposited in the Zenodo database (https://zenodo.org) and assigned the unique identifier https://doi.org/10.5281/zenodo.4545025.


