Abstract
PIWI‐interacting RNAs (piRNAs) guide PIWI proteins to silence transposable elements and safeguard fertility in germ cells. Many protein factors required for piRNA biogenesis localize to perinuclear ribonucleoprotein (RNP) condensates named nuage, where target silencing and piRNA amplification are thought to occur. In mice, some of the piRNA factors are found in discrete cytoplasmic foci called processing bodies (P‐bodies). However, the dynamics and biological significance of such compartmentalization of the piRNA pathway remain unclear. Here, by analyzing the subcellular localization of functional mutants of piRNA factors, we show that piRNA factors are actively compartmentalized into nuage and P‐bodies in silkworm cells. Proper demixing of nuage and P‐bodies requires target cleavage by the PIWI protein Siwi and ATP hydrolysis by the DEAD‐box helicase BmVasa, disruption of which leads to promiscuous overproduction of piRNAs deriving from non‐transposable elements. Our study highlights a role of dynamic subcellular compartmentalization in ensuring the fidelity of piRNA biogenesis.
Keywords: compartmentalization, nuage, P‐body, piRNA
Subject Categories: RNA Biology
P‐bodies in silkworm cells harbor key piRNA factors. Dynamic exchange of piRNA factors between nuage and P‐bodies is impaired by ectopic expression of a Siwi catalytic mutant, which leads to aberrant production of mRNA‐derived piRNAs.

Introduction
In animal germ cells, ~ 24–31‐nt small RNAs termed PIWI‐interacting RNAs (piRNAs) program PIWI proteins and induce silencing of target genes (Ozata et al, 2019). The majority of piRNAs are complementary to transposable elements (TEs) and play a central role in transposon silencing and germ cell development (Siomi et al, 2011; Weick & Miska, 2014; Ozata et al, 2019). While some nuclear PIWIs silence gene expression at the transcriptional level, many PIWI proteins are cytoplasmic and cleave target RNAs with their endonucleolytic (slicer) activity (Siomi et al, 2011; Ozata et al, 2019). These cytoplasmic PIWI proteins are often localized in germline‐specific membrane‐less organelles termed nuage (Eddy, 1974, 1975; Lim & Kai, 2007; Aravin et al, 2009; Shoji et al, 2009; Patil & Kai, 2010).
Studies in model animals including fruit flies, mice, and silkworms suggested that nuage is a site for a feed‐forward piRNA amplification pathway called the ping‐pong cycle (Brennecke et al, 2007; Gunawardane et al, 2007; Aravin et al, 2008; Kawaoka et al, 2009). This pathway requires at least two PIWI proteins and couples target cleavage to piRNA biogenesis by handing the 3′ cleavage product of a piRNA‐loaded PIWI protein to a counterpart PIWI protein (Brennecke et al, 2007; Gunawardane et al, 2007). The handing process, albeit elusive, is thought to be aided by nuage core proteins, including the DEAD‐box helicase Vasa and a list of Tudor domain‐containing proteins (Lim & Kai, 2007; Malone et al, 2009; Xiol et al, 2014).
Besides nuage, the outer membrane of mitochondria is another important site for piRNA biogenesis. Zucchini and Trimmer, the nucleases required for processing long piRNA precursors into mature piRNAs, are localized on the mitochondrial surface (Choi et al, 2006; Saito et al, 2010; Han et al, 2015; Mohn et al, 2015; Izumi et al, 2016, 2020). Nuage is often found cemented between mitochondria within the perinuclear region and is thus also called intermitochondrial cement in mice, and yet they are distinguishable from each other. Therefore, highly organized communication between these cytoplasmic compartments is likely necessary for proper piRNA biogenesis and function (Aravin et al, 2009; Shoji et al, 2009; Huang et al, 2014; Ge et al, 2019; Ishizu et al, 2019). Indeed, the RNA helicase Armitage is known to shuttle between nuage and mitochondria, facilitating stepwise RNA processing within these two compartments in fly ovaries (Ge et al, 2019; Ishizu et al, 2019).
Processing bodies (P‐bodies) are membrane‐less ribonucleoprotein (RNP) condensates which contain factors related to mRNA degradation and microRNA (miRNA) pathways (Decker & Parker, 2012; Luo et al, 2018). In mouse gonocytes, P‐bodies are also implicated in the piRNA pathway (Aravin et al, 2009). These gonocytes express two PIWI proteins: MILI and MIWI2. MILI localizes to intermitochondrial cement or pi‐bodies, which clump between mitochondria just like nuage in other species (Aravin et al, 2009). The other PIWI protein MIWI2 is accumulated in distinct cytoplasmic condensates, named piP‐bodies, together with canonical P‐body proteins including the mRNA decapping enzyme DCP1a, ATP‐dependent helicase DDX6 and scaffold protein TNRC6 (Aravin et al, 2009). Given that the production of MIWI2‐piRNAs requires the target cleavage by MILI‐piRNAs (Aravin et al, 2008; Fazio et al, 2011; Manakov et al, 2015), functional crosstalk between pi‐bodies and piP‐bodies must fuel the ping‐pong cycle in mice. However, this functional crosstalk was not found in Drosophila melanogaster, the most well‐studied piRNA model, and as a result, how piP‐bodies contribute to piRNA biogenesis has remained unclear.
Bombyx mori (silkworm) ovary‐derived BmN4 is one of the few cell‐lines which harbor a fully functional ping‐pong cycle (Kawaoka et al, 2009). To date, several nuage piRNA factors have been characterized in BmN4, namely the two PIWI clade proteins Siwi and BmAgo3 (Kawaoka et al, 2009), DEAD‐box helicase BmVasa (Xiol et al, 2014) and Tudor domain‐containing proteins BmSpnE and BmQin (Nishida et al, 2015). A previous study has reported that wild‐type BmVasa immunoprecipitates exclude the BmSpnE/BmQin heterodimer and vice versa, despite that both interact with Siwi (Nishida et al, 2015). This observation suggested that, in BmN4, Siwi is actively partitioned into the two distinct complexes. However, the mechanism and significance of this partitioning have remained unclear. Here, by using live cell imaging, we comprehensively characterized the localization of silkworm piRNA factors and defined “piP‐bodies” in BmN4 cells, where BmVasa is excluded but the BmSpnE/BmQin heterodimer is enriched together with the canonical P‐body protein BmDcp2. Unlike wild‐type Siwi that normally localizes in nuage, slicer‐deficient Siwi was excluded from nuage and mislocalized in piP‐bodies. Conversely, depletion of BmVasa caused aberrant aggregation of Siwi with piP‐body components, suggesting that BmVasa is a core regulator of nuage/piP‐body partitioning. Importantly, we found that disruption of the nuage/piP‐body partitioning leads to promiscuous overproduction of piRNAs deriving from non‐TE, protein‐coding mRNAs. We propose that silkworm germ cells ensure the fidelity of the piRNA biogenesis pathway by actively enforcing its subcellular compartmentalization.
Results
Silkworm piRNA factors are compartmentalized into nuage and piP‐bodies
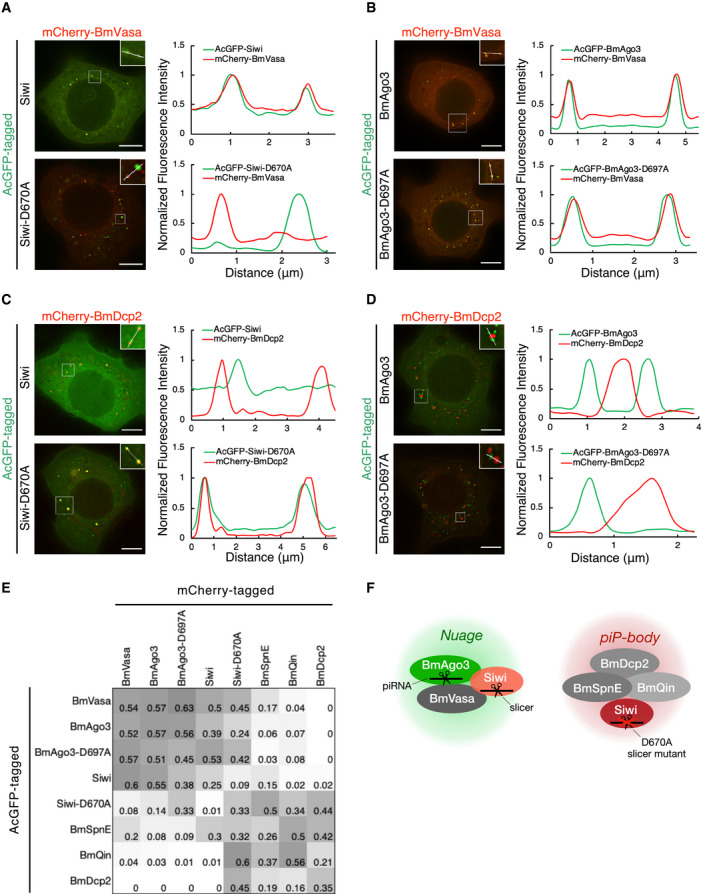
To dissect the compartmentalization of piRNA biogenesis machineries, we adopted live cell imaging of BmN4 cells. Although CRISPR/Cas9‐mediated knockout was successfully achieved on a few genes in BmN4 cells (Zhu et al, 2015; Izumi et al, 2016), our preliminary results suggest that long‐term deletion of Siwi causes cell lethality. Moreover, precise genome editing including epitope tagging is still technically challenging in BmN4 cells. We therefore employed the strategy to express proteins of interest with an N‐terminal fluorescent tag (AcGFP or mCherry) in naive BmN4 cells, in the presence of endogenous wild‐type counterparts. Given that the slicer activity of PIWI proteins is the driving force of the ping‐pong cycle, we first examined the subcellular localization of the slicer‐defective mutants of Siwi (D670A) and BmAgo3 (D697A) in BmN4 cells. We found that similar to wild‐type BmAgo3 and wild‐type Siwi, BmAgo3‐D697A slicer mutant remains colocalized with BmVasa in nuage. In contrast, Siwi‐D670A was largely dislodged from nuage and instead localized in distinct cytoplasmic condensates (Fig 1A and B).
Figure 1. Cytoplasmic compartmentalization of the silkworm piRNA pathway.
-
A, BColocalization of AcGFP‐Siwi, AcGFP‐BmAgo3, and mCherry‐BmVasa in BmN4 cells. Line scans (white line in the enlarged region) show that Siwi‐D670A mutant but not BmAgo3‐D697A mutant dissociates from BmVasa foci. Line scans of fluorescence intensity were normalized to the highest value and depicted at the right panel. Scale bar, 8 μm.
-
C, DColocalization of AcGFP‐Siwi, AcGFP‐BmAgo3, and mCherry‐BmDcp2 in BmN4 cells. Line scans (white line in the enlarged region) show that Siwi‐D670A mutant but not BmAgo3‐D697A mutant overlaps with BmDcp2 foci. Line scans of fluorescence intensity were normalized to the highest value and depicted at the right panel. Scale bar, 8 μm.
-
EHeatmap of colocalization ratio between fluorescence protein‐tagged piRNA factors. Each colocalization ratio is quantified by using ImageJ plugin Comdet (see Materials and Methods) and averaged from n = 3 independent z‐stacks. Darker color represents more frequent colocalization. Known nuage proteins (BmVasa, BmAgo3, Siwi) form a cluster at the top‐left corner. Siwi‐D670A mutant, but not BmAgo3‐D697A, clusters with BmSpnE, BmQin, and BmDcp2 at the bottom‐right corner, representing piP‐bodies. See also Figs EV1 and EV2.
-
FSchematic diagram showing the proposed spatial compartmentalization of the BmN4 piRNA pathway. Nuage components: BmVasa, BmAgo3, Siwi; piP‐body components: BmSpnE, BmQin, and BmDcp2. Siwi‐D670A mutation leads to the accumulation of the mutant itself in piP‐bodies and colocalization with BmSpnE and BmQin. See also Fig EV1.
We next asked whether Siwi‐D670A may have localized to P‐bodies, inspired by the study of mammalian piP‐bodies (Aravin et al, 2009). We used the well‐conserved decapping enzyme BmDcp2 as a P‐body marker in silkworm cells (Franks & Lykke‐Andersen, 2008; Zhu et al, 2013). Remarkably, Siwi‐D670A foci completely overlapped with BmDcp2 foci, whereas wild‐type Siwi as well as both the wild‐type and D697A mutant of BmAgo3 did not (Fig 1C and D). Siwi‐D670A also colocalized with BmSpnE and BmQin (Fig EV1A). In fact, even in the absence of Siwi‐D670A, BmSpnE, and BmQin, but not BmVasa, were observed in the same foci as BmDcp2 (Fig EV1B), which is reminiscent of the mouse piP‐bodies (Aravin et al, 2009) and in line with a previous biochemical study on the silkworm piRNA pathway (Nishida et al, 2015).
Figure EV1. Colocalization of Siwi‐D670A, BmSpnE, BmQin in P‐bodies.
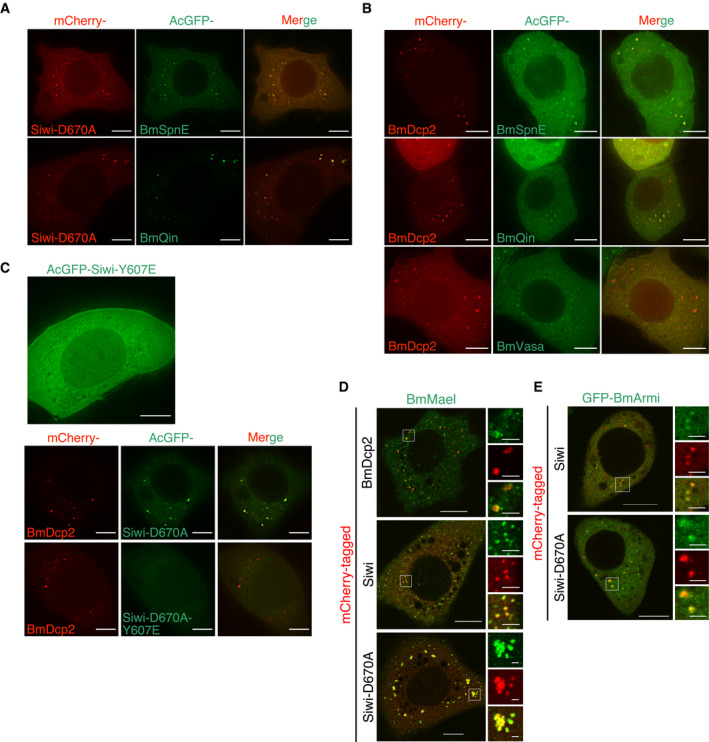
- Colocalization of Siwi‐D670A with BmSpnE or BmQin in non‐perinuclear cytoplasmic condensates. Scale bar 8 μm.
- Colocalization of wild‐type piRNA factors with BmDcp2 in P‐bodies. BmSpnE and BmQin, but not BmVasa, are localized in BmDcp2‐containing P‐bodies. Scale bar 8 μm.
- Localization of Siwi piRNA loading mutant (Y607E) in BmN4 cells. (Top) Siwi‐Y607E is largely dispersed in the cytoplasm. (Bottom) Introduction of Y607E mutation into Siwi‐D670A compromised its colocalization with BmDcp2. Scale bar 8 μm.
- Colocalization of endogenous BmMael with BmDcp2, Siwi, and Siwi‐D670A. BmMael is partially localized to the peripheral region of BmDcp2‐containing P‐bodies and is strongly colocalized with both wild‐type and mutant Siwi in nuage and P‐bodies, respectively. Scale bar 10 μm (cell), 2 μm (foci, enlarged region from the white box).
- Colocalization of stably expressed GFP‐BmArmi with Siwi and Siwi‐D670A. BmArmi is partially localized to both Siwi (nuage) and Siwi‐D670A (P‐bodies). Scale bar 10 μm (cell), 2 μm (foci, enlarged region from the white box).
To validate the presence of piRNA factors in silkworm P‐bodies in a more comprehensive manner, we performed a cross‐colocalization assay with 8 factors: Siwi, Siwi‐D670A, BmAgo3, BmAgo3‐D697A, BmVasa, BmSpnE, BmQin, and BmDcp2. Particle–particle colocalization ratios were quantified and plotted as a heat map (Fig 1E). As expected, a strong colocalization cluster consisting of core nuage proteins (BmVasa, BmAgo3, and Siwi) was observed (top‐left corner in Fig 1E). In contrast, BmSpnE, BmQin, and BmDcp2 formed a cluster distinct from those nuage proteins (bottom‐right corner in Fig 1E), representing P‐bodies. Thus, a subset of piRNA factors is present exclusively in P‐bodies of silkworm cells (Fig 1F), as in mouse gonocytes but unlike in fruit flies. Importantly, our comprehensive colocalization assay confirmed that Siwi‐D670A, but not BmAgo3‐D697A, resides in P‐bodies, unlike wild‐type Siwi in nuage. This shift in localization requires piRNA loading, as unloaded Siwi (Y607E, 5′ binding pocket mutant. Kawaoka et al, 2011) was largely dispersed in the cytoplasm (Fig EV1C top) and the introduction of Y607E mutation into Siwi‐D670A abolished its P‐body localization (Fig EV1C bottom).
Maelstrom (Mael) is an essential factor for the assembly of piP‐bodies in mice (Aravin et al, 2009). In silkworm BmN4 cells, BmMael partially colocalizes with BmDcp2 in piP‐bodies but also with wild‐type Siwi in nuage (Fig EV1D). Interestingly, when the D670A slicer mutant of Siwi was expressed, BmMael exhibited extensive colocalization with Siwi‐D670A in P‐bodies. Similarly, BmArmi, which partially colocalizes with wild‐type Siwi in nuage and with a mitochondrial marker (Patil et al, 2017; Izumi et al, 2020), was found colocalized with Siwi‐D670A in P‐bodies (Fig EV1E). These data suggest a possibility that BmMael and BmArmi, which transiently enter multiple subcellular compartments in normal BmN4 cells, are trapped in P‐bodies in Siwi‐D670A‐expressing cells.
To eliminate the possibility of overexpression artifacts, we performed Western blotting and confirmed that our expression system yields proteins at levels comparable to their endogenous counterparts (Fig EV2A). Furthermore, by replacing the constitutive promoter OpIE2 (pIZ) with an inducible promoter Tet‐On (pTet), we successfully reduced the expression level of the epitope‐tagged protein down to detection limits (Fig EV2A and B). Since the Western blotting results do not reflect the transfection efficiency and the protein concentration at the single cell level, we further analyzed pIZ‐ and pTet‐AcGFP‐Siwi‐transfected cells with flow cytometry (Fig EV2C). The results suggested that the pIZ construct yielded around 2.47‐folds more proteins than the endogenous Siwi, while the pTet construct yielded at most 0.08‐folds (> 30‐folds decrease in the GFP signal). Importantly, all key combinations of colocalization hold true for the pTet‐transfected cells (Fig EV2D). We therefore concluded that inactivation of the slicer activity of Siwi renders it to leave nuage and instead joins BmSpnE/BmQin‐containing P‐bodies in silkworm cells (Fig 1F). We herein refer to these piRNA factors‐containing P‐bodies as piP‐bodies.
Figure EV2. Reduction in protein expression level with Tet‐On inducible promoter.
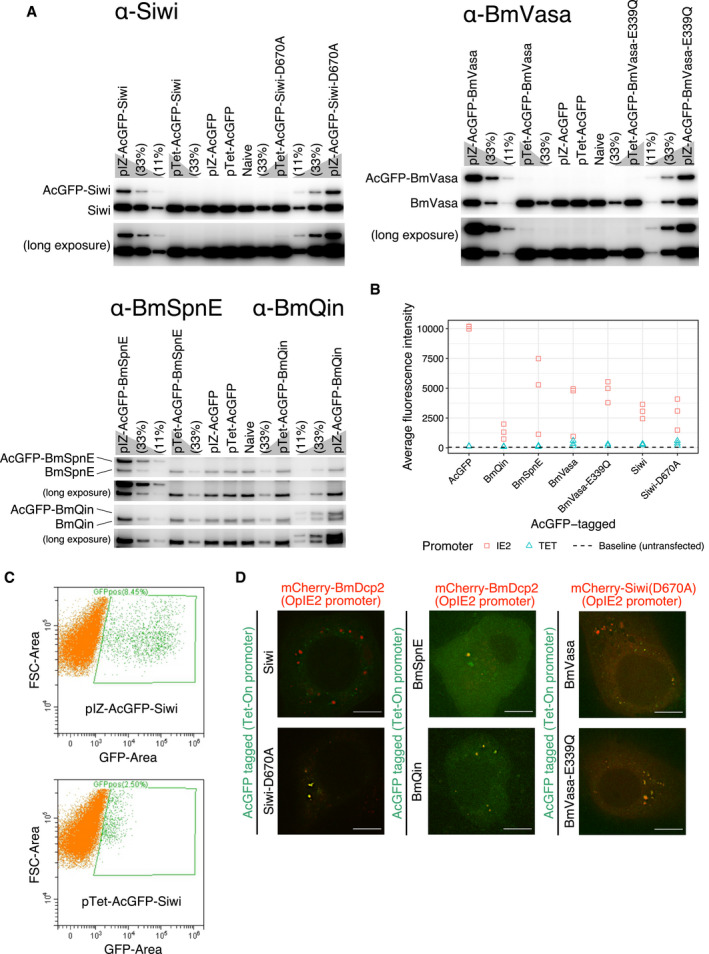
- Western blotting of endogenous counterparts and the epitope‐tagged version of the protein‐of‐interest (POI), either expressed by an OpIE2 promoter (pIZ) or a Tet‐On system (pTet). Most of the pIZ constructs express epitope‐tagged POI (upper bands) at levels comparable to the endogenous counterparts (lower bands) and all of the pTet constructs express POI at significantly lower levels than the pIZ constructs and the endogenous counterparts.
- Relative whole‐cell fluorescence intensity of AcGFP‐tagged POI expressed by an OpIE2 promoter (pIZ) or a Tet‐On system (pTet).
- Flow cytometry analysis of pIZ‐AcGFP‐Siwi or pTet‐AcGFP‐Siwi transfected cells. Naive BmN4 was used as a negative control (0.18% GFP‐positive cells (GFPpos); See Appendix Figure S1). pIZ construct yielded 8.45% GFPpos, while pTet yielded 2.5% GFPpos that were roughly 30–100 folds dimmer than pIZ‐GFPpos. FSC: Forward scatter. For the gating strategy, see Appendix Figure S1.
- Colocalizations of Siwi‐D670A, BmSpnE, and BmQin with BmDcp2, or BmVasa‐E339Q with Siwi‐D670A were not affected by the reducing POI expression level with pTet. Scale bar 10 μm.
Figure EV3. Validation of dsRNA‐mediated knockdown of piRNA factors, effects of BmMael knockdown, and BmVasa ATPase mutation.
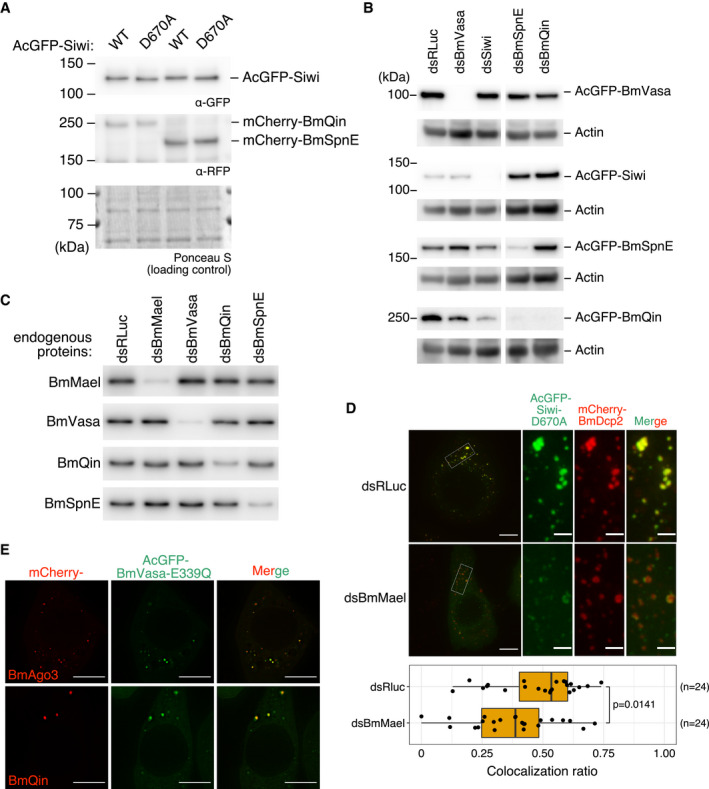
- Western blotting of AcGFP‐Siwi, wild‐type (WT) or D670A, and the co‐expressed mCherry‐BmQin or mCherry‐BmSpnE. Expression of Siwi‐D670A did not affect the expression level of BmQin or BmSpnE.
- Validation of dsRNA‐mediated knockdown of epitope‐tagged piRNA factors by Western blotting.
- Validation of dsRNA‐mediated knockdown of endogenous piRNA factors by Western blotting.
- Depletion of BmMael results in partial segregation of Siwi‐D670A foci from BmDcp2 foci. (Top‐left) Representative Z‐projections (Maximum intensity). Scale bar 8 μm. (Top‐right) Enlarged area from the white box. Scale bar 2 μm. (Bottom) Box plot showing that depletion of BmMael (dsBmMael, n = 24 cells) reduced colocalization ratio between Siwi and BmDcp2, compared with control (dsRLuc, n = 24 cells). Representative data from N = 3 independent experiments are shown. P‐value was calculated by asymptotic Wilcoxon rank sum test. Centre line, median; box limits, lower (Q1), and upper (Q3) quartiles; whiskers, 1.5 × interquartile range (IQR); points, outliers.
- Colocalization of BmAgo3 and BmQin with BmVasa‐E339Q (ATPase mutant). Scale bar 10 μm.
Siwi slicer mutant forms solid‐like aggregates with BmSpnE and BmQin in piP‐bodies
Previous biochemical studies revealed that slicer‐defective Siwi‐D670A can load piRNA but fails to cleave target RNAs (Matsumoto et al, 2016). We therefore reasoned that Siwi‐D670A is likely to stick on target RNAs as a “frozen” pre‐cleavage complex. Supporting this idea, fluorescence recovery after photobleaching (FRAP) experiments showed that Siwi‐D670A has a drastically reduced molecule exchange rate compared with wild‐type Siwi (Fig 2A). Moreover, 5% 1,6‐Hexanediol, aliphatic alcohol used to distinguish liquid‐like condensates and solid‐like aggregates (Kroschwald et al, 2015, 2017), dissolved wild‐type Siwi foci but not Siwi‐D670A foci (Fig 2B).
Figure 2. Siwi‐D670A specifically accumulates with BmSpnE and BmQin at piP‐bodies.
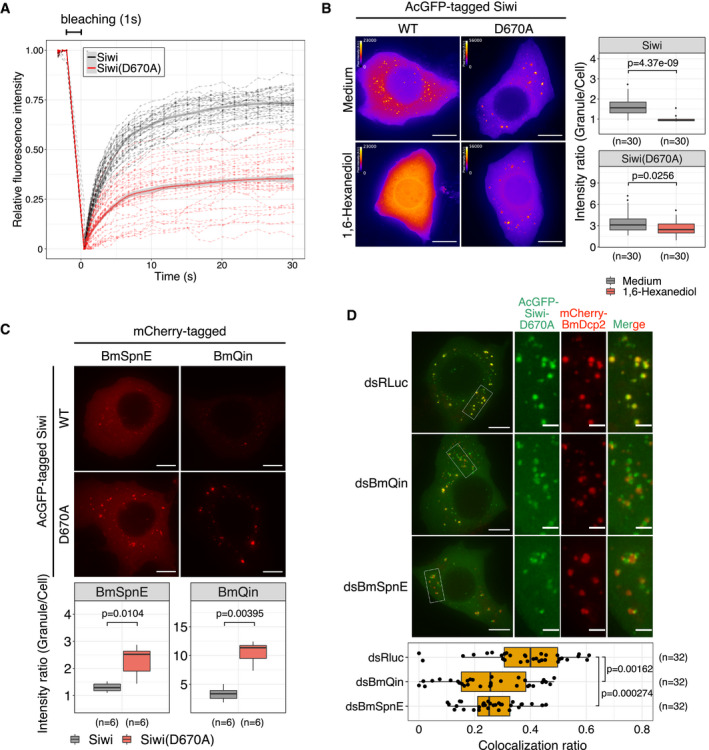
- Fluorescence Recovery After Photobleaching (FRAP) experiment on AcGFP‐Siwi and AcGFP‐Siwi‐D670A. Red dotted lines represent recovery traces of Siwi‐D670A foci (n = 36), and black dotted lines represent recovery traces of Siwi foci (n = 36). Solid lines represent locally estimated scatterplot smoothing (LOESS) curve, and the gray areas represent 95% confidence level interval. Fluorescence intensity was quantified with the softWoRx software and normalized to minimum and maximum in a 0‐1 scaling.
- (Left) Effect of 1,6‐Hexanediol treatment on AcGFP‐Siwi and AcGFP‐Siwi‐D670A foci. Z‐stacks were taken prior to the addition of 1,6‐Hexanediol or medium and after 30 min incubation at RT. Z‐projections of the middle 6 μm stacks were then normalized and pseudo‐colored with Fire LUT to visualize the Siwi foci. Scale bar 10 μm. Scale bars represent pixel intensity in arbitrary units (A.U.) (Right) High granule/cell intensity ratio of Siwi‐D670A persists despite 1,6‐Hexanediol treatment. Average intensity ratio from each of the independent Z‐stacks (n = 30 per set) was quantified (see Materials and Methods) and depicted as box plots. Representative data from N = 3 independent experiments are shown. P‐values were calculated by asymptotic Wilcoxon rank sum test. Points represent outliers.
- Co‐expression of Siwi‐D670A increases granule‐to‐cell intensity ratio of BmSpnE and BmQin foci. (Upper) Representative Z‐projections (maximum intensity) of mCherry‐BmSpnE and mCherry‐BmQin foci. AcGFP signal from FITC channel is not shown. Scale bar 8 μm. (Bottom) Average intensity ratio from each of the independent Z‐stacks (n = 6 per set) was quantified (see Materials and Methods) and depicted as box plots. Representative data from N ≥ 3 independent experiments are shown. P‐values were calculated by asymptotic Wilcoxon rank sum test.
- Depletion of BmSpnE or BmQin results in segregation of Siwi‐D670A from BmDcp2‐containing P‐bodies. (Top‐left) Representative Z‐projections (Maximum intensity). Scale bar 8 μm. (Top‐right) Enlarged area from the white box. Scale bar 2 μm. (Bottom) Box plot showing that depletion of BmQin (n = 32 cells) or BmSpnE (n = 32 cells) reduces colocalization ratio between Siwi‐D670A and BmDcp2, compared with control (dsRLuc, n = 32 cells). Representative data from N = 3 independent experiments are shown. Bonferroni‐corrected P‐values were calculated by asymptotic Wilcoxon rank‐sum test. Points represent data points. See also Fig EV3.
Data information: (B‐D) Box plots: Centre line, median; box limits, lower (Q1), and upper (Q3) quartiles; whiskers, 1.5 × interquartile range (IQR).
Given that Siwi‐D670A colocalizes with piRNA factors in piP‐bodies, its solid‐like aggregates may trap other piP‐body factors such as BmSpnE and BmQin. Indeed, during our cross‐colocalization assay, we noticed that the presence of Siwi‐D670A is coupled to the observation of more focused and brighter foci of BmSpnE and BmQin. By quantitative imaging, we confirmed that the granule‐to‐whole‐cell intensity ratio of these piP‐bodies factors was significantly increased by the co‐expression of Siwi‐D670A compared with that of wild‐type Siwi (Fig 2C), while the expression levels of BmSpnE or BmQin were unchanged (Fig EV3A). This suggests that slicer‐deficient Siwi‐D670A forms solid‐like aggregates while trapping BmSpnE and BmQin in piP‐bodies. On the other hand, colocalization between Siwi‐D670A and the P‐body marker BmDcp2 was severely compromised by the depletion of BmQin or BmSpnE (Figs 2D, and EV3B and C). The reduction in the colocalization ratio between Siwi‐D670A and BmDcp2 was also observed with BmMael depletion (Fig EV3C and D), despite its partial piP‐body localization (Fig EV1D). Thus, recruitment of Siwi‐D670A to piP‐bodies depends on BmQin, BmSpnE, and BmMael, while the presence of Siwi‐D670A renders BmQin and BmSpnE to be anchored in piP‐bodies.
Siwi shuttles between nuage and P‐bodies by changing its interactors
Previous immunoprecipitation assays have detected the interaction of wild‐type Siwi with BmSpnE and BmQin (Nishida et al, 2015), and yet Siwi does not visibly accumulate in piP‐bodies at the steady state, unless its slicer activity is mutated (Fig 1C and E). However, when Siwi was depleted (Fig EV3B), BmQin and BmSpnE were dislodged from BmDcp2‐containing P‐bodies (Fig 3A and B) and instead colocalized with BmVasa‐containing nuage (Fig 3C). This observation suggests that Siwi, which is found in nuage at the steady state, is contributing remotely to the correct localization of BmSpnE and BmQin in piP‐bodies. We reasoned that Siwi may form transient complexes with BmSpnE and BmQin in piP‐bodies until it successfully cleaves target RNAs.
Figure 3. Nuage proteins are required for proper piP‐body assembly.
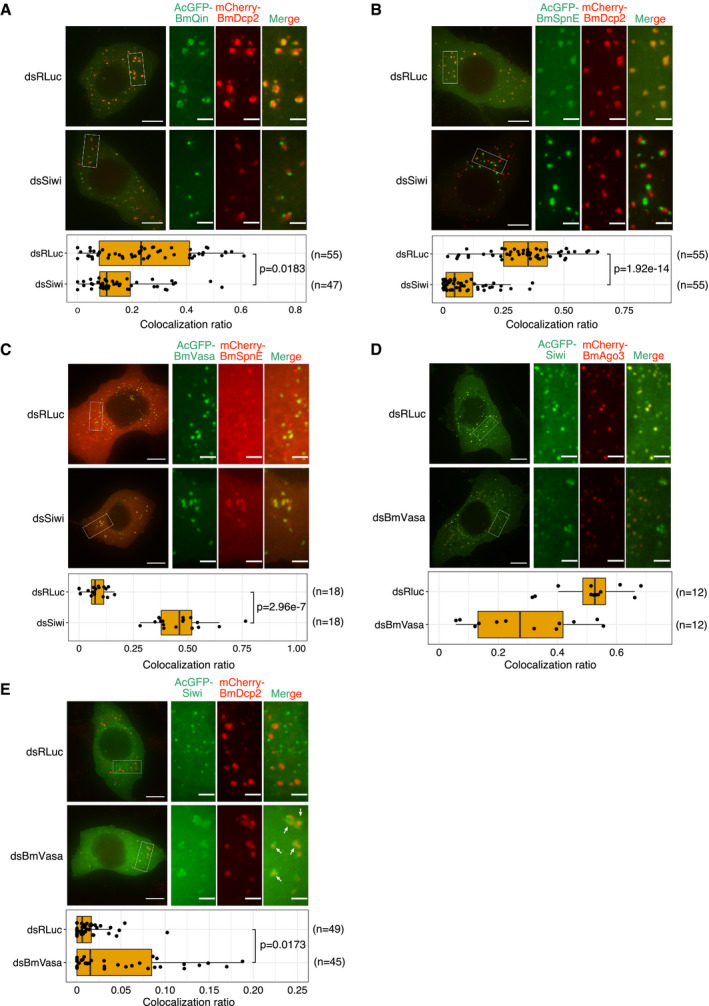
- Depletion of Siwi results in segregation of BmQin from BmDcp2‐containing P‐bodies. Box plot showing that depletion of Siwi (dsSiwi, n = 47 cells) reduces colocalization ratio between BmQin and BmDcp2, compared with control (dsRLuc, n = 55 cells). Representative data from N = 4 independent experiments are shown.
- Depletion of Siwi results in segregation of BmSpnE from BmDcp2‐containing P‐bodies. Box plot showing that depletion of Siwi (dsSiwi, n = 55 cells) reduces colocalization ratio between BmSpnE and BmDcp2, compared with control (dsRLuc, n = 55 cells). Representative data from N = 6 independent experiments are shown.
- Depletion of Siwi results in colocalization of BmSpnE and BmVasa. Box plot showing that depletion of Siwi (dsSiwi, n = 18 cells) significantly upregulates colocalization ratio between BmSpnE and BmVasa, compared with control (dsRLuc, n = 18 cells). Representative data from N = 3 independent experiments are shown.
- Depletion of BmVasa results in segregation of Siwi from BmAgo3 foci. Box plot showing that depletion of BmVasa (dsBmVasa, n = 12 cells) downregulates colocalization ratio between Siwi and BmAgo3, compared with control (dsRLuc, n = 12 cells). Data points collected from N = 2 independent experiments are shown (statistical test is not performed for N < 3 data).
- Depletion of BmVasa results in entanglement of Siwi at piP‐bodies. Interaction interfaces are indicated by white arrows. Box plot showing that depletion of BmVasa (dsBmVasa, n = 45 cells) mildly upregulates colocalization ratio between Siwi and BmDcp2, compared with control (dsRLuc, n = 49 cells). Representative data from N = 5 independent experiments are shown.
Data information: (A‐E) Box plots: Centre line, median; box limits, lower (Q1) and upper (Q3) quartiles; whiskers, 1.5 × interquartile range (IQR); points, data points.
Siwi also transits through nuage; although wild‐type Siwi colocalizes with BmAgo3 in nuage at the steady state, knockdown of the core nuage component BmVasa (Fig EV3B and C) caused segregation of Siwi from BmAgo3 foci (Fig 3D). Moreover, BmVasa depletion led to the formation of concatenated aggregates that contained Siwi and BmDcp2, suggesting that Siwi joins piP‐bodies when BmVasa is not available (Fig 3E). These results suggest that Siwi shuttles between nuage and piP‐bodies by dynamically changing its interactors.
Siwi slicer and BmVasa ATPase activities are both required for proper subcellular compartmentalization
It was previously reported that BmVasa can release the cleavage products from Siwi in a manner dependent on its ATPase activity in vitro (Nishida et al, 2015). We reasoned that wild‐type BmVasa could also release Siwi‐D670A from stalled RNP complexes in nuage, which may explain the low level of Siwi‐D670A in nuage. This ATPase activity can be intercepted and visualized by a dead‐end ATPase mutant of BmVasa, E339Q (DEAD to DQAD), which forms subcellular condensates that trap Siwi, BmAgo3, and BmQin (Xiol et al, 2014; Nishida et al, 2015). We could also confirm the colocalization of BmVasa‐E339Q with BmAgo3 and BmQin in our hands (Fig EV3E). Notably, the BmVasa‐E339Q aggregates did not overlap with the P‐body marker BmDcp2 (Fig 4A). Moreover, BmVasa‐E339Q only partially colocalized with wild‐type BmVasa and lost perinuclear enrichment (Fig 4B). Thus, the BmVasa‐E339Q foci represent neither genuine nuage nor piP‐bodies.
Figure 4. BmVasa ATPase activity regulates nuage/piP‐body partitioning.
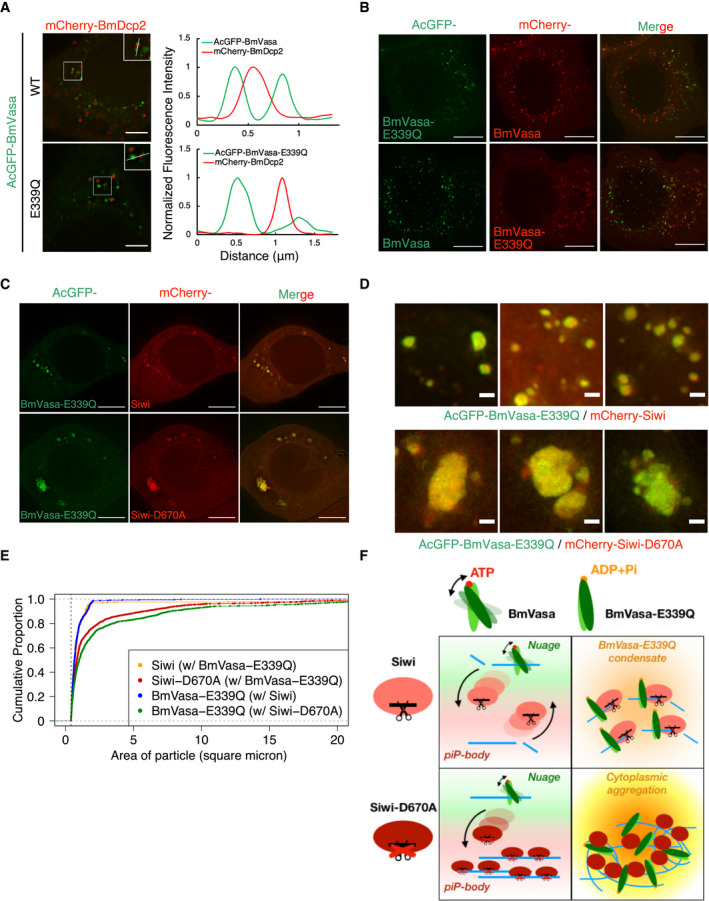
- Localization of AcGFP‐BmVasa and mCherry‐BmDcp2 in BmN4 cells. Line scans (white line in the enlarged region) show that both wild‐type and ATPase mutant BmVasa‐E339Q do not colocalize with BmDcp2. Line scans of fluorescence intensity were normalized to the highest value and depicted at the right panel. Scale bar 4 μm.
- Localization of AcGFP‐ and mCherry‐BmVasa‐E339Q with wild‐type BmVasa as the nuage marker. Z‐projections (Maximum intensity) show that while wild‐type BmVasa localizes in perinuclear region, BmVasa‐E339Q does not necessarily colocalize with its wild‐type counterpart but mostly mis‐localizes to distal cytoplasmic granules. Scale bar 8 μm.
- Colocalization of BmVasa‐E339Q and Siwi‐D670A in enormous cytoplasmic aggregates. Wild‐type Siwi with an active slicer does not cause aggregation of comparable sizes. Scale bar 8 μm.
- Co‐expression of BmVasa‐E339Q/Siwi‐D670A results in aggregates with larger sizes. Representative Z‐projections (Maximum intensity) of mutant aggregates. Scale bar 1 μm.
- Cumulative proportion of the BmVasa‐E339Q/Siwi‐D670A aggregate area between 0.4 and 20 square microns. When both mutants are expressed, more than 60% of the counted foci have increased sizes, where some reach 10 square microns which is rare when only one mutant (BmVasa‐E339Q) is expressed.
- Schematic diagram of the Siwi shuttling model between nuage and piP‐bodies. At steady state, wild‐type Siwi is required for the piP‐bodies assembly and physically interacts with the BmSpnE/BmQin heterodimer. At the same time, Siwi is enriched in nuage, colocalizing with BmVasa. This suggests that Siwi is likely to shuttle between nuage and piP‐bodies in a transient manner. Catalytic mutant Siwi‐D670A is instead retained in piP‐bodies and seldom localizes in nuage, suggesting that slicer activity of Siwi is required for this shuttling. Co‐expressing Siwi‐D670A and BmVasa‐E339Q result in enormous cytoplasmic aggregates, suggesting that BmVasa‐E339Q functions as a dominant‐negative mutant that masks the ATP‐dependent RNPase activity of wild‐type BmVasa. Therefore, both activities of BmVasa ATPase and Siwi slicer are required for Siwi shuttling.
Strikingly, co‐expression of Siwi‐D670A and BmVasa‐E339Q resulted in enormous cytoplasmic aggregates that reach ~ 5–10 square microns (Fig 4C–E), which are much larger than the foci formed by singly expressing either Siwi‐D670A or BmVasa‐E339Q (~ 0.5–2 square microns) (Figs 1A and 4C). Given the fact that such aggregation did not occur when either one of the two wild‐type counterparts is expressed, slicer activity of Siwi and the ATPase activity of BmVasa are likely to have non‐redundant roles in remodeling RNP complexes; therefore, ensuring proper demixing of the two piRNA‐related condensates in silkworm cells (Fig 4F).
Siwi slicer mutant and BmVasa ATPase mutant cause aberrant piRNA production from protein‐coding mRNAs
To study the biological significance of nuage/piP‐body partitioning in silkworm germ cells, we next analyzed small RNA profiles in BmN4 cells expressing Siwi‐D670A and/or BmVasa‐E339Q, which disrupt subcellular localization of piRNA factors. As expected, we observed two peaks at 20‐nt and 27–28‐nt, representing si/miRNAs and mature piRNAs respectively (Fig 5A). We found no obvious difference in the total expression level of both small RNA species among the naive, AcGFP, Siwi, and Siwi‐D670A overexpressed libraries (Fig 5A). We then separated silkworm genes into three groups: TE (putative transposable elements from Silkbase GeneModel; see Materials and Methods), non‐TE (remaining genes with < 24 RPM piRNAs) and potential TE (remaining genes with > 24 RPM piRNAs) (Fig EV4A) and analyzed the expression profile of piRNAs in each group. We found that the majority of the piRNAs derived from potential‐TE and TE genes remained unchanged upon Siwi‐D670A overexpression (Fig 5B), likely because of the presence of endogenous wild‐type counterparts in our experimental setting. Strikingly, however, we observed a strong, global upregulation of non‐TE piRNAs in Siwi‐D670A overexpressed cells (Fig 5B), which was also observed in Siwi‐D670A + BmVasa‐E339Q double‐overexpressed cells, but not in wild‐type Siwi or BmVasa expressed cells (Fig 5C). These small RNAs are similarly peaked at 27–28‐nt and weakly favor 5′ uracil (Fig EV4B and C), a hallmark of Siwi‐piRNAs (Kawaoka et al, 2009). Moreover, these non‐TE piRNAs were resistant to NaIO4‐mediated oxidation, suggesting they are 2′‐O‐methylated piRNAs (Fig EV5A–D). Interestingly, overexpression of BmVasa‐E339Q alone moderately but significantly upregulated non‐TE‐derived, but not TE‐derived, piRNAs, while wild‐type BmVasa overexpression had an opposite effect that slightly reduces non‐TE piRNAs (Fig 5C). These data indicate that the presence of catalytically inactive Siwi‐D670A/BmVasa‐E339Q aggregates promotes promiscuous production of piRNAs from non‐TE transcripts, which is usually suppressed in normal cells. As a control, overexpression of the slicer mutant BmAgo3‐D697A did not alter the expression level of both TE and non‐TE piRNAs (Fig 5C).
Figure 5. Disrupted nuage/piP‐body partitioning causes mis‐production of mRNA‐derived piRNAs.
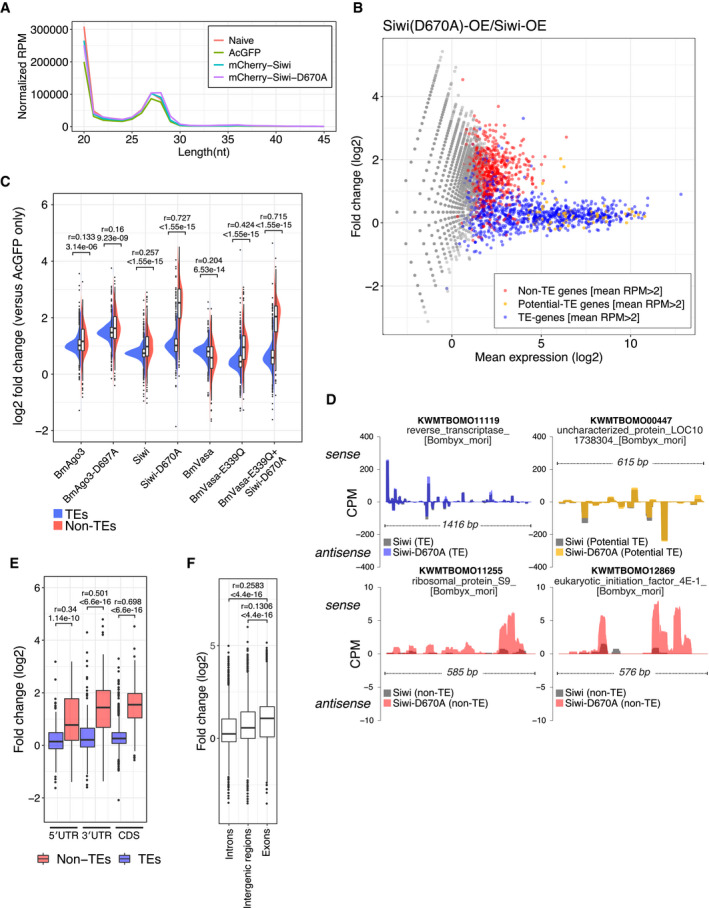
- Length distribution of total small RNAs from BmN4 cells overexpressed with AcGFP, mCherry‐Siwi or mCherry‐Siwi‐D670A. Two peaks (20‐nt and 27‐nt) correspond to siRNA/miRNA and piRNA, respectively.
- MA plot of differential piRNA expression analysis between Siwi‐D670A and Siwi overexpressed libraries. Each dot represents the mapped piRNA (> 25‐nt) on a predicted silkworm gene. Predicted CDSs with mean RPM > 2 between two independent naive libraries were categorized into non‐TE genes (red), potential‐TE genes (orange), and TEs (blue) (see also Fig EV4A and Materials and Methods). Siwi‐D670A overexpression upregulates non‐TE gene‐derived piRNAs while TE‐derived piRNAs are not affected. See also Figs EV4 and EV5.
- Split violin plots of piRNA expression fold change between AcGFP (control) and piRNA factor(s) overexpressed libraries. Overexpression of Siwi‐D670A, BmVasa‐E339Q and both mutants increase non‐TE‐derived piRNA (red, 626 genes) while TE‐derived piRNA (blue, 818 genes) does not change. Bonferroni‐corrected P‐values and the effect sizes (r) were calculated by asymptotic Wilcoxon rank sum test.
- Normalized coverage per million (CPM) of mapped piRNA reads (> 25‐nt) on the CDS region of 4 representative genes. Colored areas represent reads from Siwi‐D670A‐overexpressed library, and the gray areas represent reads from wild‐type Siwi‐overexpressed library. (Top) piRNA reads mapped to both sense and antisense directions on a TE gene (putative reverse transcriptase) and a potential TE gene (uncharacterized protein) with similar RPM between the two libraries. (Bottom) piRNA reads mapped to the sense direction on non‐TE genes (ribosomal protein S9 and eIF4E‐1) with elevated RPM in the Siwi‐D670A library. Elevated peaks appear to spread around the pre‐existing peaks on these genes in the wild‐type library.
- Fold changes of piRNA expression levels in UTRs and CDS between Siwi‐D670A and Siwi overexpressed libraries. Non‐TE‐derived piRNAs are similarly upregulated across 5′ UTR (non‐TE: 105 genes, TE: 274 genes), CDS (non‐TE: 628 genes, TE: 811 genes), and 3′ UTR (non‐TE: 126 genes, TE: 257 genes). Bonferroni‐corrected P‐values were calculated by asymptotic Wilcoxon rank sum test.
- Fold changes of piRNA expression levels in introns (15,065 annotated regions), intergenic regions (11,124 annotated regions), and exons (10,177 annotated regions) between Siwi‐D670A and Siwi overexpressed libraries. Only exon‐derived piRNAs are upregulated by Siwi‐D670A overexpression, suggesting that the process is strictly cytoplasmic. Bonferroni‐corrected P‐values and the effect sizes (r) were calculated by asymptotic Wilcoxon rank sum test.
Data information: (C, E, F) Box plots: Centre line, median; box limits, lower (Q1), and upper (Q3) quartiles; whiskers, 1.5 × interquartile range (IQR); points, outliers.
Figure EV4. Definition of potential‐TE genes and analysis of piRNA hallmarks.
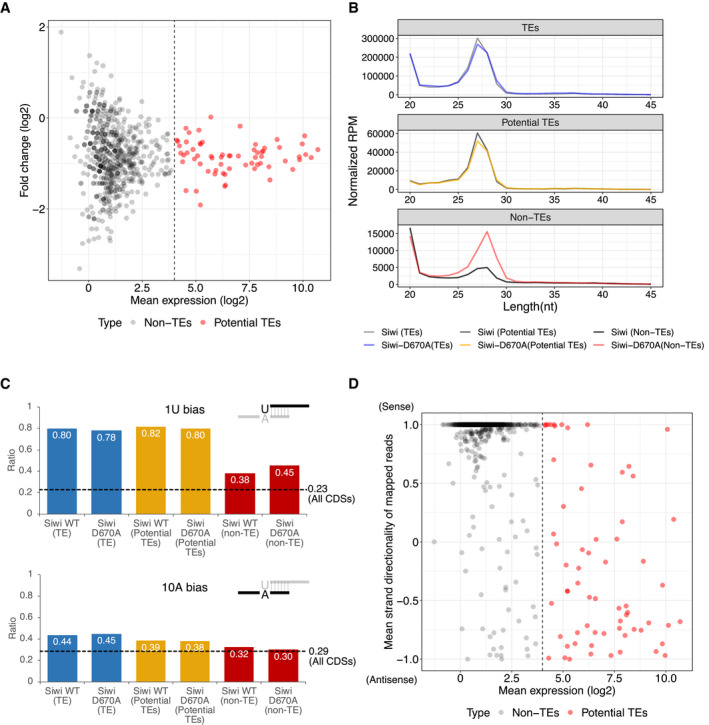
- MA plot of differential piRNA expression analysis between two naive small RNA libraries. Reads longer than 25‐nt are mapped to predicted genes (Silkbase GeneModel) that do not have a BLAST (tblastx) hit with known transposons (Silkbase Transposon Database). Mean piRNA expression with an RPM higher than 24 is defined as potential TE‐derived piRNAs (potential TEs).
- Length distribution of piRNA reads mapped to different groups of predicted genes. Peak length of piRNAs mapped to TEs and potential TEs are both 27‐nt, while peak length of piRNAs mapped to non‐TEs is 28‐nt. Note that despite that Siwi‐D670A causes significant upregulation of 28‐nt piRNA from non‐TEs, the expression of siRNA/miRNA at 20‐nt peak remains unchanged between Siwi and Siwi‐D670A libraries.
- Nucleotide bias of the 1st and 10th nucleotide of non‐TE‐derived piRNAs in Siwi and Siwi‐D670A libraries. (Top) Ratios of uracil as the 1st nucleotide of piRNAs (1 U bias) in TEs and potential TEs are roughly 80% in both libraries. In non‐TEs, 1 U bias is retained at 38% in Siwi‐WT library and 45% in Siwi‐D670A library, which is higher than the control (the frequency of uracil in all CDSs, 23%, black dotted line), suggesting the mapped reads contain bona fide piRNAs. (Bottom) A bias of favoring adenine at the 10th nucleotide (10A bias) can be found in ping‐pong piRNAs. 10th nucleotides of TE piRNAs (~ 44%) and potential TE piRNAs (~ 38%) are mildly biased to adenine, compared with the control frequency of adenine in all CDSs (29%, black dotted line). Non‐TE‐derived piRNAs do not have an apparent 10A bias (~ 30%, similar to the control), suggesting that non‐TE‐derived piRNAs are generated independently of the ping‐pong cycle.
- Analysis of the strand directionality of mapped piRNA reads. Strand directionality is calculated by counting and dividing sense reads over antisense reads, and the mean strand directionality is calculated between the 2 naive libraries. A strand directionality of 1.0 means that only sense reads are mapped to the predicted CDS region, while −1.0 means only antisense reads are mapped. In non‐TEs genes, most of the mapped piRNAs are in sense direction. In contrast, potential TEs genes are mapped with piRNA reads from both directions, suggesting the involvement of ping‐pong machineries. Dashed line: expression threshold value (24 RPM) for the definition of potential TE genes.
Figure EV5. Upregulated non‐TE piRNAs in Siwi‐D670A expressed cells are 2′‐O‐methylated.
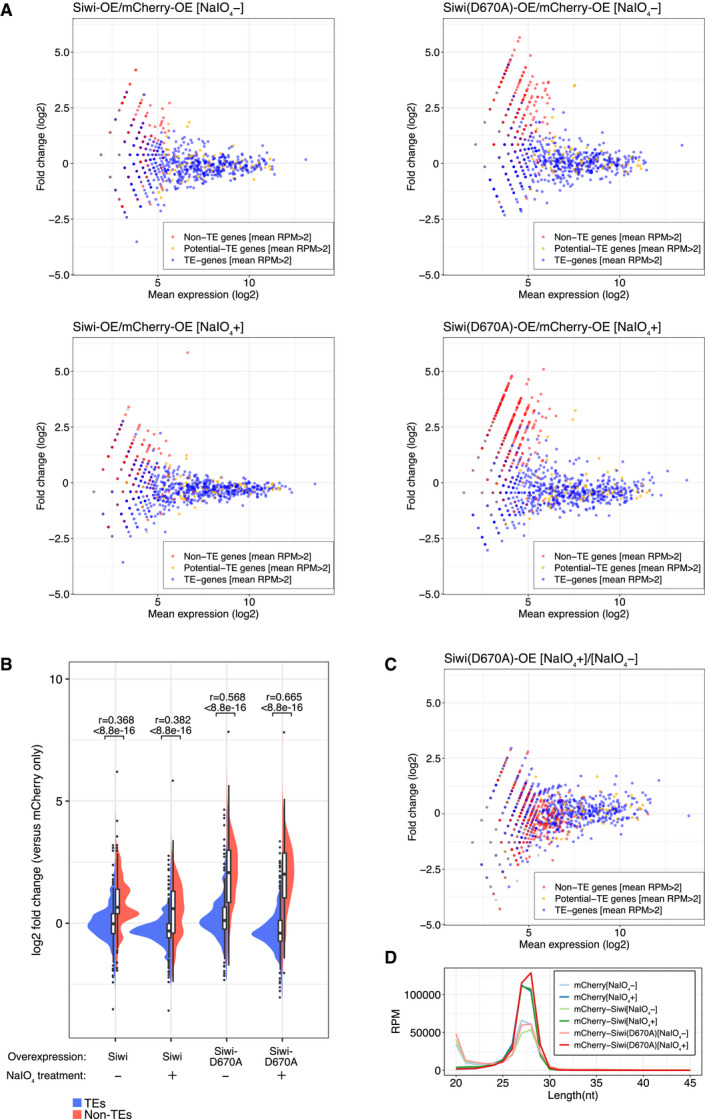
- MA plots of differential piRNA expression analysis of Siwi/Siwi‐D670A‐ overexpressed (OE) cells against mCherry‐OE cells. Reads longer than 25‐nt are mapped to predicted genes (Silkbase GeneModel) and non‐TE genes derived reads are upregulated only in Siwi‐D670A‐OE cells. NaIO4 treatment did not deplete the upregulation.
- Split violin plots of piRNA expression fold change between mCherry (control) and Siwi (WT/D670A) overexpressed libraries with or without NaIO4 treatment. Non‐TE piRNAs (red, 628 genes) upregulated or TE piRNAs (blue, 811 genes) remained unchanged in Siwi‐D670A‐OE cells have a similar distribution and mean value regardless of NaIO4 treatment. Bonferroni‐corrected P‐values and the effect sizes (r) were calculated by asymptotic Wilcoxon rank sum test. Box plot: Centre line, median; box limits, lower (Q1), and upper (Q3) quartiles; whiskers, 1.5 × interquartile range (IQR); points, outliers.
- MA plot of NaIO4 + against NaIO4 – small RNA libraries from Siwi‐D670A‐OE cells. A mild depletion of the less abundant piRNAs is observed similarly with TE, potential TE and non‐TE piRNAs.
- Length distribution of mCherry‐, Siwi‐, and Siwi‐D670A‐OE cells (± NaIO4 treatment). Two peaks (20‐nt and 27‐nt) correspond to siRNA/miRNA and piRNA respectively. The first peak (20‐nt) is depleted after NaIO4 treatment, leading to an increase of the read counts of the piRNA peak (27‐nt) in those libraries.
To identify whether non‐TE piRNAs were synthesized via the ping‐pong cycle or not, we checked their strand orientation and the relative gene location. In both Siwi and Siwi‐D670A overexpressed cells, TE and potential TE‐derived piRNAs were mapped to both strands of the gene region (Figs 5D top and EV4D). In contrast, the non‐TE piRNAs upregulated by Siwi‐D670A were exclusively mapped to the sense strand, suggesting that they are produced in a non‐canonical manner that does not depend on the ping‐pong cycle (Figs 5D bottom and EV4D). We also noticed that strong upregulation of non‐TE piRNAs by Siwi‐D670A was typically observed in exons throughout their subregions (5′ UTR, CDS and 3′ UTR) (Fig 5E), but not in introns or intergenic regions (Fig 5F). Thus, impaired nuage/piP‐body partitioning by Siwi‐D670A or BmVasa‐E339Q overexpression causes aberrant accumulation of piRNAs derived from cytoplasmic protein‐coding mRNAs. Given that mRNAs are stored in P‐bodies (Hubstenberger et al, 2017), co‐aggregation of piRNA factors in piP‐bodies is likely to prompt the entry of P‐body mRNAs into the piRNA pathway, which results in the mis‐production of non‐TE piRNAs. We concluded that the presence of Siwi‐D670A or BmVasa‐E339Q in BmN4 cells impairs self‐nonself discrimination during piRNA precursor acquisition, most likely by causing abnormal RNP aggregation and disrupting the subcellular compartmentalization of the silkworm piRNA pathway (Fig 6).
Figure 6. Proposed model for nuage/piP‐body partitioning in BmN4 cells.
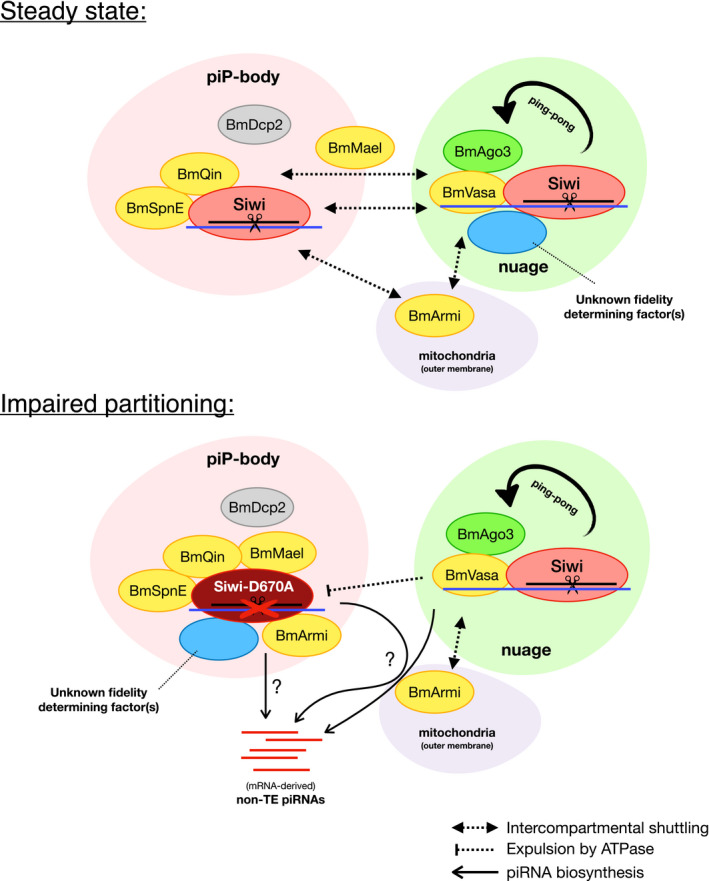
At steady state, nuage and piP‐body accommodate piRNA factors both stably localized at the condensate or transiently docked to it. Siwi, while does not accumulate in piP‐body, transiently enters piP‐body and interacts with BmSpnE and BmQin. An active slicer is required for Siwi to segregate from piP‐body and go back to nuage, where BmVasa uses its ATPase to remodel RNP interaction and modulates the ping‐pong cycle. Some Siwi‐interacting factors like BmMael and BmArmi can enter multiple compartments where Siwi is present. When Siwi‐D670A is expressed, the slicer mutant is expelled from nuage by RNP remodeling activity of BmVasa and is trapped in piP‐body while co‐aggregating with piP‐body factors, as well as those freely shuttling between compartments. A hypothetic fidelity determining factor could be similarly trapped in piP‐body by the mutant, resulting in the upregulation of non‐TE piRNAs. This production could be done in nuage, where native piRNA biosynthesis machineries may still function. Of note, the length distribution and the presence of 2′‐O‐methyl modification in non‐TE piRNAs suggest that these piRNAs are likely to be processed on the outer mitochondrial membrane and in the cytoplasm. It is also possible that non‐TE piRNA is directly generated from piP‐body, where a battery of piRNA biosynthesis factors abnormally accumulated.
Discussion
Here, we quantitatively analyzed the subcellular localization of silkworm piRNA factors and discovered that the silkworm piRNA pathway depends on both nuage and piP‐bodies. Given that wild‐type Siwi colocalizes with BmAgo3 and BmVasa at the steady state (Fig 1A and E) but can be co‐immunoprecipitated with BmSpnE and BmQin (Nishida et al, 2015), our results suggest that Siwi shuttles between the two piRNA condensates in a transient manner, which can be captured by the slicer catalytic mutation. In contrast, a similar slicer mutation in BmAgo3 did not affect its localization pattern (Fig 1B, D, and E), suggesting that BmAgo3 does not require its slicer activity for proper nuage localization.
The enormous cytoplasmic aggregation caused by the co‐expression of Siwi‐D670A and BmVasa‐E339Q but not with wild‐type BmVasa suggests that BmVasa helicase utilizes ATP to prevent co‐aggregation between nuage clusters and Siwi‐D670A aggregates (Fig 4C–E). Recent findings have backed the roles of RNA helicases in regulating the assembly of non‐membranous RNP condensates, in which eIF4A helicase was shown to regulate RNA‐RNA trans‐interactions and limit stress granule formation or its mis‐docking with P‐bodies (Tauber et al, 2020). A related observation has been made with BmVasa as well, where the expression of the ATPase mutant BmVasa‐E339Q yielded enlarged aggregates with the disruption of piRNA precursor exchanges between PIWI partners (Xiol et al, 2014). This layer of regulation is likely to hold true in other piRNA systems, as homologs of putative RNA helicases including Yb, Armitage and SpnE, are at the core of piRNA biogenesis in multiple models. For example, in Drosophila ovaries, the coupling of ping‐pong cycle to phased piRNA biogenesis across the mitochondrial‐nuage interface requires Armitage, which displays a dual localization pattern in both mitochondrial surface and nuage (Ge et al, 2019; Ishizu et al, 2019). Interestingly, a previous study revealed that the localization of Armitage is regulated by the Ago3 slicer activity in flies (Huang et al, 2014), which emphasized that the slicer activity of PIWI proteins plays important roles in regulating the dynamics of key piRNA factors across piRNA‐related compartments. This is in line with our conclusion with the Siwi slicer mutant (Fig EV1E) but in a different cellular context. Hence, it is likely a common feature that key catalytic activities of piRNA factors regulate the subcellular dynamics of piRNA factors, which couples with the correct assembly of piRNA condensates.
Overexpression of Siwi and/or BmVasa catalytic mutants caused abnormal RNP aggregates and compromised nuage/piP‐body partitioning (Fig 4C–E). Non‐TE piRNAs were mis‐produced especially in Siwi‐D670A overexpressed cells (Fig 5B and C), where BmSpnE, BmQin, BmArmi, and BmMael were co‐aggregated in piP‐bodies (Figs 2C and EV1A, D, and E). This disruption of molecule exchanges in piP‐bodies is likely to force P‐body‐stored mRNAs to join the piRNA biogenesis pathway. Intriguingly, non‐TE piRNAs are similar in length to mature piRNAs (Fig EV4B) and 2′‐O‐methylated (Fig EV5), suggesting that they were faithfully processed by the mitochondrial surface piRNA factors such as Trimmer and BmHen1 (Izumi et al, 2016, 2020). It was previously shown that BmSpnE preferentially associates with empty, but not piRNA‐loaded, Siwi (Nishida et al, 2015). If so, BmSpnE, which has been aberrantly trapped in piP‐bodies by Siwi‐D670A, may recruit empty Siwi to force it to load non‐TE RNAs in piP‐bodies. Alternatively, it is also plausible that Siwi‐D670A‐induced aggregations trap and disable some unidentified piRNA specificity‐determining factor(s) that normally prevents piRNA loading complexes from promiscuously processing non‐TE RNAs in nuage (Fig 6).
In the current study, we reported that piP‐bodies accommodate essential piRNA factors that sub‐microscopically interact with Siwi and drive its slicer‐dependent shuttling between nuage and piP‐bodies. It is plausible that more uncharacterized piRNA factors localize or transiently enter piP‐bodies, just like Siwi. Moreover, we found that dynamic subcellular partitioning of piRNA condensates ensures fidelity of piRNA biogenesis. Our data will serve as a starting point for future studies on the biological significance of piRNA condensate assembly.
Materials and Methods
Cell culture and plasmid transfection
BmN4 cells were cultured at 27°C in IPL‐41 medium (AppliChem) supplemented with 10% fetal bovine serum. For plasmid transfection prior to fluorescence imaging, BmN4 cells (5 × 10⁴ cells per well) were cultured on an 8‐well glass chamber (Matsunami Glass Ind). For cells in each well, in total 150 ng pIZ expression vectors were transfected using X‐tremeGENE HP DNA Transfection Reagent (Roche) and the cells were observed 3 days later. For plasmid transfection prior to small RNA library preparation (Figs 5 and EV5), BmN4 cells (1.5 × 10⁶ cells per 10 cm dish) were transfected with 3 μg pIZ expression vectors and incubated for 4 days. Transfection was then repeated, and the cells were incubated for an extra 3 days before harvesting and total RNA extraction. For pTet experiments, both pTet and pIZ plasmids were transfected with the same condition mentioned above except that 100 ng/ml Doxycycline (MP Biomedicals) was applied directly to the medium 24 h after transfection. For 1,6‐Hexanediol treatment, 5% (w/v) 1,6‐Hexanediol (Sigma‐Aldrich) dissolved in PBS was directly applied to cells and incubated for 30 min at RT.
Plasmid preparation
Generation of pIZ‐AcGFP‐Siwi, pIZ‐AcGFP‐BmAgo3, pIZ‐mCherry‐Siwi, and pIZ‐mCherry‐BmAgo3
DNA fragments coding fluorescence proteins (AcGFP and mCherry) were amplified from pAcGFP1 or pmCherry (Takara Clontech) and cloned into pIZ‐FLAG6H‐Siwi and pIZ‐FLAG6H‐BmAgo3 (Kawaoka et al, 2009) using primers #1–9, replacing the FLAG6H tag with the ORF of fluorescence proteins. See also Table EV1 for primer sequences.
Cloning of BmVasa, BmSpnE, BmQin, and BmDcp2 into pIZ vectors
To clone BmVasa, BmSpnE, BmQin, and BmDcp2 into pIZ vectors, pIZ‐AcGFP‐BmAgo3, or pIZ‐mCherry‐BmAgo3 were first digested with BamHI (NEB) and NotI (NEB) restriction enzymes and gel‐excised to linearize the pIZ vector. DNA fragments containing CDSs of AcGFP, mCherry were amplified by PCR using primers #2, #6, and #10. BmSpnE, BmQin, and BmDcp2 coding sequences were obtained by RT–PCR from BmN4 RNAs using SuperScript III Reverse Transcriptase (Thermo Fisher/Invitrogen) and primers #11–19. The coding sequence of BmVasa was amplified from a KAIKO cDNA clone [from National BioResource Project (Silkworm)] using primers #20–22. AcGFP and mCherry fragments were then cross‐mixed with BmVasa, BmSpnE, BmQin, and BmDcp2 fragments and ligated to the BamHI‐NotI digested pIZ vectors by using NEBuilder Hifi DNA Assembly kit (NEB). See also Table EV1 for primer sequences.
Generation of slicer mutants Siwi‐D670A, Siwi‐Y607E, BmAgo3‐D697A, and ATPase mutant BmVasa‐E339Q
Siwi‐D670A, Siwi‐Y607E, BmAgo3‐D697A, and BmVasa‐E339Q mutants were generated by PCR‐based site‐directed mutagenesis using primers #40–47 and NEBuilder Hifi DNA Assembly kit (NEB). See also Table EV1 for primer sequences.
Generation of pTet‐AcGFP and cloning of BmVasa, BmVasa‐E339Q, BmSpnE, BmQin, Siwi, Siwi‐D670A into pTet vectors
To generate pTet‐AcGFP, multiple DNA fragments were amplified by PCR from pMK243 (a gift from T. Natsume) with primer pairs (#23 & #25, #24 & 25, #26 & #27, #28 & #29) and from pIZ‐AcGFP with primer pairs (#30 & #31, #32 & #33) and were ligated with NEBuilder Hifi DNA Assembly kit (NEB). Cloning of CDSs of piRNA factors into pTet‐AcGFP was then performed with primers #2, #34–39 using PCR and NEBuilder Hifi DNA Assembly kit (NEB).
dsRNA preparation and transfection
For dsRNA preparation, template DNAs were prepared by PCR using primers containing T7 promoters (primers #48–59). All the dsRNAs were in vitro transcribed using T7‐Scribe Standard RNA IVT kit (CELLSCRIPT) and were purified by ethanol precipitation followed by ammonium acetate precipitation. All dsRNAs (300 ng per glass chamber) were transfected using X‐tremeGENE HP DNA Transfection Reagent (Roche) on day 0 and day 4 and cells were observed on day 7 post‐transfection. Plasmids bearing fluorescent‐tagged POI were co‐transfected with the dsRNAs on day 4 post‐transfection. See also Table EV1 for primer sequences.
Preparation of cell lysates and Western blotting
Cells mounted on a glass chamber with corresponding dsRNA and DNA transfected were collected after fluorescence microscopy by pipetting and washed twice with ice‐cold PBS. Whole‐cell lysates were prepared by suspending the cells with 1 × lysis buffer (30 mM HEPES‐KOH (pH 7.4), 100 mM potassium acetate, 2 mM magnesium acetate) supplemented with 0.2% Triton X‐100 (Polyoxyethylene(10) Octylphenyl Ether, Wako). After 20 min of incubation on ice, the cell suspension was vortexed for 30 s and centrifuged at 17,000 g for 20 min at 4°C. The supernatants were mixed with SDS protein sample buffer and heated at 95°C for 3 min. For Western blotting, proteins were transferred onto PVDF membranes (Merck IPFL00005) after SDS polyacrylamide gel electrophoresis. Membrane blocking was performed by soaking the membrane in 5% skim milk in TBS‐T solution for 1 h at RT or overnight at 4°C. The membrane was then incubated with anti‐GFP (B‐2) (Santa Cruz), anti‐RFP (MBL), anti‐actin (Santa Cruz, sc‐1616), anti‐Siwi (Izumi et al, 2020), anti‐BmVasa (Nishida et al, 2015), anti‐BmSpnE (Nishida et al, 2015), anti‐BmQin (Nishida et al, 2015), or anti‐BmMael [affinity‐purified rabbit polyclonal antibody generated by immunizing N‐terminally His‐tagged recombinant BmMael (Scrum)] in Signal Enhancer HIKARI (Solution A) (Nacalai Tesque) for 1 h at RT. After washing with TBS‐T, the membrane was then incubated with anti‐mouse IgG‐HRP (MBL), anti‐rabbit IgG‐HRP (MBL), or anti‐goat IgG‐HRP (Jackson ImmunoResearch) in Signal Enhancer HIKARI (Solution B) (Nacalai Tesque) for 1 h at RT. Following washing with TBS‐T, chemiluminescence was induced by soaking membrane with Luminata Forte Western HRP Substrate (Millipore) and images were acquired by Amersham Imager 600 (Cytiva).
Flow cytometry
For Fig EV2C, naive BmN4 cells or BmN4 cells transfected with pIZ or pTet constructs were harvested on Day 4 post‐transfection, collected at 800 g for 3 min and resuspended in 1 ml PBS. Cells were treated with 500 ng propidium iodide (Nacalai Tesque) before analyzing on a CytoFLEX S system (Beckman Coulter). A 488‐nm laser was used to excite GFP, forward (FSC) and side (SSC) scatter. A 561‐nm laser was used to excite propidium iodide. GFP emission was detected using a 525/40 BP filter, propidium iodide emission was detected using a 610/20 BP filter. For the gating strategy, see Appendix Figure S1.
Total RNA extraction, NaIO4 treatment, and small RNA‐seq
After harvesting the cells, total RNAs were prepared by TRI Reagent (Molecular Research Center Inc.) following manufacturers’ instructions. Total RNAs between 20 and 50‐nt were gel‐excised and purified by using ZR small‐RNA PAGE Recovery Kit (ZYMO Research). Small RNA libraries were then prepared from purified total small RNAs by using NEBNext Multiplex Small RNA Library Prep Set for Illumina (NEB) according to the manufacturers’ instructions. Transfections and library preparations were performed at separate dates to obtain biological replicates. Libraries described in Figs 5 and EV4 were sequenced on an Illumina HiSeq 4000 platform, and libraries described in Fig EV5 were sequenced on an Illumina MiniSeq platform. NaIO4‐mediated oxidation was performed essentially as described previously (Kawaoka et al, 2011).
Sequence analysis of small RNAs
Following removal of adapter sequences by cutadapt (Martin, 2011), 20–45‐nt reads were mapped to (i) Silkbase Transposon libraries (BmTE and 121TEs) (Osanai‐Futahashi et al, 2008) and (ii) Silkbase GeneModel library (Kawamoto et al, 2019) with Bowtie (Langmead et al, 2009) allowing zero mismatches. Sam files were converted to bam files by SAMtools (Li et al, 2009) and then to bed files by BEDTools (Quinlan & Hall, 2010). Small RNA reads longer than 25‐nt were defined as piRNA reads and were used for analysis in all figures except Figs 5A, EV4B and EV5D. Sequencing data were normalized with both highly abundant miRNAs and total mapping reads (as performed in Izumi et al, 2016). To define subgroups of genes (as GeneModel contains transposon‐like sequences), BLAST (tblastx) was performed between Silkbase transposon databases (a total of 1,811 TE genes) and GeneModel database. BLAST returned with 811 TE genes and 628 non‐TE genes with an e‐value threshold of 1e‐10 and a mean expression threshold > 2 piRNA reads per gene. Another 65 genes exceeding the BLAST e‐value threshold but with mean expression over 24 piRNA reads between 2 naive libraries were classified as potential TEs (See also Fig EV4A). UTR sequences were obtained with function “gffread” from GFF Ultilities (Pertea & Pertea, 2020). P‐values and effect size (r) were calculated using “wilcox_test” function of R package Coin (version 1.3‐1) in R (version 3.5.3).
Live cell imaging
DeltaVision Elite system (GE Healthcare) with an IX71 microscope (Olympus) equipped with a × 60 oil‐immersion objective lens (PLAPON 60XO, NA 1.42, Olympus) with an air‐conditioned chamber maintained at 27°C was used for all microscopic experiments except for Fig EV1D and E, which used an FV3000 Confocal Laser Scanning Microscope (Olympus) with a × 60 oil‐immersion objective lens (PLAPON 60XO, NA 1.42, Olympus) and processed FV31S‐SW Viewer software. 72 h post‐transfection, BmN4 cells cultured on an 8‐well glass chamber (Matsunami Glass Ind) were magnified and excited with the light source at wavelength 475/28 nm for FITC (AcGFP) and 542/27 nm for TRITC (mCherry). Emission filters with wavelengths 525/48 nm for FITC (AcGFP) and 597/45 nm for TRITC (mCherry) were used. Data were acquired with a sCMOS camera and processed on the microscope regulation software softWoRx or with Fiji (Schindelin et al, 2012). All images except for Fig EV1D and E were processed by the deconvolution algorithm in softWoRx with settings listed below: Enhanced Ratio (aggressive), 10 cycles, Noise Filtering: Medium. All data except for Fig EV1D and E were obtained as Z‐sections with a scanning range of 10.00 and 0.2 μm spacing. Maximum intensity projections (30 middle slices) and line scans were performed with Fiji (Schindelin et al, 2012).
Immunofluorescence
For Fig EV1D and E, BmN4 cells were fixed with 4% paraformaldehyde for 10 min at RT. Cells were then permeabilized with 0.3% Triton X‐100 for 5 min at RT. Blocking was performed with 1% BSA/0.1% Triton X‐100 for 1 h at RT and stained with anti‐BmMael antibody (1:400). For secondary antibody, Alexa Fluor 488 donkey anti‐rabbit IgG antibody (Thermo Fisher/Invitrogen) was used for detection. GFP‐tagged BmArmi stable cell was described previously (Izumi et al, 2020).
Image processing and quantification
For all line scan analysis, Fiji (ImageJ) function “Plot Profile” was used. For all quantitative colocalization analyses, unstacked 16‐bit grayscale images with multi‐channels were quantified with Fiji plugin ComDet v0.3.6.1 using the following settings: Include larger particles (detect in both channels independently). Approximate particle size: 3.00 pix. Sensitivity: SNR = 20. Ch1 shared the same setting with Ch2. Max distance between colocalized spot: 2.00 pix. Every spot in every Z plane was counted as 1 (colocalized) or 0 (not colocalized), and the colocalization ratio was calculated as the mean value of all spots. P‐values were calculated using “wilcox_test” function of R package Coin (version 1.3‐1) in R (version 3.5.3). For Fig 1E, colocalization ratios were calculated as the mean value between 3 independent Z‐stacks.
For Fig 2A, FRAP experiments were performed as photokinetic assay (PKA) experiments in the DeltaVision Elite system with a 405 nm laser following manufacturers’ instructions. Bleach intensity (%T), 100%. Duration, 1 s. Relative intensity value was double normalized to maximum intensity (pre‐bleaching) and minimum intensity (post‐bleaching). Locally estimated scatterplot smoothing (LOESS) curve and 95% confidence level interval (the gray areas) were calculated with the “loess” function in R (version 3.5.3).
For Fig 2B, signals from the FITC channels were pseudo‐colored with Fire LUT using Fiji. For calculation of granule‐to‐cell intensity ratio in Fig 2B and C, cell area was first converted into a binary mask by auto‐thresholding (“Default”) and the background area was generated by inverting the mask. To measure whole‐cell and background fluorescence, average fluorescence intensity of every Z‐plane was measured using Fiji and averaged with custom R programs. To measure raw granule intensity, auto‐thresholding (“MaxEntropy Dark”) was used instead for masking and measurement. Subsequently, background intensity was subtracted from both granule and whole‐cell intensities to result in corrected intensities. Granule‐to‐cell intensity ratio was calculated by dividing corrected granule intensity by corrected whole‐cell intensity. P‐values were calculated using “wilcox_test” function of R package “Coin (version 1.3‐1)” in R (version 3.5.3). For Fig EV2B, average fluorescence intensity was quantified in a similar approach but without raw granule intensity measurement.
For Fig 4E, to measure granule area, auto‐thresholding (“MaxEntropy Dark”) was used for masking and ImageJ function “Analyze Particles” was used for area measurement with an area limit from 0.2 to 100 μm2. Cumulative density plot excluding noise pixels smaller than 0.4 μm2 or mis‐thresholding masks larger than 20 μm2 was plotted with Empirical Cumulative Distribution Function (ECDF) in R (version 3.5.3).
Author contributions
Conception, experiment design and manuscript writing: PYC, KS, NI, and YT Experiments on Figs EV1D–E, and EV2A and EV3C: NI Other experiments and the bioinformatics analyses: PYC Supervision of bioinformatics analyses: KS Project supervision: YT Results and manuscript approval: All authors.
Conflict of interest
The authors declare that they have no conflict of interest.
Supporting information
Appendix
Expanded View Figures PDF
Table EV1
Review Process File
Acknowledgements
Antibodies targeting BmVasa, BmSpnE and BmQin are kind gifts from MC Siomi (Nishida et al, 2015). pMK constructs were provided by T. Natsume. The cDNA clones used in this study were supplied by the National BioResource Project (Silkworm). Illumina HiSeq 4000 sequencing was performed in the Vincent J. Coates Genomics Sequencing Laboratory at UC Berkeley, supported by NIH S10 OD018174 Instrumentation Grant. We thank the members of the Tomari Laboratory for their critical comments on the manuscript. This work was supported in part by Grant‐in‐Aid for Scientific Research (S) (grant 18H05271 to Y.T.), Grant‐in‐Aid for Scientific Research (C) (grant 19K06484 to N.I.) and Grant‐in‐Aid for JSPS Fellows (grant 20J11535 to P.Y.C.).
EMBO reports (2021) 22: e51342.
Data availability
The sequencing data reported in this paper have been deposited at the DDBJ database (https://www.ddbj.nig.ac.jp) under accession number DRA010464 (https://ddbj.nig.ac.jp/DRASearch/submission?acc=DRA010464) and DRA011372 (https://ddbj.nig.ac.jp/DRASearch/submission?acc=DRA011372). All other data are available from the authors upon reasonable request.
References
- Aravin AA, van der Heijden GW, Castañeda J, Vagin VV, Hannon GJ, Bortvin A (2009) Cytoplasmic compartmentalization of the fetal piRNA pathway in mice. PLoS Genet 5: e1000764 [DOI] [PMC free article] [PubMed] [Google Scholar]
- Aravin AA, Sachidanandam R, Bourc'his D, Schaefer C, Pezic D, Toth KF, Bestor T, Hannon GJ (2008) A piRNA pathway primed by individual transposons is linked to de novo DNA methylation in mice. Mol Cell 31: 785–799 [DOI] [PMC free article] [PubMed] [Google Scholar]
- Brennecke J, Aravin AA, Stark A, Dus M, Kellis M, Sachidanandam R, Hannon GJ (2007) Discrete small RNA‐generating loci as master regulators of transposon activity in Drosophila . Cell 128: 1089–1103 [DOI] [PubMed] [Google Scholar]
- Choi S‐Y, Huang P, Jenkins GM, Chan DC, Schiller J, Frohman MA (2006) A common lipid links Mfn‐mediated mitochondrial fusion and SNARE‐regulated exocytosis. Nat Cell Biol 8: 1255–1262 [DOI] [PubMed] [Google Scholar]
- Decker CJ, Parker R (2012) P‐bodies and stress granules: possible roles in the control of translation and mRNA degradation. Cold Spring Harb Perspect Biol 4: a012286 [DOI] [PMC free article] [PubMed] [Google Scholar]
- Eddy EM (1974) Fine structural observations on the form and distribution of nuage in germ cells of the rat. Anat Rec 178: 731–757 [DOI] [PubMed] [Google Scholar]
- Eddy EM (1975) Germ plasm and the differentiation of the germ cell line. Int Rev Cytol 43: 229–280 [DOI] [PubMed] [Google Scholar]
- Fazio SD, Bartonicek N, Giacomo MD, Abreu‐Goodger C, Sankar A, Funaya C, Antony C, Moreira PN, Enright AJ, O’Carroll D (2011) The endonuclease activity of Mili fuels piRNA amplification that silences LINE1 elements. Nature 480: 259–263 [DOI] [PubMed] [Google Scholar]
- Franks TM, Lykke‐Andersen J (2008) The control of mRNA decapping and P‐body formation. Mol Cell 32: 605–615 [DOI] [PMC free article] [PubMed] [Google Scholar]
- Ge DT, Wang W, Tipping C, Gainetdinov I, Weng Z, Zamore PD (2019) The RNA‐binding ATPase, armitage, couples piRNA amplification in nuage to phased piRNA production on mitochondria. Mol Cell 74: 982–995 [DOI] [PMC free article] [PubMed] [Google Scholar]
- Gunawardane LS, Saito K, Nishida KM, Miyoshi K, Kawamura Y, Nagami T, Siomi H, Siomi MC (2007) A slicer‐mediated mechanism for repeat‐associated siRNA 5’ end formation in Drosophila . Science 315: 1587–1590 [DOI] [PubMed] [Google Scholar]
- Han BW, Wang W, Li C, Weng Z, Zamore PD (2015) piRNA‐guided transposon cleavage initiates Zucchini‐dependent, phased piRNA production. Science 348: 817–821 [DOI] [PMC free article] [PubMed] [Google Scholar]
- Huang H, Li Y, Szulwach KE, Zhang G, Jin P, Chen D (2014) AGO3 Slicer activity regulates mitochondria‐nuage localization of Armitage and piRNA amplification. J Cell Biol 206: 217–230 [DOI] [PMC free article] [PubMed] [Google Scholar]
- Hubstenberger A, Courel M, Bénard M, Souquere S, Ernoult‐Lange M, Chouaib R, Yi Z, Morlot J‐B, Munier A, Fradet M et al (2017) P‐body purification reveals the condensation of repressed mRNA regulons. Mol Cell 68: 144–157 [DOI] [PubMed] [Google Scholar]
- Ishizu H, Kinoshita T, Hirakata S, Komatsuzaki C, Siomi MC (2019) Distinct and collaborative functions of Yb and Armitage in transposon‐targeting piRNA biogenesis. Cell Rep 27: 1822–1835 [DOI] [PubMed] [Google Scholar]
- Izumi N, Shoji K, Sakaguchi Y, Honda S, Kirino Y, Suzuki T, Katsuma S, Tomari Y (2016) Identification and functional analysis of the pre‐piRNA 3′ Trimmer in silkworms. Cell 164: 962–973 [DOI] [PMC free article] [PubMed] [Google Scholar]
- Izumi N, Shoji K, Suzuki Y, Katsuma S, Tomari Y (2020) Zucchini consensus motifs determine the mechanism of pre‐piRNA production. Nature 578: 311–316 [DOI] [PubMed] [Google Scholar]
- Kawamoto M, Jouraku A, Toyoda A, Yokoi K, Minakuchi Y, Katsuma S, Fujiyama A, Kiuchi T, Yamamoto K, Shimada T (2019) High‐quality genome assembly of the silkworm, Bombyx mori. Insect Biochem Mol Biol 107: 53–62 [DOI] [PubMed] [Google Scholar]
- Kawaoka S, Hayashi N, Suzuki Y, Abe H, Sugano S, Tomari Y, Shimada T, Katsuma S (2009) The Bombyx ovary‐derived cell line endogenously expresses PIWI/PIWI‐interacting RNA complexes. RNA 15: 1258–1264 [DOI] [PMC free article] [PubMed] [Google Scholar]
- Kawaoka S, Izumi N, Katsuma S, Tomari Y (2011) 3′ end formation of PIWI‐interacting RNAs in vitro . Mol Cell 43: 1015–1022 [DOI] [PubMed] [Google Scholar]
- Kroschwald S, Maharana S, Mateju D, Malinovska L, Nüske E, Poser I, Richter D, Alberti S (2015) Promiscuous interactions and protein disaggregases determine the material state of stress‐inducible RNP granules. eLife 4: e06807 [DOI] [PMC free article] [PubMed] [Google Scholar]
- Kroschwald S, Maharana S, Simon A (2017) Hexanediol: a chemical probe to investigate the material properties of membrane‐less compartments. Matters 3: e201702000010 [Google Scholar]
- Langmead B, Trapnell C, Pop M, Salzberg SL (2009) Ultrafast and memory‐efficient alignment of short DNA sequences to the human genome. Genome Biol 10: R25 [DOI] [PMC free article] [PubMed] [Google Scholar]
- Li H, Handsaker B, Wysoker A, Fennell T, Ruan J, Homer N, Marth G, Abecasis G, Durbin R (2009) The sequence Alignment/Map format and SAMtools. Bioinformatics 25: 2078–2079 [DOI] [PMC free article] [PubMed] [Google Scholar]
- Lim AK, Kai T (2007) Unique germ‐line organelle, nuage, functions to repress selfish genetic elements in Drosophila melanogaster. Proc Natl Acad Sci U S A 104: 6714–6719 [DOI] [PMC free article] [PubMed] [Google Scholar]
- Luo Y, Na Z, Slavoff SA (2018) P‐bodies: composition, properties, and functions. Biochemistry 57: 2424–2431 [DOI] [PMC free article] [PubMed] [Google Scholar]
- Malone CD, Brennecke J, Dus M, Stark A, McCombie WR, Sachidanandam R, Hannon GJ (2009) Specialized piRNA pathways act in germline and somatic tissues of the Drosophila ovary. Cell 137: 522–535 [DOI] [PMC free article] [PubMed] [Google Scholar]
- Manakov SA, Pezic D, Marinov GK, Pastor WA, Sachidanandam R, Aravin AA (2015) MIWI2 and MILI have differential effects on piRNA biogenesis and DNA methylation. Cell Rep 12: 1234–1243 [DOI] [PMC free article] [PubMed] [Google Scholar]
- Martin M (2011) Cutadapt removes adapter sequences from high‐throughput sequencing reads. EMBnet J 17: 10–12 [Google Scholar]
- Matsumoto N, Nishimasu H, Sakakibara K, Nishida KM, Hirano T, Ishitani R, Siomi H, Siomi MC, Nureki O (2016) Crystal structure of silkworm PIWI‐clade argonaute siwi bound to piRNA. Cell 167: 484–497 [DOI] [PubMed] [Google Scholar]
- Mohn F, Handler D, Brennecke J (2015) piRNA‐guided slicing specifies transcripts for Zucchini‐dependent, phased piRNA biogenesis. Science 348: 812–817 [DOI] [PMC free article] [PubMed] [Google Scholar]
- Nishida KM, Iwasaki YW, Murota Y, Nagao A, Mannen T, Kato Y, Siomi H, Siomi MC (2015) Respective functions of two distinct siwi complexes assembled during PIWI‐interacting RNA biogenesis in Bombyx germ cells. Cell Rep 10: 193–203 [DOI] [PubMed] [Google Scholar]
- Osanai‐Futahashi M, Suetsugu Y, Mita K, Fujiwara H (2008) Genome‐wide screening and characterization of transposable elements and their distribution analysis in the silkworm, Bombyx mori. Insect Biochem Mol Biol 38: 1046–1057 [DOI] [PubMed] [Google Scholar]
- Ozata DM, Gainetdinov I, Zoch A, O’Carroll D, Zamore PD (2019) PIWI‐interacting RNAs: small RNAs with big functions. Nat Rev Genet 20: 89–108 [DOI] [PubMed] [Google Scholar]
- Patil AA, Tatsuke T, Mon H, Lee JM, Morokuma D, Hino M, Kusakabe T (2017) Molecular characterization of mitochondrial Zucchini and its relation to nuage‐piRNA pathway components in Bombyx mori ovary‐derived BmN4 cells. Biochem Biophys Res Commun 493: 971–978 [DOI] [PubMed] [Google Scholar]
- Patil VS, Kai T (2010) Repression of retroelements in Drosophila germline via piRNA pathway by the Tudor domain protein Tejas. Curr Biol CB 20: 724–730 [DOI] [PubMed] [Google Scholar]
- Pertea G, Pertea M (2020) GFF utilities: GffRead and GffCompare. F1000Res 9: 304 [DOI] [PMC free article] [PubMed] [Google Scholar]
- Quinlan AR, Hall IM (2010) BEDTools: a flexible suite of utilities for comparing genomic features. Bioinformatics 26: 841–842 [DOI] [PMC free article] [PubMed] [Google Scholar]
- Saito K, Ishizu H, Komai M, Kotani H, Kawamura Y, Nishida KM, Siomi H, Siomi MC (2010) Roles for the Yb body components Armitage and Yb in primary piRNA biogenesis in Drosophila . Genes Dev 24: 2493–2498 [DOI] [PMC free article] [PubMed] [Google Scholar]
- Schindelin J, Arganda‐Carreras I, Frise E, Kaynig V, Longair M, Pietzsch T, Preibisch S, Rueden C, Saalfeld S, Schmid B et al (2012) Fiji: an open‐source platform for biological‐image analysis. Nat Methods 9: 676–682 [DOI] [PMC free article] [PubMed] [Google Scholar]
- Shoji M, Tanaka T, Hosokawa M, Reuter M, Stark A, Kato Y, Kondoh G, Okawa K, Chujo T, Suzuki T et al (2009) The TDRD9‐MIWI2 complex is essential for piRNA‐mediated retrotransposon silencing in the mouse male germline. Dev Cell 17: 775–787 [DOI] [PubMed] [Google Scholar]
- Siomi MC, Sato K, Pezic D, Aravin AA (2011) PIWI‐interacting small RNAs: the vanguard of genome defence. Nat Rev Mol Cell Biol 12: 246–258 [DOI] [PubMed] [Google Scholar]
- Tauber D, Tauber G, Khong A, Van Treeck B, Pelletier J, Parker R (2020) Modulation of RNA condensation by the DEAD‐box protein eIF4A. Cell 180: 411–426 [DOI] [PMC free article] [PubMed] [Google Scholar]
- Weick E‐M, Miska EA (2014) piRNAs: from biogenesis to function. Development 141: 3458–3471 [DOI] [PubMed] [Google Scholar]
- Xiol J, Spinelli P, Laussmann M, Homolka D, Yang Z, Cora E, Couté Y, Conn S, Kadlec J, Sachidanandam R et al (2014) RNA clamping by Vasa assembles a piRNA amplifier complex on transposon transcripts. Cell 157: 1698–1711 [DOI] [PubMed] [Google Scholar]
- Zhu L, Masaki Y, Tatsuke T, Li Z, Mon H, Xu J, Lee JM, Kusakabe T (2013) A MC motif in silkworm Argonaute 1 is indispensible for translation repression. Insect Mol Biol 22: 320–330 [DOI] [PubMed] [Google Scholar]
- Zhu L, Mon H, Xu J, Lee JM, Kusakabe T (2015) CRISPR/Cas9‐mediated knockout of factors in non‐homologous end joining pathway enhances gene targeting in silkworm cells. Sci Rep 5: 18103 [DOI] [PMC free article] [PubMed] [Google Scholar]
Associated Data
This section collects any data citations, data availability statements, or supplementary materials included in this article.
Supplementary Materials
Appendix
Expanded View Figures PDF
Table EV1
Review Process File
Data Availability Statement
The sequencing data reported in this paper have been deposited at the DDBJ database (https://www.ddbj.nig.ac.jp) under accession number DRA010464 (https://ddbj.nig.ac.jp/DRASearch/submission?acc=DRA010464) and DRA011372 (https://ddbj.nig.ac.jp/DRASearch/submission?acc=DRA011372). All other data are available from the authors upon reasonable request.


