

Abstract
Objectives
Humoral and cellular immunity to SARS‐CoV‐2 following COVID‐19 will likely contribute to protection from reinfection or severe disease. It is therefore important to characterise the initiation and persistence of adaptive immunity to SARS‐CoV‐2 amidst the ongoing pandemic.
Methods
Here, we conducted a longitudinal study on hospitalised moderate and severe COVID‐19 patients from the acute phase of disease into convalescence at 5 and 9 months post‐symptom onset. Utilising flow cytometry, serological assays as well as B cell and T cell FluoroSpot assays, we assessed the magnitude and specificity of humoral and cellular immune responses during and after human SARS‐CoV‐2 infection.
Results
During acute COVID‐19, we observed an increase in germinal centre activity, a substantial expansion of antibody‐secreting cells and the generation of SARS‐CoV‐2‐neutralising antibodies. Despite gradually decreasing antibody levels, we show persistent, neutralising antibody titres as well as robust specific memory B cell responses and polyfunctional T cell responses at 5 and 9 months after symptom onset in both moderate and severe COVID‐19 patients.
Conclusion
Our findings describe the initiation and, importantly, persistence of cellular and humoral SARS‐CoV‐2‐specific immunological memory in hospitalised COVID‐19 patients long after recovery, likely contributing towards protection against reinfection.
Keywords: antibodies, antibody‐secreting cells, circulating T follicular helper cells, COVID‐19, germinal centres, SARS‐CoV‐2
This is a longitudinal study on hospitalised moderate and severe COVID‐19 patients from the acute phase of disease into convalescence at 5 and 9 months post‐symptom onset. During acute COVID‐19, we observed an increase in germinal centre activity, a substantial expansion of antibody‐secreting cells and the generation of SARS‐CoV‐2‐neutralising antibodies. Despite gradually decreasing antibody levels, we show persistent, neutralising antibody titres as well as robust specific memory B cell responses and polyfunctional T cell responses at 5 and 9 months after symptom onset in both moderate and severe COVID‐19 patients.
![]()
Introduction
Severe acute respiratory syndrome coronavirus 2 (SARS‐CoV‐2), the causative agent of coronavirus disease 2019 (COVID‐19), emerged in late 2019 and has since led to a pandemic resulting in deaths of more than 2 million people within just 1 year. 1 , 2 COVID‐19 is primarily a respiratory disease with severity ranging from asymptomatic or mild infection to severe symptoms requiring hospitalisation with oxygen supplementation or mechanical ventilation. The development of adaptive immune responses, encompassing neutralising antibodies, B cells and T cells, is crucial to control and clear viral infections. 3 Studying early cellular and humoral responses to infection with SARS‐CoV‐2 can give insights into the development of immune memory. These early responses can be assessed by germinal centre activity via plasma CXCL13 levels and activated circulating T follicular helper cell (cTfh) frequencies as surrogate markers, 4 , 5 , 6 , 7 as well as antigen‐specific antibody‐secreting cell (ASC) expansion. 8 , 9 , 10 , 11 Once infection is cleared, neutralising antibodies and antigen‐specific memory B cells and T cells play an important role in preventing reinfection. Recent reports suggest that cellular and humoral immunity to SARS‐CoV‐2 lasts up to at least 8 months post‐infection. 12 , 13 However, studies of related viruses including SARS‐CoV‐1 and Middle Eastern respiratory syndrome (MERS) coronavirus have shown that specific cellular memory persists longer than antibodies after infection 14 , 15 and similar patterns may be expected for SARS‐CoV‐2. It is therefore important to characterise, in detail, the specificity and magnitude of adaptive immune responses throughout the course of disease and during recovery, in order to better understand the development and longevity of protective immunity.
Here, we provide an in‐depth assessment of the initiation and persistence of antigen‐specific humoral and cellular immune responses in hospitalised COVID‐19 patients, suffering from moderate or severe disease. In this context, we report increased germinal centre activity and ASC expansion during the acute phase followed by persistent SARS‐CoV‐2‐specific humoral and cellular immunity. Neutralising antibodies, memory B cells, and polyfunctional memory T cells specific to SARS‐CoV‐2 were detectable in all COVID‐19 patients in convalescence, regardless of disease severity, potentially providing long‐term protection against reinfection.
Results
Clinical features and outcome of hospitalised COVID‐19 patients
Twenty‐six hospitalised COVID‐19 patients were included in this study, ten of whom were treated at the infectious disease unit (IDU) and are referred to as moderate, while sixteen patients were treated at the intensive care unit (ICU) and are referred to as severe (Figure 1a; Table 1). The present patient cohorts were part of the Karolinska KI/K COVID‐19 Immune Atlas project, where characterisations of other immune cell subsets during acute COVID‐19 have been described. 16 , 17 , 18 , 19 , 20 , 21 When possible, these patients were sampled longitudinally at 5 and 9 months after symptom onset (Figure 1a; Table 1). Patients were predominantly male, with comparable age between moderate and severe groups (Figure 1b and c). Patients in both groups were also sampled at similar time points since symptom onset during the acute phase, with a median of 14 days for both groups (Figure 1d; Table 1). Patients treated in the ICU required longer supplemental oxygen treatment compared to moderate patients (a median of 2 days for moderate and a median of 21 days for severe) (Figure 1e). Respiratory organ failure assessment score (SOFA‐R) ranged from 1 to 2 for moderate and 2 to 4 for severe patients. 22 Patients showed considerable alterations from normal values in clinical chemistry parameters, including inflammatory and tissue damage markers, and significant differences were observed between the moderate and severe groups in several of those parameters during the acute phase of COVID‐19 (Supplementary figure 1). Both patient groups presented with characteristic symptoms of COVID‐19 and suffered from common comorbidities (Figure 1f; Table 1). Four patients deceased, all of whom were in the severe group (Figure 1f; Table 1). The majority of patients followed up at 5‐month convalescence had returned to normal levels in inflammatory and tissue damage markers (Supplementary figure 1).
Figure 1.
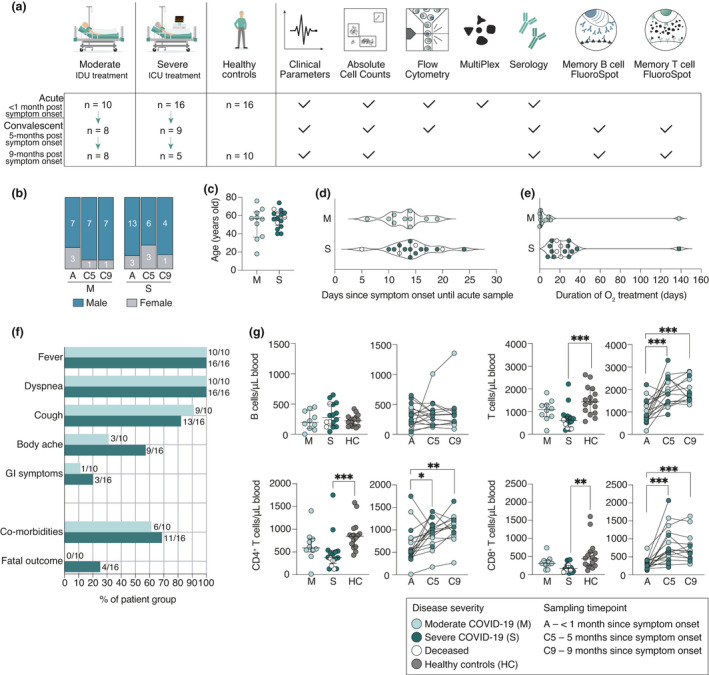
Study design and clinical features of hospitalised COVID‐19 patients. (a) Schematic overview of patient cohorts and experimental setup. IDU, infectious disease unit; ICU, intensive care unit. (b) Sex and (c) age distribution among patients. (d) The number of days from symptom onset to acute sample. (e) The duration of supplemental oxygen treatment among patients during the acute phase. (f) Symptoms, comorbidities and outcome of patients. GI, gastrointestinal symptoms. (g) Absolute cell numbers in peripheral blood of patients during the acute phase, convalescence and in healthy controls. All scatter plots show median and IQR where n = 10 for moderate, n = 16 for severe, n = 16 for healthy control, n = 17 for C5 and n = 13 for C9. Statistical significance in (g) (M, S and HC) was assessed by the Kruskal–Wallis test corrected with Dunn’s multiple comparisons test. Statistical significance in longitudinal plots (g) (A, C5 and C9) was assessed with the Wilcoxon signed‐rank test. *P < 0.05; **P < 0.01; ***P < 0.001.
Table 1.
Demographics and clinical characteristics of COVID‐19 patients
| Acute COVID‐19 |
Convalescent COVID‐19 5 months |
Convalescent COVID‐19 9 months |
||||
|---|---|---|---|---|---|---|
| Moderate | Severe | Moderate | Severe | Moderate | Severe | |
| Total n | 10 | 16 | 8 | 9 | 8 | 5 |
| Age, years, median (range) | 57 (18–76) | 58 (40–74) | 58 (34–76) | 56 (40–63) | 58 (34–76) | 61 (45–63) |
| Male, n | 7 | 13 | 7 | 6 | 7 | 4 |
| Female, n | 3 | 3 | 1 | 3 | 1 | 1 |
| Symptom onset to sampling, days, median (range) | 14 (6–19) | 14 (5–24) | 155 (144–171) | 155 (142–172) | 274 (264–287) | 278 (263–284) |
| Total duration of hospitalisation, median days (range) | 8 (5–39) | 19 (10–138) | 8 (5–39) | 17 (10–57) | 8 (5–39) | 15 (10–49) |
| At least one comorbidity a , n | 6 | 11 | 6 | 6 | 6 | 4 |
| Fatal outcome, n | 0 | 4 | 0 | 0 | 0 | 0 |
| Peak supplemental oxygen treatment | ||||||
| No oxygen, n | 2 | 0 | 1 | 0 | 1 | 0 |
| Low flow, n | 7 | 3 | 6 | 3 | 6 | 2 |
| High flow, n | 1 | 0 | 1 | 0 | 1 | 0 |
| Mechanical ventilation/ECMO, n | 0 | 13 | 0 | 6 | 0 | 3 |
| Treatment | ||||||
| ICU treatment, n | 0 | 16 | 0 | 9 | 0 | 5 |
| Steroids before acute sampling, n | 2 | 11 | 2 | 5 | 2 | 3 |
| Antibiotics before acute sampling, n | 3 | 11 | 2 | 6 | 2 | 3 |
| Anticoagulants before acute sampling, n | 10 | 14 | 8 | 9 | 8 | 5 |
| Specific treatment before acute sampling b , c , n | 0 | 2 b , c | 0 | 1 b | 0 | 1 b |
ECMO, extracorporeal membrane oxygenation; ICU, intensive care unit.
Hypertension, type II diabetes, asthma, obesity, obstructive sleep apnoea syndrome, chronic hepatitis B infection, coronary heart disease.
Remdesivir.
Tocilizumab.
Absolute numbers of lymphocyte subsets in peripheral blood were also assessed during the acute phase and at 5‐ and 9‐month convalescence. During the acute phase of the disease, there was a significant decrease in total T cell numbers in severe patients (median 603 cells µL–1, P < 0.001), but not in moderate patients (median 1092 cells µL–1, P = 0.46) compared to healthy controls (median 1435 cells µL–1). The severe patient group also exhibited a decrease in both CD4+ T cells (median 376 cells µL–1, P < 0.001) and CD8+ T cells (median 167 cells µL–1, P = 0.002) compared to healthy controls (median 851 cells µL–1 and 438 cells µL–1, respectively), previously described by Sekine et al. 16 (Figure 1g). The absolute T cell numbers returned to healthy control levels by the 5‐month convalescence time point (Figure 1g). Total B cell numbers in peripheral blood of COVID‐19 patients were comparable to healthy control levels throughout the study (Figure 1g).
Increased germinal centre activity in COVID‐19 patients
Germinal centre activity was assessed using the surrogate marker, CXCL13, in hospitalised COVID‐19 patients and healthy controls. The levels of plasma CXCL13 were significantly elevated in both moderate (median 274 pg mL–1, P = 0.003) and severe patients (median 361 pg mL–1, P < 0.001) compared to healthy controls (median 167 pg mL–1), during acute COVID‐19 (Figure 2a). Although a trend towards higher CXCL13 levels was observed in the severe patient group compared to moderate patients, this was not statistically significant (P = 0.97). This led us to measure the frequencies of activated cTfh cells in peripheral blood as an additional indication of germinal centre activity (Figure 2b). A significant increase in the frequencies of total activated cTfh cells (CD4+ CXCR5+ ICOS+ PD1+) was observed in both moderate (median 3.97%, P = 0.005) and severe (median 4.49%, P < 0.001) patient groups compared to healthy controls (median 0.69%) (Figure 2c). Increased activation of Th1‐polarised cTfh (CD4+ CXCR5+ CXCR3+ ICOS+ PD1+) cells was also detected in both moderate (median 8.46%, P < 0.001) and severe patients (median 10.6%, P < 0.001) compared to healthy controls (median 1.1%) (Figure 2d). Meanwhile, the Th2/Th17‐polarised subset (CD4+ CXCR5+ CXCR3‐ ICOS+ PD1+) activation was significantly increased only in severe patients compared to healthy controls (median 1.96 vs 0.5%, P = 0.004) (Figure 2e). At 5 months post‐infection, the frequencies of activated cTfh cells declined to healthy control levels (Figure 2c–e).
Figure 2.
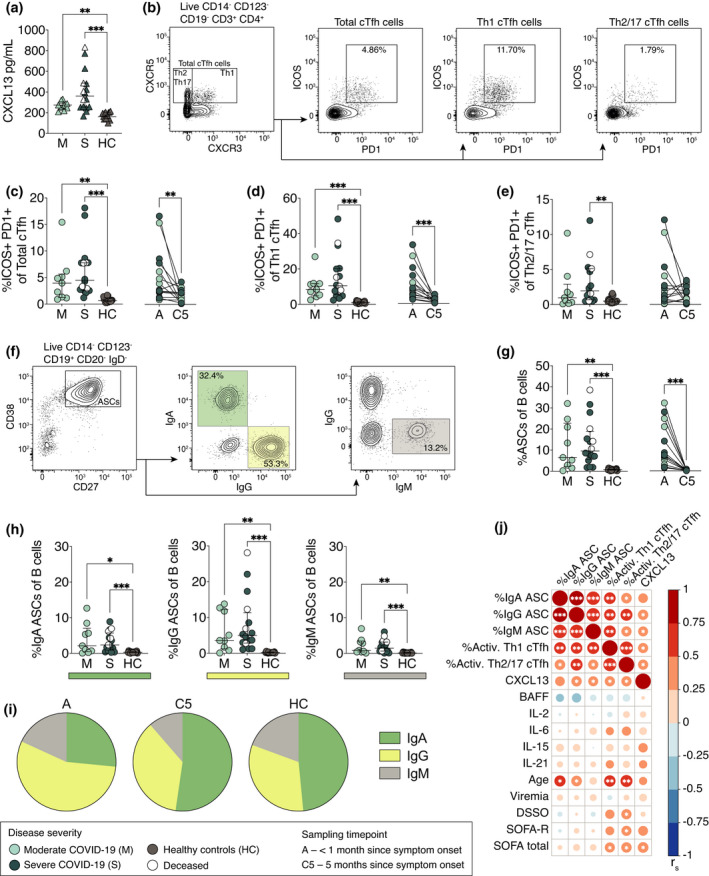
Increased germinal centre activity and expansion of antibody‐secreting cells in COVID‐19 patients. (a) CXCL13 plasma concentrations in moderate and severe COVID‐19 patients at the acute phase, as well as in healthy controls. (b) Flow cytometry gating strategy of total, Th1‐ and Th2/17‐polarised cTfh cells in a representative COVID‐19 patient. (c–e) Frequencies of activated (ICOS+ PD1+) total, Th1‐polarised and Th2/17‐polarised cTfh cells in patients and healthy controls. (f) Flow cytometry gating strategy of antibody‐secreting cells (ASCs) and their immunoglobulin expression in a representative COVID‐19 patient. (g) Frequencies of ASCs within the CD19+ B cell population in patients and healthy controls. (h) Frequencies of IgA‐, IgG‐ and IgM‐ASC subsets within the CD19+ B cell population. (i) Proportions of ASC Ig isotypes in patients and healthy controls. (j) Spearman’s correlation matrix where colour scale and size of the circles indicate Spearman’s correlation coefficient (r s). Data are from COVID‐19 patients sampled during the acute phase. DSSO, days since symptom onset; SOFA‐R, respiratory sequential organ failure assessment score; SOFA total, total sequential organ failure assessment score. All scatter plots show median and IQR where n = 10 for moderate, n = 16 for severe, n = 16 for healthy control and n = 17 for C5. Statistical significance (a, c–e, g, h) (M, S and HC) was assessed by the Kruskal–Wallis test corrected for with Dunn’s multiple comparisons test. Statistical significance in longitudinal plots (c–e, g) (A and C5) was assessed with the Wilcoxon signed‐rank test. * P < 0.05; ** P < 0.01; and *** P < 0.001.
Significant expansion of ASCs dominated by the IgG subset in COVID‐19 patients
Freshly isolated PBMCs were analysed using flow cytometry to determine the magnitude of ASC expansion during acute SARS‐CoV‐2 infection and at 5‐month convalescence (Figure 2f). A significant increase in ASC frequencies within the CD19+ B cell population was observed in both moderate (median 6.5%, P = 0.003) and severe patients (median 9.6%, P < 0.001) during the acute phase compared to healthy controls (median 0.76%) (Figure 2g). Interestingly, severe patients who later deceased showed an above‐median frequency of total ASCs (Figure 2g). At 5 months after the onset of symptoms, ASC frequencies in COVID‐19 patients decreased to healthy control levels (Figure 2g). Acute ASC expansion was further assessed for surface and intracellular expression of IgA, IgG and IgM (Figure 2f). A significant expansion in all three Ig‐ASC subsets was observed in both moderate and severe patients compared to healthy controls (Figure 2h). The ASC expansion was dominated by the IgG‐ASC subset (55% of ASCs) whereas IgA‐ASCs dominated during convalescence and in healthy controls (50% and 47% of ASCs, respectively) (Figure 2i). We observed significant associations between ASC expansion, cTfh activation and CXCL13 levels as well as age, but no associations were found between these parameters and viraemia, BAFF, IL‐2, IL‐21, IL‐15 or IL‐6 plasma levels at acute sampling (Figure 2j). To summarise, an active germinal centre response was observed as indicated by increased CXCL13 levels in plasma and the activation of cTfh cells resulting in the expansion of ASCs during acute infection with SARS‐CoV‐2.
SARS‐CoV‐2‐specific antibody levels during acute COVID‐19 are associated with disease severity
We next assessed the levels and dynamics of SARS‐CoV‐2‐specific antibodies during the acute phase of COVID‐19, as well as at 5 and 9 months since symptom onset (n = 26, 17 and 13, respectively). During the acute phase of COVID‐19, 23 of the 26 patients had neutralising antibody titres of > 10 (Figure 3a). The three patients with undetectable neutralising antibodies were also negative for IgG/IgM specific to SARS‐CoV‐2 receptor‐binding domain (RBD). However, 18 and 21 out of the 26 patients had detectable levels of spike subunit 1 (S1)‐specific and nucleocapsid (N)‐specific IgG antibodies, respectively, at the acute phase (Figure 3a). S1‐ and N‐specific IgG levels were higher in severe compared to moderate patients (median OD ratio 7.9 vs 0.7, P = 0.007 and median OD ratio 5.1 vs 1.86, P = 0.04, respectively). Severe patients also had significantly higher neutralising antibody titres compared to moderate patients (median titre 1400 vs 55, P = 0.02), despite comparable sampling time points between the two patient cohorts (median 14 days since symptom onset) (Figures 1d and 3a). All patients sampled later than 15 days after symptom onset had detectable levels of both S1‐ and N‐IgG as well as neutralising antibodies (Figure 3b). The four patients who later deceased had neutralising antibody titres between 120 and 960. A strong positive correlation between S1‐IgG, N‐IgG and neutralising antibody titres was observed during the acute phase, and both S1‐ and N‐IgG levels correlated with the number of days since symptom onset (Figure 3c). Higher antibody levels during acute COVID‐19 were also associated with higher degree of respiratory failure (SOFA‐R), but not age (Figure 3c).
Figure 3.
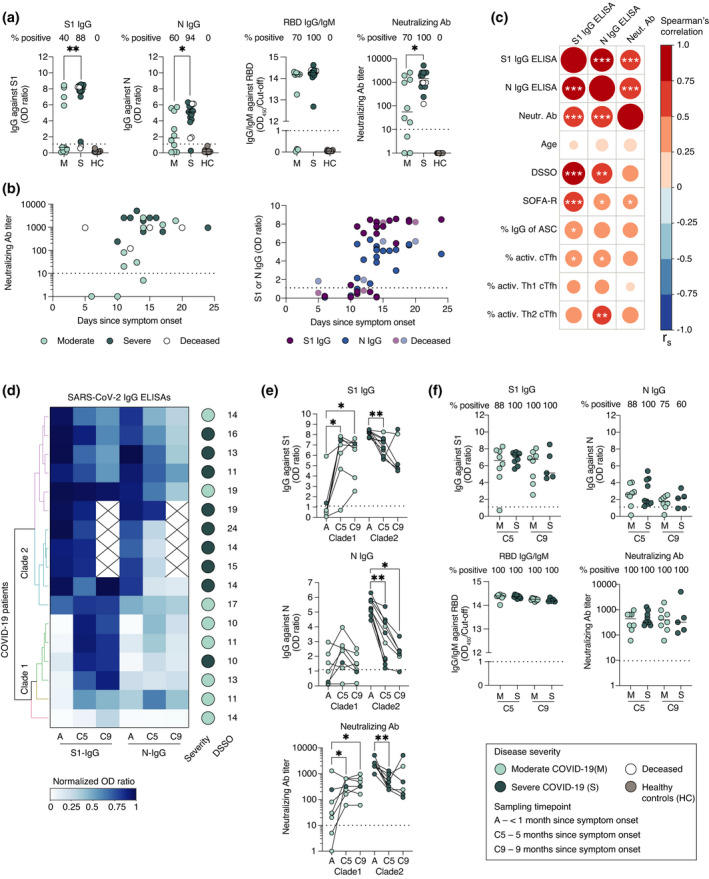
SARS‐CoV‐2‐specific antibody levels and dynamics during acute COVID‐19 and in convalescence. (a) S1‐IgG and N‐IgG antibody levels, positivity for RBD‐IgG/IgM and SARS‐CoV‐2‐neutralising antibody titres during acute phase of COVID‐19 in moderate and severe patients, as well as healthy controls. (b) Neutralising antibody titres and S1‐IgG and N‐IgG antibody levels in regard to the number of days since symptom onset. (c) Spearman’s correlation matrix where colour scale and size of the circles indicate Spearman’s correlation coefficient (r s). Data are from all COVID‐19 patients sampled during the acute phase. ASC, antibody‐secreting cells, DSSO, days since symptom onset, SOFA‐R, respiratory sequential organ failure assessment score. (d) Clustering analysis based on S1‐IgG and N‐IgG levels in longitudinally sampled COVID‐19 patients. The blue colour scale indicates normalised OD ratio values from S1‐IgG and N‐IgG ELISAs. (e) S1‐IgG, N‐IgG and neutralising antibody levels in longitudinally sampled patients divided into two clades based on clustering analysis in (d). (f) Comparisons of antibody levels between moderate and severe patients at 5 and 9 months after symptom onset. All scatter plots show median where n = 26 for acute phase, n = 17 for C5, n = 13 for C9 and n = 16 for HC. Dotted horizontal lines represent threshold for positivity in each assay (defined by the manufacturer for ELISAs and < 10 for neutralisation). Statistical significance in (a) was assessed using the Mann–Whitney U‐test, in (e) using the Wilcoxon signed‐rank test and in (f ) using the Kruskal–Wallis test corrected with Dunn’s multiple comparisons test. *P < 0.05; **P < 0.01; ***P < 0.001.
SARS‐CoV‐2‐specific antibodies persist at least 9 months after symptom onset
Next, we assessed the dynamics of antibody levels in COVID‐19 patients sampled longitudinally. Clustering analysis based on S1‐ and N‐IgG antibody levels was performed at the acute phase and at 5 and 9 months since symptom onset (Figure 3d). The patients clustered into two major clades based on the dynamics of their antibody levels (Figure 3d). Patients in clade 1 mainly exhibited significantly increased S1‐specific IgG levels and neutralising antibody titres at 5 months compared to the acute phase (median OD ratio 7 vs 0.6, P = 0.02 and median titre 320 vs 30, P = 0.05, respectively) (Figure 3e). N‐specific IgG levels also slightly increased in clade 1 patients between the acute phase and 5 months, but the change was not statistically significant (Figure 3e). Meanwhile, patients in clade 2 exhibited a significant decrease in S1‐IgG, N‐IgG levels and neutralising antibody titres from the acute phase to 5 months (median OD ratio 8.3 vs 7, P = 0.002; median OD ratio 5.2 vs 3.2, P = 0.002; median titre 2560 vs 400, P = 0.002, respectively) (Figure 3e). S1‐IgG, N‐IgG levels and neutralising antibody titres in both clades remained unchanged between the 5 and 9 months time points (Figure 3e).
Patients from clade 1 were sampled relatively early in the acute phase (a median of 11 days since symptom onset), but also primarily consisted of moderate patients (5 of 6), while patients in clade 2 were sampled slightly later in the acute phase (median 15 days since symptom onset) and primarily consisted of severe patients (8 of 11) (Figure 3d).
Notably, one patient in the severe group had a neutralising antibody titre of 1920 at the acute phase, and a titre of 480 at 5 months, but reached a titre of 5120 at 9 months. S1‐IgG, but not N‐IgG, levels also increased in this patient at 9 months (Figure 3e). The patient did not receive a SARS‐CoV‐2 vaccine throughout the course of this study; therefore, the increase in antibody levels at 9 months may be the result of an anamnestic response following re‐exposure to SARS‐CoV‐2.
At 5 and 9 months, all followed‐up patients had detectable levels of S1‐IgG, RBD‐IgG/IgM and neutralising antibodies, while N‐IgG levels decreased to borderline positive values in four patients (Figure 3f). Neutralising antibody titres ranged from 60 to 1860 in moderate and 120 to 5120 in severe patients (Figure 3f). However, there was no significant difference in neutralising antibody titres between moderate and severe patients at either 5 or 9 months (median titre 440 vs 320, P = 0.52 and median titre 400 vs 320, P = 0.86, respectively), suggesting that regardless of the level of care required during acute COVID‐19, hospitalised patients maintain comparable antibody levels in convalescence (Figure 3f).
Robust S1‐ and N‐specific B cell memory persists at least 9 months after symptom onset
We next assessed the presence of SARS‐CoV‐2‐specific memory B cells in convalescent COVID‐19 patients at 5 and 9 months post‐symptom onset and in pre‐pandemic healthy controls (Figure 4a; Supplementary figure 2). We utilised a FluoroSpot assay which allows detection of S1‐ and N‐specific memory B cell‐derived antibody‐secreting cells (mASCs), secreting either IgG or IgA following polyclonal B cell stimulation (Figure 4a; Supplementary figure 2). Based on the positive threshold calculated using pre‐pandemic healthy controls, S1‐specific IgG‐mASCs were detected in all patients at both 5 and 9 months (median 781 and 676 mASCs/106 PBMCs, respectively) (Figure 4b). Meanwhile, N‐specific IgG‐mASCs were detected in all patients at 5 months and in 9 of 10 patients at 9 months (median 148 and 119 mASCs/106 PBMCs, respectively) (Figure 4b). Very few patients had detectable S1‐ (1 patient) or N‐specific (4 patients) IgA‐mASCs after stimulation (Supplementary figure 2).
Figure 4.
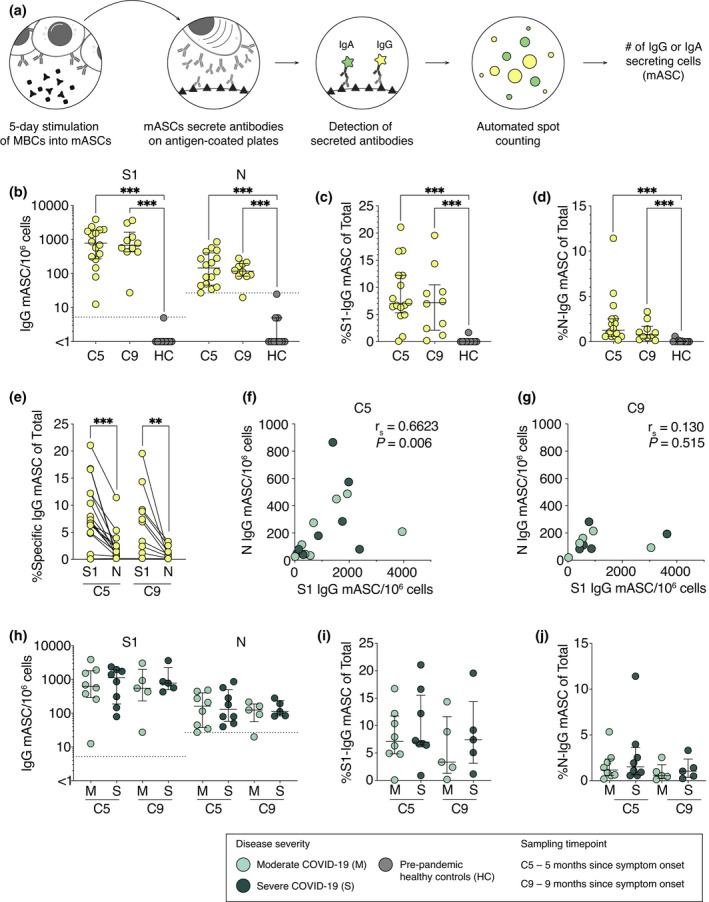
Robust S1‐ and N‐specific B cell memory persists at least 9 months after symptom onset. (a) Schematic of memory B cell FluoroSpot assay. (b) Numbers of S1‐ and N‐specific memory B cell‐derived IgG‐ASCs (mASCs) at 5‐ and 9‐month convalescence and in pre‐pandemic healthy controls. Frequencies of (c) S1‐ and (d) N‐specific mASCs within total IgG‐mASC pool following polyclonal B cell stimulation. (e) Comparison between the frequencies of S1‐ and N‐specific IgG‐mASCs within total mASC pool at 5 and 9 months. (f, g) Spearman’s correlation between S1‐ and N‐specific mASC numbers at 5 and 9 months. r s, Spearman’s correlation coefficient. (h–j) Comparison between moderate and severe COVID‐19 patients in regard to numbers and frequencies of S1‐ and N‐specific mASC at 5 and 9 months. Dotted threshold lines in (b) and (h) defined by average S1‐ or N‐mASC numbers in pre‐pandemic healthy controls plus three standard deviations. Median with IQR is plotted in all scatter plots where n = 16 for C5, n = 10 for C9, n = 10 for HC. Statistical significance (b–d, h–j) was assessed using the Mann–Whitney U‐test and (e) the Wilcoxon signed‐rank test. **P < 0.01; ***P < 0.001.
To determine the relative abundance of SARS‐CoV‐2‐specific memory B cells within each patient, we measured the frequencies of S1‐ and N‐specific mASCs within the total IgG‐secreting mASC pool after the stimulation. There was a high variation in the frequencies of S1‐ or N‐specific mASCs between patients, ranging from 0.2% to 21% of total IgG‐mASCs (Figure 4c and d). At 5 months, a higher frequency of S1‐specific mASCs than N‐specific mASCs out of the total IgG‐mASCs was detected in patients (median 7 vs 1.2%, P < 0.001) (Figure 4c and e). A similar pattern was observed at 9 months (median 7.2 vs 0.7%, P = 0.002) (Figure 4c and e). The numbers of S1‐specific mASCs were shown to positively correlate with the numbers of N‐specific mASCs at 5 months post‐symptom onset, but not at 9 months (Figure 4f and g). Finally, disease severity during the acute phase of COVID‐19 had no effect on the magnitude of memory B cell response in convalescence (Figure 4h‐j).
Polyfunctional SARS‐CoV‐2‐specific T cell memory persists at least 9 months after symptom onset
To determine whether T cell memory is generated and sustained in COVID‐19 patients, we utilised a FluoroSpot assay to simultaneously measure the number of T cells secreting IFN‐γ, IL‐2 and/or TNF in response to stimulation with SARS‐CoV‐2 peptides (Figure 5a; Supplementary figure 2). In addition to determining SARS‐CoV‐2‐specific T cell numbers, relative amounts of secreted cytokines, as well as cytokine co‐expression patterns, were assessed, allowing for a characterisation of polyfunctional T cell responses. PBMCs from COVID‐19 patients sampled at 5 and 9 months since symptom onset as well as pre‐pandemic healthy controls were stimulated with three different SARS‐CoV‐2 peptide pools (Figure 5b). Numbers of all cells secreting cytokines after peptide stimulation were first enumerated by detecting either IFN‐γ, IL‐2 or TNF (Figure 5c). Total IFN‐γ, as well as IL‐2‐secreting cell numbers, were significantly higher in COVID‐19 patients than in pre‐pandemic healthy controls after stimulation with all three peptide pools (Figure 5c). Meanwhile, TNF‐secreting cell numbers alone could not distinguish SARS‐CoV‐2‐specific responses from background responses (Figure 5c). High numbers of TNF‐only producing cells in healthy controls may be because of unspecific TNF secretion by other PBMC subsets than T cells.
Figure 5.
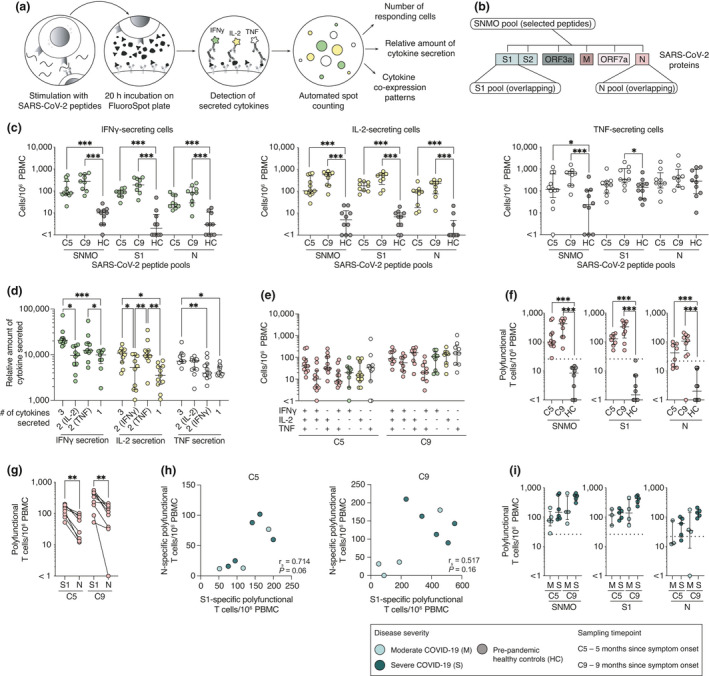
Polyfunctional SARS‐CoV‐2‐specific T cell memory persists at least 9 months after symptom onset. (a) Schematic of memory T cell FluoroSpot assay. (b) SARS‐CoV‐2 peptide pools used in memory T cell stimulation. (c) Total number of cells responding to stimulation by secreting IFN‐γ, IL‐2 or TNF at 5‐ and 9‐month convalescence and in pre‐pandemic healthy controls. (d) Average spot volume (relative amount of cytokine secreted) for IFN‐γ, IL‐2 or TNF produced by cells secreting all three, two or one cytokine after SNMO peptide pool stimulation at 5 months. (e) Cytokine co‐expression patterns of responding T cells after stimulation with SNMO peptide pool at 5 and 9 months. (f) Total number of polyfunctional T cells (cells secreting at least two cytokines) after stimulation. (g) Comparison between the numbers of polyfunctional T cells after the stimulation with S1 or N peptide pools for each patient. (h) Spearman’s correlation between S1‐ and N‐specific polyfunctional T cell numbers at 5 and 9 months. r s, Spearman’s correlation coefficient. (i) Comparison of polyfunctional T cell numbers responding to SARS‐CoV‐2 peptide pools between moderate and severe patients at 5 and 9 months. Median and IQR are plotted in all scatter plots where at 5 months n = 11 for SNMO, n = 8 for S1, n = 8 for N; and at 9 months n = 9 for SNMO, n = 9 for S1, n = 9 for N; and for HC, n = 10 for SNMO, S1 and N. Dotted horizontal lines represent threshold for positive response defined by average polyfunctional T cell numbers in pre‐pandemic healthy controls after stimulation plus three standard deviations. Statistical significance in (c, f and i) was assessed using the Mann–Whitney U‐test, in (d) using the non‐parametric Friedman test and in (g) using the Wilcoxon signed‐rank test. *P < 0.05; **P < 0.01; ***P < 0.001.
Next, we assessed relative amounts of IFN‐γ, IL‐2 or TNF secreted by responding cells. Polyfunctional cells, especially those secreting all three cytokines at once, on average secreted significantly more cytokines than single‐functional cells (Figure 5d). This led us to investigate cytokine co‐expression patterns and determine the numbers of polyfunctional cells responding to SARS‐CoV‐2 peptide pools. A large fraction of cells responding to SARS‐CoV‐2 peptide stimulation were indeed polyfunctional T cells, with comparable cytokine co‐expression patterns at 5 and 9 months after symptom onset (Figure 5e). Based on the positive threshold calculated using pre‐pandemic healthy controls, robust and significant polyfunctional T cell responses to at least one of the SARS‐CoV‐2 peptide pools were detected at 5 or 9 months in all patients (Figure 5f). Positive responses from patients to the SNMO peptide pool ranged from 28 to 653 specific T cells/106 PBMCs, the S1 pool from 52 to 553 T cells/106 PBMCs and the N pool from 25 to 210 specific T cells/106 PBMCs. Significantly more polyfunctional T cells were detected responding to the S1 peptide pool than to the N peptide pool at both 5 months (median 129 vs 43 T cells/106 PBMCs, P = 0.008) and 9 months (median 337 vs 113 specific T cells/106 PBMCs, P = 0.004), a pattern similar to that observed in the memory B cell FluoroSpot (Figures 4e and 5g). Patients with higher S1‐specific polyfunctional T cell numbers also had higher N‐specific polyfunctional T cell numbers at 5 months, although this correlation was not significant at the 9‐month time point (Figure 5h). We did not observe significant differences between moderate and severe COVID‐19 patients regarding the number of polyfunctional T cell responses, at either 5 or 9 months after infection (Figure 5i).
Discussion
The COVID‐19 pandemic is one of the largest global health challenges that we have faced in the last century. It is hence imperative to assess the development and the longevity of adaptive immunity in infected persons. In this study, we systematically assessed the initiation and longevity of specific humoral and cellular immune responses to SARS‐CoV‐2 in moderately and severely sick COVID‐19 patients, who were longitudinally sampled at the acute phase and at 5 and 9 months after symptom onset.
The assessment of germinal centre activity during acute COVID‐19 provides insights into the initiation of adaptive immunity, specifically humoral responses. The activation of germinal centres gives rise to both short‐ and long‐lived ASCs as well as memory B cells that will respond quickly upon re‐exposure to SARS‐CoV‐2. Germinal centre reactions drive the selection of high‐affinity IgG+ B cells that ultimately confer effective humoral immunity. 23 , 24 The absence of germinal centres was recently observed in lymph nodes and spleens from post‐mortem COVID‐19 patients 25 suggesting that SARS‐CoV‐2 infection, in some cases, may not trigger efficient development of protective immunity and result in fatal outcome. Although we did not assess germinal centre activity directly within lymph nodes, we used plasma CXCL13 levels as a surrogate marker 4 and found increased levels of CXCL13 in both moderate and severe patients. Other recent studies have also observed increased levels of CXCL13 with levels higher in severe than in non‐severe COVID‐19 patients. 26 In the present patient cohorts, there was no significant difference in CXCL13 levels between moderate and severe COVID‐19; however, a few patients in the severe group had distinctly high levels. In addition, we observed a significant activation of antiviral Th1‐polarised cTfh cells, another indication of germinal centre activity, in both patient groups, a result consistent with other studies. 16 , 27 , 28 , 29 , 30 , 31 , 32 We also found that higher levels of CXCL13 in plasma positively correlated with the activation of cTfh cells. Our findings suggest that germinal centre reactions have indeed taken place in secondary lymphoid organs during acute COVID‐19 potentially leading to ASC expansion as well as contribution to the generation of long‐lived plasma cells and memory B cells.
The expansion of ASCs in peripheral blood has been well documented during acute COVID‐19 disease and shown to be SARS‐CoV‐2‐specific. 27 , 33 , 34 We also observed a characteristic increase in ASC expansion during acute COVID‐19 in both severe and moderate patients dominated by the IgG subset; however, no difference was observed between the two patient groups. Expansion of ASCs during viral infections has been shown to be a good predictor of the development of neutralising antibodies and B cell memory. 10 Additionally, during viral infections, ASCs can produce large amounts of antibodies as long as viral shedding occurs, suggesting that ASCs play an active role in infection clearance. 11 We found that the majority of patients had neutralising antibody titres during the acute phase, perhaps originating from the expanded ASC population. Taken together, the observed ASC expansion during acute COVID‐19 may play an important role in SARS‐CoV‐2 clearance and disease control.
A major function of humoral responses during acute infection is to generate memory B cells and long‐lived plasma cells that will produce pathogen‐specific antibodies. Numerous studies have characterised seroconversion kinetics during the acute phase of COVID‐19. 35 , 36 , 37 Although the majority of patients seroconvert between 7 and 14 days after symptom onset, a large variation in SARS‐CoV‐2‐specific antibody levels has been observed. 36 , 38 , 39 , 40 , 41 Therefore, the sampling time point during acute COVID‐19 may determine the antibody levels detected within each patient, and patients sampled earlier may have lower antibody levels compared to sampling later during the acute phase of infection. In this study, we confirmed that seropositivity for SARS‐CoV‐2 antibodies is time‐dependent, as higher antibody levels were observed in patients sampled later during the acute phase. However, moderate and severe COVID‐19 patients in this study were sampled at comparable time points during the acute phase, yet severe patients had significantly higher SARS‐CoV‐2‐specific antibody levels than moderate patients. Our results confirm previous reports, 42 , 43 , 44 showing a positive relationship between degree of disease severity and antibody levels during acute COVID‐19. As the length of the incubation period after exposure to SARS‐CoV‐2 in this patient cohort is unknown, we rely only on self‐reported data for symptom onset when assessing the kinetics of immune responses. We speculate that the severe patients in our study may have had different kinetics of antibody responses compared to the moderate patients and that the generation of high levels of antibodies did not prevent a more severe course of COVID‐19.
Longevity of immunological memory following SARS‐CoV‐2 infection is a question of particular relevance for informing public health policies and predicting the future course of the pandemic. Several studies have demonstrated decreasing antibody levels in COVID‐19 patients over time, leading to concerns for waning immunity. 45 , 46 , 47 However, for a more comprehensive picture of the longevity of immunity, memory B cell and T cell responses should be studied in parallel, as these cells would be important players in providing protection upon re‐exposure to SARS‐CoV‐2. Here, we followed 17 patients for 5 months and 13 of those patients for 9 months after symptom onset, in order to assess antibody dynamics over time. Consistent with other studies, we showed a substantial decline in antibody levels over time; however, all patients followed up to 5 months and 9 months maintained detectable neutralising antibody titres. 12 , 13 In parallel, we measured memory B cell and T cell responses in the same individuals utilising FluoroSpot assays. Recent studies have shown that memory B cells and T cells were detectable up to 8 months post‐infection. 12 , 13 Here, we confirmed these observations as S1‐ and N‐specific IgG memory B cells as well as specific memory T cells were readily detectable in circulation at both 5 and even 9 months post‐symptom onset in all patients within this cohort, although magnitude of these responses was highly variable. We consistently observed a lower magnitude of N‐specific B cell and T cell memory responses, compared to S1‐specific responses. Our findings are in agreement with other reports that have also demonstrated a higher magnitude of spike‐specific memory B cells than N‐specific memory B cells in recovered COVID‐19 patients. 48 , 49
Functional T cell responses to SARS‐CoV‐2 have been detected in both the acute phase of disease and in convalescence, primarily targeting structural proteins including spike, nucleocapsid and membrane based on their higher abundance. 12 , 16 , 32 , 50 , 51 In other disease settings, it has been shown that polyfunctional T cells (secreting more than one cytokine after stimulation) are important contributors to the control of viral infections. 52 , 53 , 54 , 55 These polyfunctional T cells secrete higher amounts of cytokines on a cell basis than single‐functional T cells. 55 , 56 , 57 In this study, polyfunctional T cell responses to SARS‐CoV‐2 peptides were detectable in all COVID‐19 patients, although at varying magnitude. Polyfunctional T cell responses detected in this study, especially T cells co‐secreting all three cytokines measured (i.e. IFN‐γ, IL‐2 and TNF), were also shown to, on average, produce higher amounts of each cytokine than single‐functional cells. We highlight the strength of analysing secretion of multiple cytokines at once, as this approach provides information on cytokine co‐expression patterns and identification of polyfunctional T cells, which are superior in their cytokine secretion capacity and therefore may be important in antiviral defence upon re‐exposure to SARS‐CoV‐2. Asymptomatic COVID‐19 patients have been shown to produce more IFN‐γ and IL‐2 in response to peptide stimulation of whole blood than severely sick COVID‐19 patients, 58 which may reflect the role of Th1 cytokines in the control of SARS‐CoV‐2 infection. However, the FluoroSpot method used cannot distinguish between CD4+ and CD8+ T cells, and thus, we could not assess the responses of these subsets separately. The SNMO peptide pool included selected HLA‐II and HLA‐I restricted epitopes 51 and stimulates both CD4+ and CD8+ T cells. Meanwhile, the S1 and N peptide pools consisted of 15 amino acid long peptides with 11 amino acid overlap, which would primarily target CD4+ T cells, but CD8+ T cell responses may also be induced.
The role of adaptive immunity and protection from clinical disease after re‐exposure to SARS‐CoV‐2 is under active investigation. The exact magnitude of adaptive immune responses to SARS‐CoV‐2 infection required for protection from reinfection remains unclear. However, recent longitudinal studies on larger cohorts suggest that the presence of cellular and humoral immunity is highly associated with prevention from reinfection with SARS‐CoV‐2 and clinical disease. 59 , 60 , 61 Although we did not follow up patients in this cohort regarding PCR positivity for SARS‐CoV‐2 after the acute phase, none of the patients developed clinical COVID‐19 for a second time since recovery and throughout the course of this study.
The differences in antibody levels during the acute phase of disease between moderate and severe COVID‐19 patients were not apparent during late convalescence. Neither neutralising antibody titres, nor the magnitude of B cell and T cell memory responses differed between moderate and severe patients during late convalescence at either 5 or 9 months. This suggests that regardless of disease severity and level of care required during the acute phase, the majority of hospitalised patients are likely to elicit a long‐lasting cellular and humoral immunity towards SARS‐CoV‐2. However, because of a low cohort size in this study, the possibility of association between disease severity at hospitalisation and memory responses cannot be dismissed.
The current study, although extensive in regard to immunological analyses performed, was limited by a relatively small COVID‐19 patient cohort size. Here, we assessed SARS‐CoV‐2‐specific immune responses in moderately and severely sick COVID‐19 patients who required hospitalisation; however, we were not able to include asymptomatic or mild cases. Therefore, the longitudinal characteristics and magnitude of the immune responses observed in the current COVID‐19 patient cohort may only be applicable to hospitalised patients.
In summary, we demonstrate the activation of germinal centres, expansion of ASCs and the presence of SARS‐CoV‐2‐specific antibodies in both moderate and severe patients during acute COVID‐19. SARS‐CoV‐2‐specific and neutralising antibodies gradually declined after the acute phase in most patients but were sustained through convalescence. SARS‐CoV‐2‐specific memory B cells and T cells, assessed at 5 and 9 months post‐symptom onset, were also detectable in peripheral blood in all COVID‐19 patients, but at heterogeneous magnitudes, and a strong polyfunctional memory T cell response was observed. Taken together, the present findings reveal that hospitalised patients develop and sustain robust SARS‐CoV‐2‐specific adaptive immune responses that last up to at least 9 months post‐symptom onset.
Methods
Ethics statement
The study was approved by the Swedish Ethical Review Authority. All patients or next of kin and control donors provided informed consent in line with the ethical approval.
Study subjects and sampling
Twenty‐six hospitalised SARS‐CoV‐2 PCR‐confirmed patients from Karolinska University Hospital in Stockholm, Sweden, were included in the study in April and May 2020. Moderate COVID‐19 patients were recruited at the infectious disease unit (IDU), while severe COVID‐19 patients were recruited at the intensive care unit (ICU). For supplemental oxygen treatment requirement and additional treatments during the acute phase for each group, see Table 1. Sequential organ failure assessment (SOFA total) score, including respiratory SOFA (SOFA‐R) score, was also used to describe the severity of COVID‐19 disease. 62 Patients were primarily male, with median age of 57 (range 18–76) for moderate and median age of 58 (range 40–74) for severe patients (Figure 1a–c). Patients were sampled from 5 to 24 days since symptom onset during the acute phase (Figure 1d). In addition, 17 patients were followed up at 5 months and 13 patients were followed up at 9 months since symptom onset (Figure 1a). This COVID‐19 patient cohort is part of the Karolinska KI/K COVID‐19 Immune Atlas project. 16 , 17 , 18 , 19 , 20 , 21 More clinical information and other related data can be found at covid19cellatlas.com. Sixteen healthy age‐ and sex‐matched SARS‐CoV‐2‐seronegative controls from 2020 were included for flow cytometry, multiplex and serology experiments (Figure 1a). An additional 10 pre‐COVID‐19 pandemic controls from 2017 (age range 18–50 years) were included for memory B cell and T cell FluoroSpot experiments only.
Venous blood samples from study participants were collected in serum and heparin tubes. PBMCs were isolated using gradient centrifugation and used for fresh experiments or cryopreserved. Serum tubes were allowed to stand upright for 2 h at room temperature (RT), and serum was isolated by centrifugation at 2000 g for 10 min and stored at −80°C for later analysis.
Absolute cell counts
Absolute numbers of B cells and T cells in peripheral blood were measured using BD Multitest™ 6‐colour TBNK reagents and BD Trucount™ Tubes (BD Biosciences, Franklin Lakes, NJ, USA) according to the manufacturer’s instructions. Briefly, exactly 50 µL of heparinised anti‐coagulated blood was added to Trucount tubes within 3 h after extraction and stained for 15 min at RT in the dark. Samples were then fixed with 1X BD FACS lysing solution before acquiring data on a FACSSymphony A5 flow cytometer (BD Biosciences).
Flow cytometry
Freshly isolated PBMCs from patient and healthy control blood samples were stained using the following reagents and antibodies: Live/Dead cell marker Aqua (Life Technologies, Carlsbad, CA, USA), anti‐CD19 BUV 395, anti‐CD4 Qdot 605, anti‐CD38 Pacific Blue, anti‐CD14 AmCyan, anti‐Ki67 AF700, anti‐CD20 FITC, anti‐CD123 AmCyan, anti‐CD27 BV650, anti‐IgD PE‐Cy7, anti‐IgG PE, anti‐CD3 PE‐Cy5, anti‐IgA APC, anti‐IgM BV785, anti‐ICOS APC‐Cy7, anti‐CXCR5 BV711, anti‐CXCR3 PE‐Dazzle and anti‐PD1 BUV737 (Biolegend, San Diego, CA, USA, BD Bioscience, Beckman Coulter, Brea, CA, USA). Briefly, cells were incubated with 50 µL of surface staining antibody mix diluted in PBS for 30 min at 4°C in the dark. Following incubation, cells were washed twice in FACS buffer (2% FCS and 2 mm EDTA in PBS) and then fixed and permeabilised using Foxp3/Transcription Factor Staining kit (eBioscience, San Diego, CA, USA) for 30 min at 4°C. Cells were then washed twice in permeabilisation buffer (eBioscience) followed by intracellular staining. Antibodies against Ki67, IgG, IgA and IgM in permeabilisation buffer were added to the cells and incubated in the dark for 30 min at 4°C. Cells were washed with FACS buffer and then fixed for 2 h in 1% PFA. Samples were acquired with a BD LSRFortessa (BD Bioscience) followed by analysis with FlowJo software version 10 (FlowJo Inc., Ashland, Oregon). For flow cytometry gating strategy, see Supplementary figure 3.
SARS‐CoV‐2‐specific antibody ELISAs
RBD‐specific IgG/IgM antibodies were assessed using WANTAI SARS‐CoV‐2 Ab ELISA (Beijing Wantai Biological Pharmacy Ent, Beijing, China), while S1‐ and N‐specific IgG antibody levels were assessed using semi‐quantitative IgG ELISAs (Euroimmun, Lübeck, Germany) according to the manufacturer’s instructions.
Microneutralisation assay
The neutralising capacity of antibodies against SARS‐CoV‐2 in patient serum was tested as previously described. 63 Briefly, heat‐inactivated serum samples (30 min at 56°C) were diluted in twofold dilution series from 1:5 to 1:5120 in Eagle's minimum essential medium (Gibco, Waltham, MA, USA) with 5% FCS (Thermo Fisher Scientific, Waltham, MA, USA). The dilutions were subsequently mixed with equal volumes of 4000 TCID50/mL SARS‐CoV‐2 (200 TCID50 per well), resulting in final serum dilution series from 1:10 to 1:10 240. Final serum dilutions were incubated for 1 h at 37°C and 5% CO2 in duplicate and then moved to 96‐well plates seeded with confluent Vero E6 cells, followed by a 4‐day incubation at 37°C 5% CO2. At the end of incubation, the cells were inspected via optical microscopy for signs of cytopathic effect (CPE). Samples were considered neutralising if less than 50% of the cell layer showed signs of CPE and non‐neutralising if ≥ 50% CPE was observed. Results are given as the arithmetic mean of the reciprocals of the highest neutralising dilutions of the duplicates from each sample.
rSARS‐CoV‐2 N protein
A recombinant SARS‐CoV‐2 N protein was produced by transforming a synthesised plasmid coding for N protein into Escherichia coli as previously described. 33 Purified protein was later used in B cell FluoroSpot assays.
Memory B cell FluoroSpot assay
Detection of SARS‐CoV‐2 spike subunit 1 (S1) and nucleocapsid (N) protein‐specific IgA and IgG memory B cell‐derived ASCs (mASCs), as well as the total number of IgA‐ and IgG‐mASCs, was measured using a multicolour B cell FluoroSpot kit with modifications (Mabtech, Nacka Strand, Sweden). Briefly, thawed, cryopreserved PBMCs from study subjects were stimulated for 5 days with polyclonal B cell stimulation (1 µg mL–1 R848 and 10 ng mL–1 rIL‐2, Mabtech) in R10 media (RPMI‐1640 with 10% FCS, 1% penicillin/ streptomycin and 2 mm L‐glutamine; Thermo Fisher Scientific) at 37°C in 5% CO2 to differentiate quiescent MBCs into mASCs. Ethanol‐activated low autofluorescent polyvinylidene difluoride membrane plates were coated overnight with either (1) anti‐IgA and anti‐IgG capture antibodies (15 mg mL–1) or (2) SARS‐CoV‐2 S1 (20 µg mL–1) or N protein (10 mg mL–1). Excess coating solutions were removed, and plates were washed with PBS before being blocked with R10 for 30 min at RT. Optimised dilutions of 5‐day stimulated cells were carefully transferred to the coated plates and incubated at 37°C in 5% CO2 for 20 h. Cells were then discarded from plates and the captured antibodies were developed with anti‐human IgG‐550 and anti‐human IgA‐490 detection antibodies (1:500 dilution). Fluorescent spots indicating a single mASC and relative volume of antibody produced were detected with an IRIS FluoroSpot Reader and counted with Apex software (Mabtech). Positivity thresholds were set for both S1 and N‐mASCs based on pre‐pandemic control samples’ average S1 or N plus three standard deviations.
SARS‐CoV‐2 peptides for T cell FluoroSpot
Three peptide pools were used in memory T cell FluoroSpot assay: (1) SNMO defined peptide pool (Mabtech) consisting of 47 peptides (8–18 amino acid long) from spike (S), nucleocapsid (N), membrane (M), open reading frame (ORF)‐3c and ORF‐7a proteins, with purity of 60‐99%; (2) S1‐spanning overlapping peptide pool (Miltenyi Biotec, Bergisch Gladbach, Germany) of 15‐mer sequences and 11 amino acid overlap with purity of > 70%; and (3) N‐spanning overlapping peptide pool (Miltenyi) of 15‐mer sequences and 11 amino acid overlap with purity of > 70%. Lyophilised peptide pools were reconstituted in 20% DMSO solution at a stock concentration of 200 µg mL–1 for SNMO and 50 µg mL–1 for both S1 and N and later diluted to 2 µg mL–1 for the FluoroSpot assay.
Memory T cell FluoroSpot assay
To assess memory T cell responses to SARS‐CoV‐2 in convalescent COVID‐19 patient samples, we utilised human IFN‐γ/IL‐2/TNF FluoroSpot kit (Mabtech), which allows for the detection of T cells producing IFN‐γ, IL‐2 and/or TNF following stimulation. Cryopreserved PBMCs were thawed at 37°C in RPMI‐1640 medium supplemented with 2 mm L‐glutamine, 1% penicillin/streptomycin and 10% FCS (all from Thermo Fisher Scientific) and rested for 24 h at 37°C and 5% CO2. Cell viability after resting was assessed by trypan blue exclusion, and cells were counted using an automated cell counter Countess II (Thermo Fisher Scientific). Viability of > 60% was maintained after the overnight rest. FluoroSpot plates were blocked for 30 min with 10% FCS containing RPMI media prior to the addition of 150 000–300 000 PBMCs per well. The following stimulation solutions were then added: (1) SNMO peptide pool, (2) S1‐spanning overlapping peptide library and (3) N‐spanning overlapping peptide library. All wells with SARS‐CoV‐2 peptide pool stimulations contained the final concentration of 2 µg mL–1 of peptides and anti‐CD28 antibody diluted at 1:1000. Negative control contained 0.8% DMSO and anti‐CD28 (at 1:1000), while positive control contained anti‐CD3 and anti‐CD28 (both at 1:1000). FluoroSpot plates were then incubated for 21 h at 37°C and 5% CO2 and developed following the manufacturer’s instructions. Fluorescent spots indicating cells that secreted IFN‐γ (FITC filter), IL‐2 (Cy3 filter) and/or TNF (Cy5 filter) were detected with IRIS FluoroSpot reader and counted with Apex software (Mabtech). Numbers of responding cells in negative controls were subtracted from stimulated samples to account for background responses. Positivity threshold was set based on pre‐pandemic control samples (i.e. average number of polyfunctional T cells + 3x standard deviation). Average relative spot volume was measured using Apex software to determine the relative amount of each cytokine secreted by cells responding with 3, 2 or 1 cytokine following stimulation.
Multiplex
Several soluble analytes including CXCL13, IL‐6, BAFF, IL‐2, IL‐21 and IL‐15 were measured in plasma diluted 1:2 from acute COVID‐19 patients and acute healthy controls using a custom‐designed multiplex Magnetic Luminex Screening assay (R&D Systems, Minneapolis, MN, USA), according to the manufacturer’s instructions.
Statistics and data analysis
Statistical analyses were performed using GraphPad Prism (GraphPad Software, San Diego, CA, USA). Data sets were analysed using the Mann–Whitney U‐test, Wilcoxon signed‐rank test, Kruskal–Wallis test, Friedman test or Spearman’s rank‐order correlation tests. Dunn’s multiple comparisons test was used to correct for multiple comparisons where applicable. Any P‐values < 0.05 were considered to be statistically significant (*P < 0.05; **P < 0.01; and ***P < 0.001). Correlation and hierarchical clustering analysis were performed with GraphPad Prism (v9.0.1) or R (v4.0.2) and RStudio (v1.3.1056) using packages corrplot (v0.84) and heatmaply (v1.1.1).
Conflict of Interest
Marcus Buggert is a consultant for Oxford Immunotech. All other authors declare no competing interests.
Author Contributions
John Tyler Sandberg: Conceptualization; Data curation; Formal analysis; Investigation; Methodology; Project administration; Validation; Visualization; Writing‐original draft; Writing‐review & editing. Renata Varnaitė: Conceptualization; Data curation; Formal analysis; Investigation; Methodology; Project administration; Validation; Visualization; Writing‐original draft; Writing‐review & editing. Wanda Christ: Investigation; Methodology; Validation; Writing‐review & editing. Puran Chen: Data curation; Project administration; Writing‐review & editing. Jagadeeswara Rao Muvva: Resources; Writing‐review & editing. Kimia T Maleki: Investigation; Writing‐review & editing. Marina García: Investigation; Writing‐review & editing. Majda Dzidic: Resources; Writing‐review & editing. Elin Folkesson: Resources; Writing‐review & editing. Magdalena Skagerberg: Resources; Writing‐review & editing. Gustaf Ahlén: Resources; Writing‐review & editing. Lars Frelin: Resources; Writing‐review & editing. Matti Sällberg: Resources; Writing‐review & editing. Lars I Eriksson: Resources; Writing‐review & editing. Olav Rooyackers: Resources; Writing‐review & editing. Anders Sönnerborg: Resources; Writing‐review & editing. Marcus Buggert: Resources; Writing‐review & editing. Niklas Björkström: Project administration; Resources; Writing‐review & editing. Soo Aleman: Project administration; Resources; Writing‐review & editing. Kristoffer Strålin: Project administration; Resources; Writing‐review & editing. Jonas Klingström: Funding acquisition; Project administration; Supervision; Writing‐review & editing. Hans‐Gustaf Ljunggren: Funding acquisition; Project administration; Resources; Supervision; Writing‐review & editing. Kim Blom: Conceptualization; Formal analysis; Project administration; Supervision; Writing‐review & editing. Sara Gredmark‐Russ: Conceptualization; Formal analysis; Funding acquisition; Project administration; Supervision; Visualization; Writing‐review & editing.
Supporting information
Supplementary figure 1
Supplementary figure 2
Supplementary figure 3
The Karolinska COVID‐19 Study Group
Acknowledgments
We thank all donors, healthcare personnel and members of the Karolinska KI/K COVID‐19 Study Group for their participation in the study. The Karolinska KI/K COVID‐19 Study Group are as follows: M Akber , S Aleman, L Berglin, H Bergsten, NK Björkström, S Brighenti, D Brownlie, M Buggert, M Butrym, BJ Chambers, P Chen, M Cornillet, A Cuapio, I Diaz Lozano, L Dillner, M Dzidic, J Emgård, LI Eriksson, M Flodström‐Tullberg, A Färnert, Y Gao, H Glans, JB Gorin, S Gredmark‐Russ, J Grip, A Haroun‐Izquierdo, E Henriksson, L Hertwig, S Kalsum, T Kammann, J Klingström, E Kokkinou, E Kvedaraite, HG Ljunggren, MG Loreti, M Lourda, KT Maleki, KJ Malmberg, N Marquardt, C Maucourant, J Mårtensson, J Michaëlsson, J Mjösberg, K Moll, JR Muvva, P Nauclér, A Norrby‐Teglund, LM Palma Medina, T Parrot, A Perez‐Potti, BP Persson, L Radler, E Ringqvist, O Rivera‐Ballesteros, O Rooyackers, JK Sandberg, JT Sandberg, T Sekine, A Sönnerborg, E Sohlberg, T Soini, K Strålin, M Svensson, J Tynell, C Unge, R Varnaite, A von Kries and D Wullimann. SG‐R was supported by grants from Marianne and Marcus Wallenberg Foundation, and by grants provided by Region Stockholm (ALF project), by Region Stockholm (clinical research appointment) and by Center for Innovative Medicine, Region Stockholm and Karolinska Institutet. JTS and RV were supported by the Karolinska Institutet PhD Student Funding. H‐GL and the Karolinska COVID‐19 Study Group were supported by the Knut and Alice Wallenberg Foundation and Nordstjernan AB. JK was supported by the Swedish Research Council, Karolinska Institutet Foundations and Karolinska Institutet.
See the Acknowledgments section for all the members of The Karolinska COVID‐19 Study Group.
Contributor Information
Sara Gredmark‐Russ, Email: sara.gredmark.russ@ki.se.
The Karolinska COVID‐19 Study Group:
M Akber, S Aleman, L Berglin, H Bergsten, NK Björkström, S Brighenti, D Brownlie, M Butrym, BJ Chambers, M Cornillet, A Cuapio, I Diaz Lozano, L Dillner, J Emgård, M Flodström‐Tullberg, A Färnert, Y Gao, H Glans, JB Gorin, J Grip, A Haroun‐Izquierdo, E Henriksson, L Hertwig, S Kalsum, T Kammann, E Kokkinou, E Kvedaraite, MG Loreti, M Lourda, KJ Malmberg, N Marquardt, C Maucourant, J Mårtensson, J Michaëlsson, J Mjösberg, K Moll, P Nauclér, A Norrby‐Teglund, LM Palma Medina, T Parrot, A Perez‐Potti, BP Persson, L Radler, E Ringqvist, O Rivera‐Ballesteros, JK Sandberg, T Sekine, E Sohlberg, T Soini, M Svensson, J Tynell, C Unge, A von Kries, and D Wullimann
References
- 1. Zhou P, Yang X‐L, Wang X‐G et al. A pneumonia outbreak associated with a new coronavirus of probable bat origin. Nature 2020; 579: 270–273. [DOI] [PMC free article] [PubMed] [Google Scholar]
- 2. WHO coronavirus disease (COVID‐19) dashboard. Geneva, World Heal. Organ; 2020. https://covid19.who.int/ (accessed 2 Mar 2021).
- 3. Aoshi T, Koyama S, Kobiyama K, Akira S, Ishii KJ. Innate and adaptive immune responses to viral infection and vaccination. Curr Opin Virol 2011; 1: 226–232. [DOI] [PubMed] [Google Scholar]
- 4. Havenar‐Daughton C, Lindqvist M, Heit A et al. CXCL13 is a plasma biomarker of germinal center activity. Proc Natl Acad Sci USA 2016; 113: 2702–2707. [DOI] [PMC free article] [PubMed] [Google Scholar]
- 5. Baumjohann D, Preite S, Reboldi A et al. Persistent antigen and germinal center B cells sustain T follicular helper cell responses and phenotype. Immunity 2013; 38: 596–605. [DOI] [PubMed] [Google Scholar]
- 6. Cárdeno A, Magnusson MK, Quiding‐Järbrink M, Lundgren A. Activated T follicular helper‐like cells are released into blood after oral vaccination and correlate with vaccine specific mucosal B cell memory. Sci Rep 2018; 8: e2729. [DOI] [PMC free article] [PubMed] [Google Scholar]
- 7. Zhang J, Liu W, Wen B et al. Circulating CXCR3+ Tfh cells positively correlate with neutralizing antibody responses in HCV‐infected patients. Sci Rep 2019; 9: e10090. [DOI] [PMC free article] [PubMed] [Google Scholar]
- 8. Wrammert J, Smith K, Miller J et al. Rapid cloning of high‐affinity human monoclonal antibodies against influenza virus. Nature 2008; 453: 667–671. [DOI] [PMC free article] [PubMed] [Google Scholar]
- 9. Mei HE, Yoshida T, Sime W et al. Blood‐borne human plasma cells in steady state are derived from mucosal immune responses. Blood 2009; 113: 2461–2469. [DOI] [PubMed] [Google Scholar]
- 10. Fink K. Origin and function of circulating plasmablasts during acute viral infections. Front Immunol 2012; 3: e78. [DOI] [PMC free article] [PubMed] [Google Scholar]
- 11. Lee FE, Falsey AR, Halliley JL, Sanz I, Walsh EE. Circulating antibody‐secreting cells during acute respiratory syncytial virus infection in adults. J Infect Dis 2010; 202: 1659–1666. [DOI] [PMC free article] [PubMed] [Google Scholar]
- 12. Dan JM, Mateus J, Kato Y et al. Immunological memory to SARS‐CoV‐2 assessed for up to 8 months after infection. Science 2021; 371: eabf4063. [DOI] [PMC free article] [PubMed] [Google Scholar]
- 13. Sherina N, Piralla A, Du L et al. Persistence of SARS‐CoV‐2 specific B‐ and T cell responses in convalescent COVID‐19 patients 6–8 months after the infection. Med 2021; 2: 281–295. 10.1016/j.medj.2021.02.001 [DOI] [PMC free article] [PubMed] [Google Scholar]
- 14. Liu WJ, Zhao M, Liu K et al. T cell immunity of SARS‐CoV: Implications for vaccine development against MERS‐CoV. Antiviral Res 2017; 137: 82–92. [DOI] [PMC free article] [PubMed] [Google Scholar]
- 15. Huang AT, Garcia‐Carreras B, Hitchings MDT et al. A systematic review of antibody mediated immunity to coronaviruses: kinetics, correlates of protection, and association with severity. Nat Commun 2020; 11: 1–16. [DOI] [PMC free article] [PubMed] [Google Scholar]
- 16. Sekine T, Perez‐Potti A, Rivera‐Ballesteros O et al. Robust T cell immunity in convalescent individuals with asymptomatic or mild COVID‐19. Cell 2020; 183: 158–168. e14. [DOI] [PMC free article] [PubMed] [Google Scholar]
- 17. Maucourant C, Filipovic I, Ponzetta A et al. Natural killer cell immunotypes related to COVID‐19 disease severity. Sci Immunol 2020; 5: eabd6832. [DOI] [PMC free article] [PubMed] [Google Scholar]
- 18. Parrot T, Gorin JB, Ponzetta A et al. MAIT cell activation and dynamics associated with COVID‐19 disease severity. Sci Immunol 2020; 5: 1–14. [DOI] [PMC free article] [PubMed] [Google Scholar]
- 19. Kvedaraite E, Hertwig L, Sinha I et al. Major alterations in the mononuclear phagocyte landscape associated with COVID‐19 severity. Proc Natl Acad Sci USA 2021; 118: e2018587118. [DOI] [PMC free article] [PubMed] [Google Scholar]
- 20. Lourda M, Dzidic M, Hertwig L et al. High‐dimensional profiling reveals phenotypic heterogeneity and disease‐specific alterations of granulocytes in COVID‐19. medRxiv 2021; 1–43. 10.1101/2021.01.27.21250591. [DOI] [PMC free article] [PubMed] [Google Scholar]
- 21. García M, Kokkinou E, Carrasco García A et al. Innate lymphoid cell composition associates with COVID‐19 disease severity. Clin Transl Immunol 2020; 9: e1224. [DOI] [PMC free article] [PubMed] [Google Scholar]
- 22. Seymour CW, Liu VX, Iwashyna TJ et al. Assessment of clinical criteria for sepsis for the third international consensus definitions for sepsis and septic shock (sepsis‐3). JAMA 2016; 315: 762–774. [DOI] [PMC free article] [PubMed] [Google Scholar]
- 23. Plotkin SA, Orenstein WA, Offit P, Edwards KM. Plotkin’s Vaccines. 7th ed. Philadelphia, PA: Elsevier, 2017. [Google Scholar]
- 24. Sundling C, Lau AWY, Bourne K et al. Positive selection of IgG+ over IgM+ B cells in the germinal center reaction. Immunity 2021; 54: 1–14. [DOI] [PubMed] [Google Scholar]
- 25. Kaneko N, Kuo HH, Boucau J et al. Loss of Bcl‐6‐expressing T follicular helper cells and germinal centers in COVID‐19. Cell 2020; 183: 143–157. e13. [DOI] [PMC free article] [PubMed] [Google Scholar]
- 26. Zheng M, Gao Y, Liu S et al. Serum inflammatory factors are positively correlated with the production of specific antibodies in coronavirus disease 2019 patients. Cell Mol Immunol 2020; 17: 1180–1182. [DOI] [PMC free article] [PubMed] [Google Scholar]
- 27. Kuri‐Cervantes L, Pampena MB, Meng W et al. Comprehensive mapping of immune perturbations associated with severe COVID‐19. Sci Immunol 2020; 5: eabd7114. [DOI] [PMC free article] [PubMed] [Google Scholar]
- 28. Rodda LB, Netland J, Shehata L et al. Functional SARS‐CoV‐2‐specific immune memory persists after mild COVID‐19. Cell 2020; 184: 169–183. e17. [DOI] [PMC free article] [PubMed] [Google Scholar]
- 29. Altmann DM. Adaptive immunity to SARS‐CoV‐2. Oxford Open Immunol 2020; 1: 1–6. 10.1093/oxfimm/iqaa003. [DOI] [PMC free article] [PubMed] [Google Scholar]
- 30. Mathew D, Giles JR, Baxter AE et al. Deep immune profiling of COVID‐19 patients reveals distinct immunotypes with therapeutic implications. Science 2020; 369: eabc8511. [DOI] [PMC free article] [PubMed] [Google Scholar]
- 31. Juno JA, Tan HX, Lee WS et al. Humoral and circulating follicular helper T cell responses in recovered patients with COVID‐19. Nat Med 2020; 26: 1428–1434. [DOI] [PubMed] [Google Scholar]
- 32. Rydyznski Moderbacher C, Ramirez SI, Dan JM et al. Antigen‐specific adaptive immunity to SARS‐CoV‐2 in acute COVID‐19 and associations with age and disease severity. Cell 2020; 183: 996–1012. e19. [DOI] [PMC free article] [PubMed] [Google Scholar]
- 33. Varnaitė R, García M, Glans H et al. Expansion of SARS‐CoV‐2–specific antibody‐secreting cells and generation of neutralizing antibodies in hospitalized COVID‐19 patients. J Immunol 2020; 205: 2437–2446. [DOI] [PMC free article] [PubMed] [Google Scholar]
- 34. De Biasi S, Lo Tartaro D, Meschiari M et al. Expansion of plasmablasts and loss of memory B cells in peripheral blood from COVID‐19 patients with pneumonia. Eur J Immunol 2020; 50: 1283–1294. [DOI] [PubMed] [Google Scholar]
- 35. Okba NMA, Müller MA, Li W et al. Severe Acute Respiratory Syndrome Coronavirus 2‐specific antibody responses in coronavirus disease patients. Emerg Infect Dis 2020; 26: 1478–1488. [DOI] [PMC free article] [PubMed] [Google Scholar]
- 36. Long QX, Liu BZ, Deng HJ et al. Antibody responses to SARS‐CoV‐2 in patients with COVID‐19. Nat Med 2020; 26: 845–848. [DOI] [PubMed] [Google Scholar]
- 37. To KKW, Tsang OTY, Leung WS et al. Temporal profiles of viral load in posterior oropharyngeal saliva samples and serum antibody responses during infection by SARS‐CoV‐2: an observational cohort study. Lancet Infect Dis 2020; 20: 565–574. [DOI] [PMC free article] [PubMed] [Google Scholar]
- 38. Vabret N, Britton GJ, Gruber C et al. Immunology of COVID‐19: current state of the science. Immunity 2020; 52: 910–941. [DOI] [PMC free article] [PubMed] [Google Scholar]
- 39. Orner EP, Rodgers MA, Hock K et al. Comparison of SARS‐CoV‐2 IgM and IgG seroconversion profiles among hospitalized patients in two US cities. Diagn Microbiol Infect Dis 2021; 99: 115300. [DOI] [PMC free article] [PubMed] [Google Scholar]
- 40. Guo L, Ren L, Yang S et al. Profiling early humoral response to diagnose novel coronavirus disease (COVID‐19). Clin Infect Dis 2020; 71: 778–785. [DOI] [PMC free article] [PubMed] [Google Scholar]
- 41. Zhao J, Yuan Q, Wang H et al. Antibody responses to SARS‐CoV‐2 in patients with novel Coronavirus disease 2019. Clin Infect Dis 2020; 71: 2027–2034. [DOI] [PMC free article] [PubMed] [Google Scholar]
- 42. Trinité B, Tarrés‐Freixas F, Rodon J et al. SARS‐CoV‐2 infection elicits a rapid neutralizing antibody response that correlates with disease severity. Sci Rep 2021; 11: e2608. [DOI] [PMC free article] [PubMed] [Google Scholar]
- 43. Piccoli L, Park YJ, Tortorici MA et al. Mapping neutralizing and immunodominant sites on the SARS‐CoV‐2 spike receptor‐binding domain by structure‐guided high‐resolution serology. Cell 2020; 183: 1024–1042. e21. [DOI] [PMC free article] [PubMed] [Google Scholar]
- 44. Klein SL, Pekosz A, Park HS et al. Sex, age, and hospitalization drive antibody responses in a COVID‐19 convalescent plasma donor population. J Clin Invest 2020; 130: 6141–6150. [DOI] [PMC free article] [PubMed] [Google Scholar]
- 45. Marot S, Malet I, Leducq V et al. Rapid decline of neutralizing antibodies against SARS‐CoV‐2 among infected healthcare workers. Nat Commun 2021; 12: 1–7. [DOI] [PMC free article] [PubMed] [Google Scholar]
- 46. Crawford KHD, Dingens AS, Eguia R et al. Dynamics of neutralizing antibody titers in the months after severe acute respiratory syndrome coronavirus 2 infection. J Infect Dis 2021; 223: 197–205. [DOI] [PMC free article] [PubMed] [Google Scholar]
- 47. Yamayoshi S, Yasuhara A, Ito M, Akasaka O et al. Antibody titers against SARS‐CoV‐2 decline, but do not disappear for several months. EClinicalMedicine 2021; 32: 100734. [DOI] [PMC free article] [PubMed] [Google Scholar]
- 48. Guthmiller JJ, Stovicek O, Wang J et al. SARS‐CoV‐2 infection severity is linked to superior humoral immunity against the spike. MBio 2021; 12: 1–13. [DOI] [PMC free article] [PubMed] [Google Scholar]
- 49. Nguyen‐Contant P, Embong AK, Kanagaiah P et al. S protein‐reactive IGG and memory B cell production after human SARS‐CoV‐2 infection includes broad reactivity to the S2 subunit. MBio 2020; 11: e01991–20. [DOI] [PMC free article] [PubMed] [Google Scholar]
- 50. Grifoni A, Weiskopf D, Ramirez SI et al. Targets of T cell responses to SARS‐CoV‐2 Coronavirus in humans with COVID‐19 disease and unexposed individuals. Cell 2020; 181: 1489–1501. e15. [DOI] [PMC free article] [PubMed] [Google Scholar]
- 51. Peng Y, Mentzer AJ, Liu G et al. Broad and strong memory CD4+ and CD8+ T cells induced by SARS‐CoV‐2 in UK convalescent individuals following COVID‐19. Nat Immunol 2020; 21: 1336–1345. [DOI] [PMC free article] [PubMed] [Google Scholar]
- 52. Sun Y, Santra S, Schmitz JE, Roederer M, Letvin NL. Magnitude and quality of vaccine‐elicited T cell responses in the control of immunodeficiency virus replication in Rhesus monkeys. J Virol 2008; 82: 8812–8819. [DOI] [PMC free article] [PubMed] [Google Scholar]
- 53. Betts MR, Nason MC, West SM et al. HIV nonprogressors preferentially maintain highly functional HIV‐specific CD8+ T cells. Blood 2006; 107: 4781–4789. [DOI] [PMC free article] [PubMed] [Google Scholar]
- 54. Almeida JR, Price DA, Papagno L et al. Superior control of HIV‐1 replication by CD8+ T cells is reflected by their avidity, polyfunctionality, and clonal turnover. J Exp Med 2007; 204: 2473–2485. [DOI] [PMC free article] [PubMed] [Google Scholar]
- 55. Darrah PA, Patel DT, De Luca PM et al. Multifunctional TH1 cells define a correlate of vaccine‐mediated protection against Leishmania major. Nat Med 2007; 13: 843–850. [DOI] [PubMed] [Google Scholar]
- 56. Kannanganat S, Ibegbu C, Chennareddi L, Robinson HL, Amara RR. Multiple‐cytokine‐producing antiviral CD4 T cells are functionally superior to single‐cytokine‐producing cells. J Virol 2007; 81: 8468–8476. [DOI] [PMC free article] [PubMed] [Google Scholar]
- 57. Precopio ML, Betts MR, Parrino J et al. Immunization with vaccinia virus induces polyfunctional and phenotypically distinctive CD8+ T cell responses. J Exp Med 2007; 204: 1405–1416. [DOI] [PMC free article] [PubMed] [Google Scholar]
- 58. Le Bert N, Clapham HE, Tan AT et al. Highly functional virus‐specific cellular immune response in asymptomatic SARS‐CoV‐2 infection. J Exp Med 2021; 218: e20202617. [DOI] [PMC free article] [PubMed] [Google Scholar]
- 59. Lumley SF, O’Donnell D, Stoesser NE et al. Antibody status and incidence of SARS‐CoV‐2 infection in health care workers. N Engl J Med 2021; 384: 533–540. [DOI] [PMC free article] [PubMed] [Google Scholar]
- 60. Wyllie D, Mulchandani R, Jones HE et al. SARS‐CoV‐2 responsive T cell numbers are associated with protection from COVID‐19: a prospective cohort study in keyworkers. medRxiv 2020. 10.1101/2020.11.02.20222778 [DOI] [Google Scholar]
- 61. Hanrath AT, Payne BAI, Duncan CJA. Prior SARS‐CoV‐2 infection is associated with protection against symptomatic reinfection. J Infect 2021; 82: e29–e30. [DOI] [PMC free article] [PubMed] [Google Scholar]
- 62. Singer M, Deutschman CS, Seymour C et al. The third international consensus definitions for sepsis and septic shock (sepsis‐3). JAMA 2016; 315: 801–810. [DOI] [PMC free article] [PubMed] [Google Scholar]
- 63. Manenti A, Maggetti M, Casa E et al. Evaluation of SARS‐CoV‐2 neutralizing antibodies using a CPE‐based colorimetric live virus micro‐neutralization assay in human serum samples. J Med Virol 2020; 92: 2096–2104. [DOI] [PMC free article] [PubMed] [Google Scholar]
Associated Data
This section collects any data citations, data availability statements, or supplementary materials included in this article.
Supplementary Materials
Supplementary figure 1
Supplementary figure 2
Supplementary figure 3
The Karolinska COVID‐19 Study Group