Abstract
We present a numerical model that describes the microfluidic generation and manipulation of ferrofluid droplets under an external magnetic field. We developed a numerical Computational Fluid Dynamics (CFD) analysis for predicting and optimizing continuous flow generation and processing of ferrofluid droplets with and without the presence of a permanent magnet. More specifically, we explore the dynamics of oil-based ferrofluid droplets within an aqueous continuous phase under an external inhomogeneous magnetic field. The developed model determines the effect of the magnetic field on the droplet generation which is carried out in a flow-focusing geometry and its sorting in T-junction channels. Three-channel depths (25 µm, 30 µm, and 40 µm) were investigated to study droplet deformation under magnetic forces. Among the three, the 30 µm channel depth showed the most consistent droplet production for the studied range of flow rates. Ferrofluids with different loadings of magnetic nanoparticles were used to observe behavior for different ratios of magnetic and hydrodynamic forces. Our results show that the effect of these factors on droplet size and generation rate can be tuned and optimized to produce consistent droplet generation and sorting. This approach involves fully coupled magnetic-fluid mechanics models and can predict critical details of the process including droplet size, shape, trajectory, dispensing rate, and the perturbation of the fluid co-flow for different flow rates. The model enables better understanding of the physical phenomena involved in continuous droplet processing and allows efficient parametric analysis and optimization.
Graphical Abstract
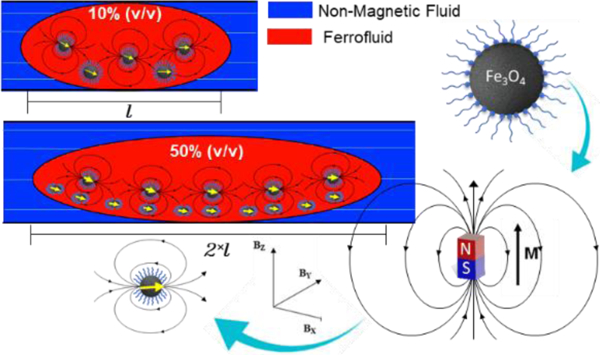
Integrated computational fluid dynamics and magnetics simulation is employed to analyze the effects of magnetic force on the formation, deformation, and sorting of ferrofluid droplets within a flowing non-magnetic continuous phase in a microfluidic device.
1. Introduction
The number of studies of droplet generation and manipulation in microfluidic devices has increased exponentially in recent decades. Among many valuable features, one of the unique advantages of this technology is the accurate handling of miniscule amounts of fluid, which has numerous benefits and multiple applications. These miniaturized systems can perform multiple chemical and biological analyses in a single device (i.e. micro total analysis systems, microTAS, or lab-on-a-chip devices).1 At reduced length scale, mass and heat transfer rates are faster and the surface-to-volume ratio increases, enabling fast and controlled mixing and heating without turbulence. One of the main branches of microfluidics involves droplet-based microfluidics. The science and technology of droplet-based microfluidics have a wide range of applications such as 3D micro-printing, rapid diagnostics, blood detoxification, cell separation, and production of uniform emulsion droplets, within the fields of chemistry, food science, biology, and medicine.2,3
Droplet generation has been achieved by using different microchannel configurations such as T-junction, co-flowing, and flow-focusing geometries, to create droplets that are then transported in a pressure driven flow. Pressure-driven flow is based on Poiseuille flow theory, i.e. a smooth parabolic velocity profile characteristic of microfluidics due to the low Reynolds number. This method offers several advantages: easy channel fabrication, high throughput, and simple operation. After the formation of droplets in a pressure-driven flow, multiple techniques can be applied to control the droplet path within channels.4,5 The droplet size and the time interval between generation of droplets can be accurately controlled by modifying the flow rate ratio of the two immiscible fluids, surface tension, and viscosities. For microfluidic systems, the effects of gravity and fluid inertia are generally negligible in comparison with other forces on the droplets. In order to advance this technology further, the controlled and precise manipulation of droplets within microchannels should be better understood and optimized.6
Droplet actuation in microfluidics is obtained by different means, i.e. electrical potential, magnetic field, or surface acoustic waves.7,8 There are various studies reporting either passive or active droplet generation techniques.9 The generation of droplets is initiated by flow instabilities. For instance in passive microfluidic devices, flowing of one immiscible fluid, the dispersed phase (DP) into a continuous phase (CP) can generate droplets under appropriate conditions and flow rates.10 This method can employ different microfluidic device configurations with droplet formation modes including dripping, squeezing, and jetting.11,12 In passive methods, inertial and viscous forces acting to deform fluid interfaces counteract interfacial tension forces that resist the deformation. Relative to passive methods, active methods provide more control of the droplet formation process with the help of external forces. Active methods are categorized into magnetic, electrical, thermal, optical, mechanical, and centrifugal controls.13–16
Once droplets are generated, one must control their trajectory in a continuous flow. Magnetic separation for droplet-based continuous flow microfluidics was firstly proposed by Lombardi et al. in 2011.17 This technique is simple and economical and it works without an external power source by using a permanent magnet. This feature is important not only for point-of-care applications but also for applications where electricity is limited and interaction between samples and the applied force is critically important.18 The external magnetic force does not affect pH level, surface charges, temperature or ionic concentration. Furthermore, different types of magnetic materials can be used for separation.
In order for the magnetic field to impart a force on the droplet, a magnetic material is generally employed as dispersed phase. In this regard, ferrofluids, defined as stable colloidal suspensions of ferromagnetic nanoparticles in a carrying liquid, normally around 10 nm, e.g. Fe3O4 (magnetite) particles, have attracted much attention. In microfluidic devices, ferrofluids have been used to control droplet motion within microchannels with the aid of an external magnetic field. Magnetic forces acting on the droplet in microchannels can act as magnetic stirrers to enhance the mixing of the droplet volume which can enhance performance of the system for various applications.19 Under a sufficiently strong magnetic field, a ferrofluid droplet can be manipulated as a monolithic deformable magnetized element.20 Therefore, ferrofluids play an essential role in magnetic manipulation of droplets in microfluidics.
One should understand the magnetic microfluidic system behavior (and if possible before fabrication) to take full advantage of this technology. Numerical models are useful tools to better explain and understand the magnetic droplet generation process, as well as droplet trajectories when manipulated with magnets. Different studies have addressed the modeling of droplet formation, using different flow rates for the CP and DP.21–23 A majority of reported numerical studies on ferrofluid droplets are devoted to the investigation of motion and alteration of a single droplet, while it is exposed to a magnetic field.24–26 However, most of these studies are focused on droplet elongations under uniform magnetic fields, because of simpler mathematical description. Only a few theoretical and experimental studies have reported the analysis of droplet manipulation by magnetic fields produced by permanent magnets or electromagnets.27–29 In these studies, active ferrofluid droplet formation influenced by a magnetic field was studied and validated experimentally. For instance, Liu et al. reported both experimental and numerical formation processes of ferrofluid droplets with a flow-focusing channel in the presence of a magnetic field. The Level Set (LS) method was used to study the motion of the interface between the DP and CP and numerical results were compared with experimental observations.30 Aboutalebi et al. studied the magnetic splitting of droplets in a T-junction microfluidic device under an asymmetrically applied magnetic field. Their results showed that by increasing the strength of the magnetic field, the likelihood of asymmetric splitting of droplets increased, and high splitting ratios can be attained.31 Furthermore, there are experimental studies about deformation of ferrofluid droplet with magnetic field but without using a microdevice.32,33
To the best of our knowledge, the relationship between droplet volumes and diameter for different flow rates, volume percentages of ferrofluid, and channel configurations (channel depths) remains limited, and scaling laws for droplet generation may be altered when a ferrofluid droplet is under an applied magnetic field. This information can support development of optimized platforms for ferrofluid droplet generation and manipulation for various applications. In fact, improved understanding of droplet generation and behavior is essential to efficiently design complex processes where droplets are directed through different channel configurations. In order to address the previous issues, we present a numerical model to thoroughly study dynamics of ferrofluid droplet formation in an immiscible water-based solution, which is assumed to be non-magnetic and Newtonian.
This work is designed to critically study the detailed behavior of ferrofluid droplets within a microchannel under the influence of a magnetic field, including all internal and external forces. The proposed model provides a fast interface tracking using the Volume of Fluid (VOF) method that runs in parallel with a customized FORTRAN code (to apply an external magnetic field) to efficiently model the generation of droplets, their deformation during transport through the device, and their behavior at the outlet. This study delivers insights into changes in the volume of droplets, the frequency of droplet generation at the flow focusing inlet, and manipulation and trapping of droplets at the T-outlet for a particular range of conditions and device geometries. The aim of this work is to present these insights and a practical tool that can model a sufficient number of droplets, in a reasonable computational time, to be applied and extended for various applications (particularly in the area of separation devices). Therefore, we numerically investigated the dispensing rate or the time interval between droplet formation, the droplet volume, and droplet diameter under different working conditions. The numerical analysis included the calculation of the magnetic force acting on a droplet due to the presence of a permanent magnet. The detailed hydrodynamic analysis for both formation and manipulation was carried out based on the applied magnetic field.
Furthermore, we demonstrate a modeling approach that combines an analytical expression for the magnetic field with the CFD simulation to enhance computational efficiency and compare its results to an approach that simultaneously computes the magnetic field distribution and fluid dynamics. There are various methods to track fluid interface such as LS, VOF, volume tracking, phase field methods, and others. In this work, the VOF method is employed to calculate the droplet interface location at every time step through a phase function that describes which phase occupies each computational cell. Surface tension and wall adhesion were included. The VOF method is simple, efficient, and robust for tracking topologically complex evolving interfaces. Among its advantages are strict conservation of mass and discretization of the surface tension force, which make it a valuable and competitive method for modeling flows with moving and deforming interfaces 23,30. The advantage of this model is the reduced computational cost while tracking the interface between DP and CP through a microchannel.
2. Computational model
For this study, we employ a flow-focusing design for droplet generation and its subsequent separation in a T-junction, as seen in Fig. 1. The motion of the droplet was investigated in terms of a balance between fluidic and magnetic forces with a permanent magnet used to actuate droplets. The variation in the depth of a channel is reflected in a change in the inlet velocity of the fluid phases. As the channel gets deeper, the velocity decreases because of an increase in the cross-sectional area. The model geometry was set up in 3D (as shown in Fig. 1 b)), but the simulation was solved in 2D to minimize computational cost by using one computational mesh cell in the depth direction. Nevertheless, the magnetic model is solved in 3D because the magnet position greatly affects the field and gradient distribution in space. Thus, the force on the droplet reflects the 3D distribution of the magnetic field. The plug-like flow of droplets down the channel with a sharp interface between phases necessarily requires a slip boundary condition at the walls. Wall friction produces some velocity variation across the channel, which we resolve in the z direction (channel width) but not in the y direction (channel depth). Hence, the main effect of changing the channel depth is to alter the inlet velocity of DP and CP. The CFD model was generated by customizing FLOW-3D a commercial software package, from Flow Science Inc. (version 11.2, www.flow3d.com).
Fig. 1.
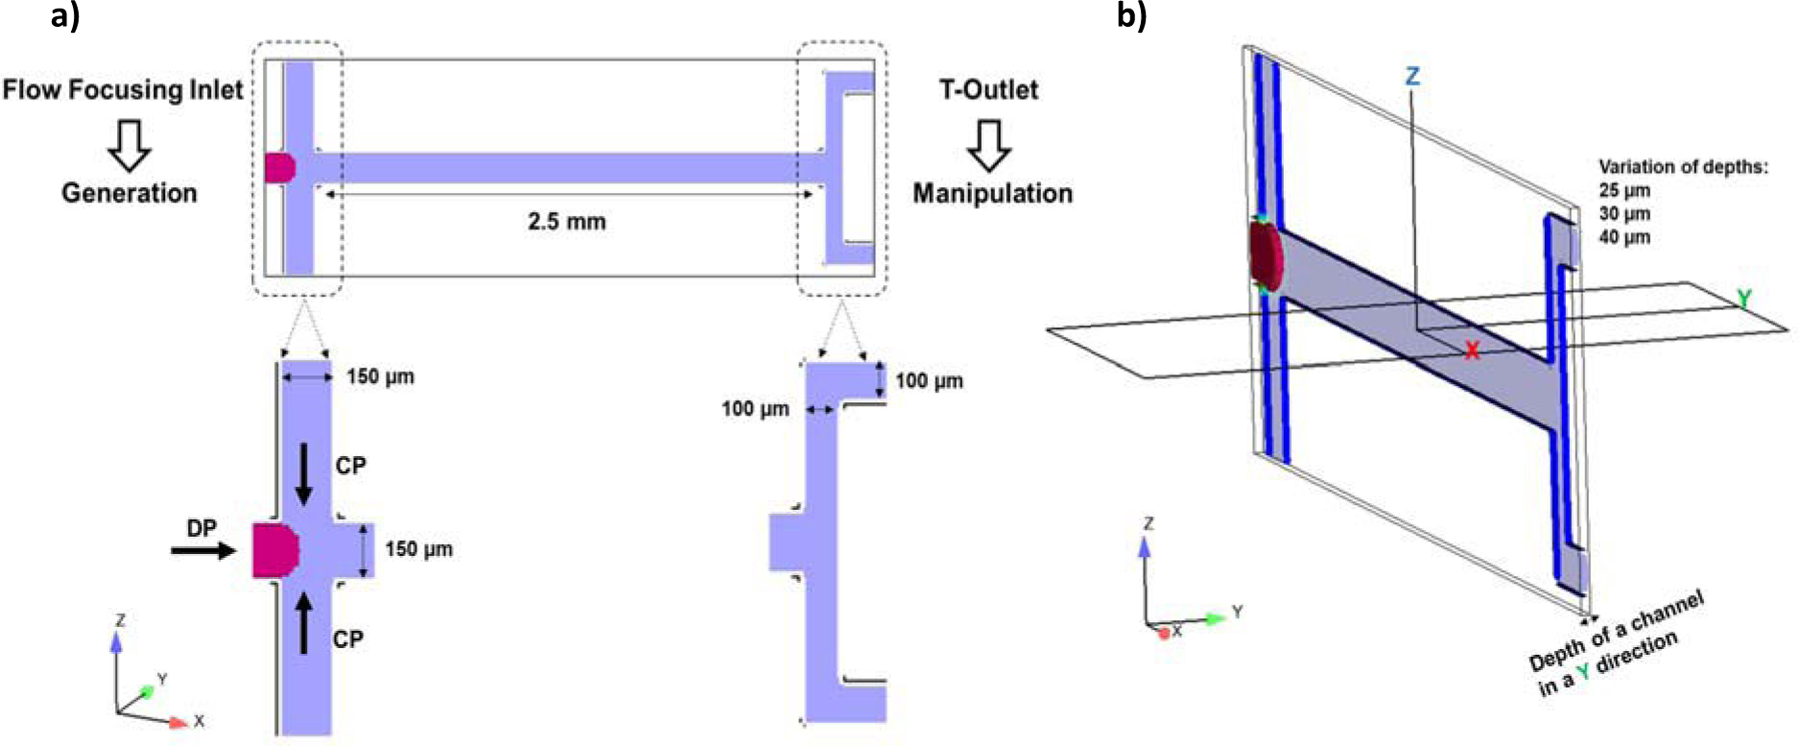
Schematic representation of a) the microfluidic device and b) the channel cross-section and depth of a channel in the y-direction that varies in this study as 25 µm, 30 µm, and 40 µm.
2.1. Governing equations
To efficiently track the interface between the two phases, we employed the VOF method as implemented in FLOW-3D. The VOF method describes the volume occupancy of each computational cell containing a fluid-fluid interface. This allows it to follow the motion of a sharp interface as it moves through computational cells.34,35 VOF defines a function (F) for tracking fluids that is described by the following eqn (1):
| (1) |
where VF is the fractional volume occupied by a particular fluid, A is a fractional area open to flow for every computational cell, and lastly v is the fluid velocity. The function F represents DP as phase 1, and CP is the complementary region with fraction 1- F. This method models two immiscible fluids by solving a set of momentum equations as it tracks the F function through the entire computational domain. The F function enables easy and simple identification of mesh cells with sharp interfaces. When a sharp interface is present in the cell (0 < F < 1), the interfacial tension force is added to the momentum formula, (eqn (3)), as an identical pressure contribution. The incompressible fluid flow considered for this simulation can be defined by the Navier-Stokes equations as follows:
| (2) |
| (3) |
Eqns (2) and (3) correspond to the conservation of mass and momentum, where ρ is the fluid density, t is time, p is the pressure, τ is the viscous stress tensor, and lastly Fσ and FM are the surface tension and magnetic force vectors. Fσ is zero except at locations where an interface is present and FM is zero in the non-magnetic CP regions.
The magnetic force density acting on a droplet can be written as:
| (4) |
where V is the volume of the droplet (m3), μ0 is the permeability of vacuum (1.256637×10⁻⁶ H∙m−1), M is the magnetization of the ferrofluid droplet (A∙m−1), and ∇H (A∙m−2) is the gradient of the magnetic field. The magnetization of a ferrofluid is given by a Langevin function, in which M changes nonlinearly with respect to effective magnetic susceptibility, as described by eqn (5):
| (5) |
| (6) |
where ξ is the effective magnetic susceptibility, φ is the volume fraction of the particles in the fluid, MS (A∙m−1) is the saturation magnetization, Vnp (m3) is the volume of a single magnetic nanoparticle, kB is the Boltzmann constant (1.38×10−38 m2kg·s−2K−1), and finally T is the temperature (K). When ξ is small, the Langevin function can be simplified to M = ξH, which shows the proportional change of magnetization with respect to the magnetic field strength.
We employed the model developed by Furlani to analytically determine the 3D magnetic field from a permanent magnet.36 Magnetic flux density (B) and the magnetic field density (H) were solved based on the position of the permanent magnet with respect to the micro-channel. An accurate calculation of the magnetic flux and magnetic field density allowed magnetization to be calculated using the Langevin function. Then, the force acting on a ferrofluid droplet can be calculated with respect to the volume of each droplet.
Furthermore, to study the response of the resulting ferrofluid droplet (in a range of 100–250 µm in diameter) to an applied magnetic field, further effort was needed to solve for the magnetic field inside and outside of the droplet, which requires information about shape of the interface between the droplet and surrounding media. It should be noted that when there is a constant magnetic susceptibility, a boundary integral formulation can be used to examine equilibrium shapes of ferrofluid droplets and interfacial instabilities.
2.2. Geometrical specification of the chip
As shown in Fig. 1, the chip geometry consists of a cross-junction, a flow-focusing droplet generation device and a T-shaped manipulation outlet. The channel depth is indicated in the y-direction and it varies for different cases considered here (25 µm, 30 µm, and 40 µm). These specific channel depths were chosen based upon the limitations of the wet etching technique that is employed to fabricate the microchips, as well as for consistency with prior studies using such chips.37
For studying the droplet deformation and manipulation under an applied magnetic field and different flow conditions, the inlet flow rate of CP (Qc) was varied from 100 µL·h−1 to 500 µL·h−1, while the inlet flow rate of DP (Qd) was kept constant at 10 µL·h−1. The average velocity was calculated for each flow rate and used as the initial condition. In our study, we employed the properties of a widely used and commercially available oil-based ferrofluid (EMG901, Ferrotec), containing a suspension of 10 nm diameter Fe3O4 nanoparticles (17.7 vol% Fe3O4). We considered two concentrations of the ferrofluid (when diluted in cyclohexane) at two volume percentages of 10% (v/v) and 50% (v/v), to yield final Fe3O4 volume fractions of 1.77% and 8.85%, respectively. The 10% (v/v) ferrofluid has a density of 875.1 kg∙m−3 and a viscosity of 6.927 cP, while the 50% (v/v) ferrofluid has a density of 1259.5 kg∙m−3 and a viscosity of 30.5cP. The CP fluid was modeled as water with a density and viscosity of 1000 kg∙m−3 and 1 cP, respectively. At the outlet, a calculated outflow boundary condition was used, in which the velocity at the boundary is specified as equal to the velocity of the neighboring cell. This allows for the outflow velocities to be computed. The numerical discretization of the model used a single cell in the channel depth (y-direction) to yield a 2D model. Specification of different channel depths corresponded to changes in the inlet velocities.
The simulation was run for 3.5 s for all cases, which allowed for sufficient droplets to be generated and, subsequently, examined under various conditions. Surface tension depends on the nature of the two fluid phases and the surface on which their interface is located. For this study, surface tension between the ferrofluid and the aqueous CP was considered to be 5 mN∙m−1, which is the measured value reported in literature.38 A mean contact angle of 140° is considered for modeling the contact line where the fluid-fluid interface meets the wall.
Magnetic field distribution depends upon the type of permanent magnet, distance from the microfluidic device, and orientation and polarity of the magnet. In this computational analysis, a cubic rare-earth neodymium iron boron (NdFeB), with remanent magnetization of Br= 1.32 T and dimensions of 1×1×1 mm3 is considered as the external magnetic source. The permanent magnet was located at the bottom right side of the microfluidic channel, 0.5 mm away from the T-shaped outlet. It was positioned in a way that the centerline of the permanent magnet was exactly below the middle of the outlet (see Fig. 2). The magnetic field distribution was solved with respect to the position of ferrofluid in the microchannel.
Fig. 2.
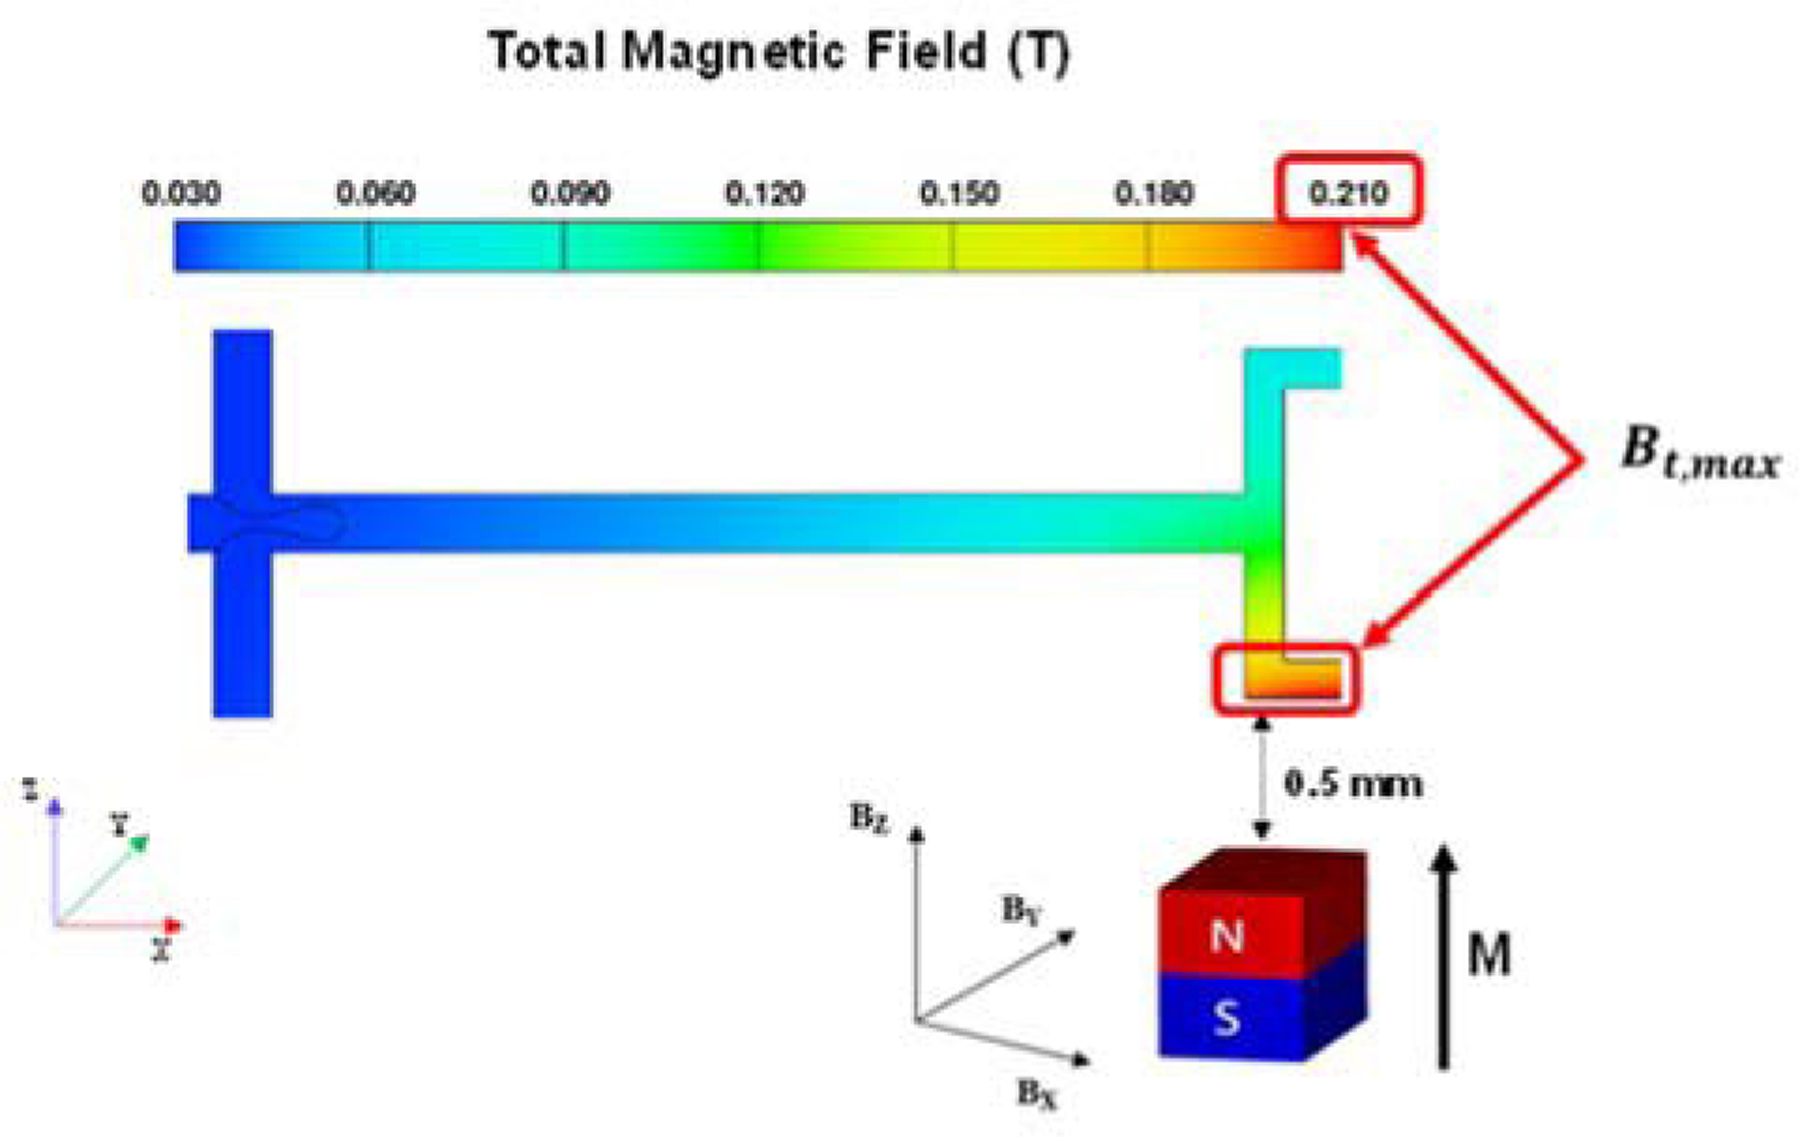
Magnetic field distribution in the microfluidic device.
The total magnitude of the magnetic flux density at every position can be calculated using eqn (7), where Bt,max in this case shows the maximum applied magnetic field at the channel bottom wall, which is approximately 210 mT as shown in Fig. 2.
| (7) |
Also, Fig. 2 shows a visualization of the magnetic field within the microchannel. Most of the channel is subjected to fields in excess of 50 mT. We have validated the actual magnetization of the permanent magnet by comparing measured and theoretical field distributions in our previously published work. These analyses were done using a MATLAB (version 2015, The MathWorks, Inc) model and a 3D magnetic field mapping instrument (the MMS-1-R from SENIS GmbH, www.senis.ch); theoretical predictions were in good agreement with the measured data. 39
For the sake of a consistent analysis, fully developed flow conditions were assumed for both types of analysis: with and without permanent magnet. The magnetic force density was calculated and programmed via a customized FORTRAN 90 subroutine compiled with Visual Studio 2010 (Microsoft), and integrated into FLOW-3D to predict the effect of the magnetic force density on the ferrofluid behavior. A uniform grid was used (44,000 cells) with an initial time step set to 10−6 s for all the simulations reported here. The simulations were performed on a 24-core workstation with 128 GB of RAM. On average, simulation runtime was ~24 h for cases with an applied magnetic field. Last but not least, a mesh dependency study was performed to ensure that the results were independent of the cell size.
2.3. COMSOL validation
The COMSOL Multiphysics software (www.comsol.com, version 5.5) was used to calculate the magnetic field distribution within the channel due to the magnet, for comparison with the analytical description used in FLOW-3D. The COMSOL model employed the finite-element method (FEM) to calculate the field numerically. There were 340,000 elements used in the COMSOL simulation to keep the model computationally efficient. We observed a 3.8% difference in the peak value of the magnetic field magnitude within the flow domain between the COMSOL result and the analytical approximation employed in the FLOW-3D simulations. The numerical analysis in COMSOL showed 202 mT for Bt,max.
Fig. 3 depicts the magnetic field lines and the lowest and highest magnetic field magnitude based on the same parameters used in FLOW-3D. Note that the magnetic force on the ferrofluid acts along these field lines, in the opposite direction to the arrows. The applied magnetic field was further analyzed using MATLAB to numerically solve for the full 3D magnetic field distribution throughout the domain. Five planes were defined at varying distances from the magnet to study the strength of the magnetic field at the T-outlet (Fig. S1). The MATLAB calculation in these five planes can help us to better understand the distribution of the magnetic field in the z-direction in which the permanent magnet has been magnetized, as can be seen in Fig. S2. The value of Bz,max ranges from 27.9 mT to 157 mT, from the top of the upper outlet to the bottom of the lower outlet. This vertical magnetic field gradient is, of course, responsible for directing the ferrofluid droplets to the lower channel, but can also accelerate them and trap them in the region of highest field. The results were in a good agreement with our FLOW-3D calculation of Bz,max (with percent error of less than 2%).
Fig. 3.
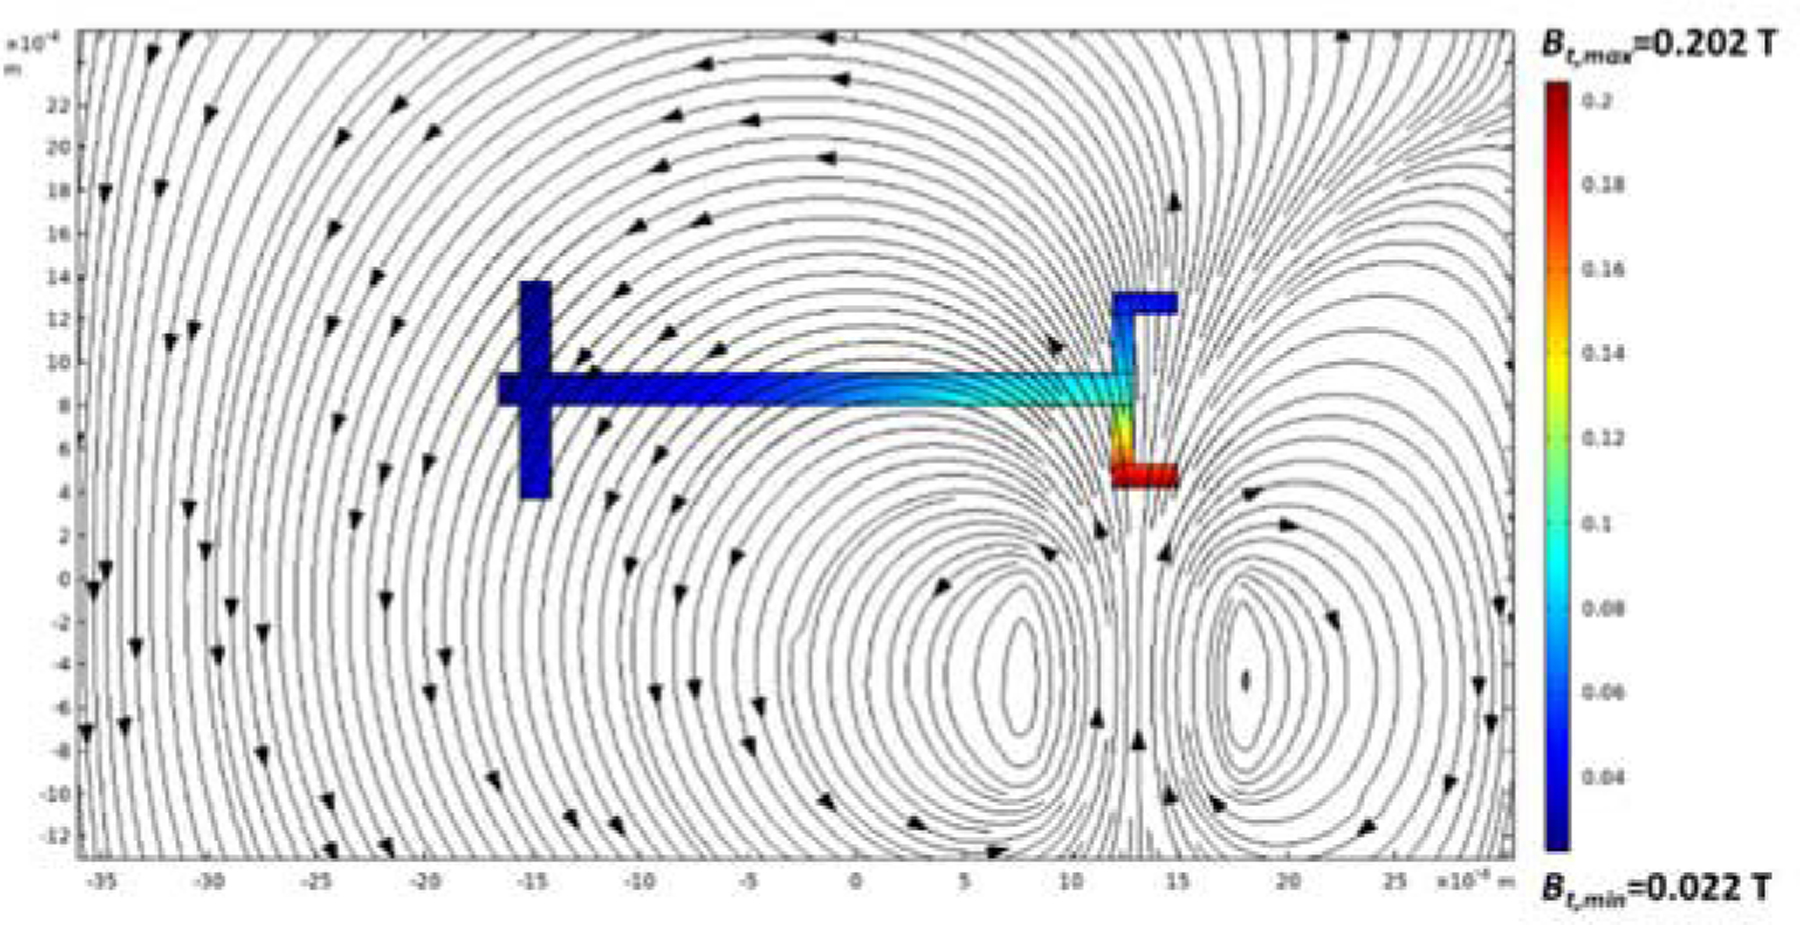
COMSOL solution for the applied magnetic field (B in Tesla) with minimum and maximum values of magnetic field strength.
2.4. Dimensionless numbers
Dimensionless numbers are routinely used to characterize fluid dynamic processes. Two dimensionless parameters were introduced to elucidate the effect of the magnetic field and the channel geometry (channel depth) and working conditions on the system behavior. The capillary number Ca is used to characterize the relative importance of viscous stresses and capillary pressure, i.e. the ratio among viscous loss inside the droplet and the surface tension. The magnetic Bond number, Bom , characterizes the importance of the magnetic force relative to surface tension. Ca and Bom are defined by eqns (8) and (9):
| (8) |
| (9) |
where η is the dynamic viscosity of the CP, σ is the interfacial tension between the two fluids, v0 is a characteristic velocity, taken here as the average velocity of the continuous phase at the inlet boundary, and R0 is the radius of an undeformed droplet that is used as the characteristic length scale, where V is the volume of a droplet, and M is the magnetization density of the ferrofluid.40
3. Results and discussion
In this section, the influence of the flow rate and the volume percentage of the ferrofluid under an applied magnetic field is explored for all three channel depths (25, 30, and 40 µm). First, the droplet volume and diameter are presented and then the dimensionless parameters are considered. In the case of zero magnetic field, we previously compared the numerical results for 50% (v/v) of ferrofluid with our experimental results and they were in a good agreement.38 More specifically, we used a flow-focusing droplet generation device fabricated in glass with similar dimensions as the one employed in this work and injected a commercial ferrofluid (oil-based ferrofluid, EMG901, Ferrotec) containing a suspension of Fe3O4 nanoparticles at a concentration of 11.8 vol %, diluted in cyclohexane (50% v/v), and an aqueous continuous phase. The comparison between the experimental and theoretical droplet diameters obtained there suggests that the model predictions are accurate compared to experimental data, with an average error of 4% in droplet size for the CP flow rate range under study.38 Moreover, in other experimental work, we varied the ferrofluid loading from 6.3% to 100% by diluting the ferrofluid stock solution with cyclohexane and the droplet diameter generated in a similar microchip was calculated. The results indicated that the droplet diameter slightly varied with the ferrofluid loading, and that the droplet volume remained in the picolitre range, which is comparable with our numerical model.41
In this work we expanded the numerical analysis to study the performance of a ferrofluid droplet under an applied magnetic field for two different volume percentages (i.e. 10% (v/v) and 50% (v/v) ferrofluid). The calculated magnetic field has a spatial gradient, which gives rise to body forces within ferrofluid droplets in both z and x-directions and therefore influences the related velocity components in a manner that depends on the gradient of the magnetic field. The applied magnetic field can also deform a droplet, i.e., stretch the droplet toward the permanent magnet where the field gradient is stronger. This could have an impact on the rate of the droplet formation at the flow-focusing inlet, on its shape and attachment to the channel walls during flow down the channel, and in its transport out of the device, where the magnet acts to trap it in the location of maximum field gradient.
3.1. Droplet generation
In the simulations described here, the oil-based ferrofluid DP was injected at a flow rate of 10 μL·h−1 while Qc varied between 100 μL·h−1 and 500 μL·h−1. Three channel depths of 25, 30 and 40 µm were considered, with and without the magnet present. Fig. 4 illustrates the main features of droplet generation for the 25 µm channel depth and CP flow rate of 200 µL·h−1. It compares behavior for the two different ferrofluid concentrations, with different magnetizations and viscosities, and compares the performance with and without a magnetic field. Fig. 4 a) and b) depict the size of the droplet for 10% and 50% (v/v) ferrofluids at the time of droplet formation (pinch-off), showing that droplet diameter is larger for 10% (v/v). Fig. 4 c) and d) confirm the droplet size difference between the two volume percentages. Fig. 4 e) and f) show droplet generation simulation results without a magnetic field, corresponding to the top parts of panels a) and b). These snapshots are helpful in visualizing the droplet formation behavior. Additional visualizations are provided as supporting information (supplementary videos). However, drawing more quantitative conclusions requires further analysis and averaging over multiple droplet-formation events.
Fig. 4.
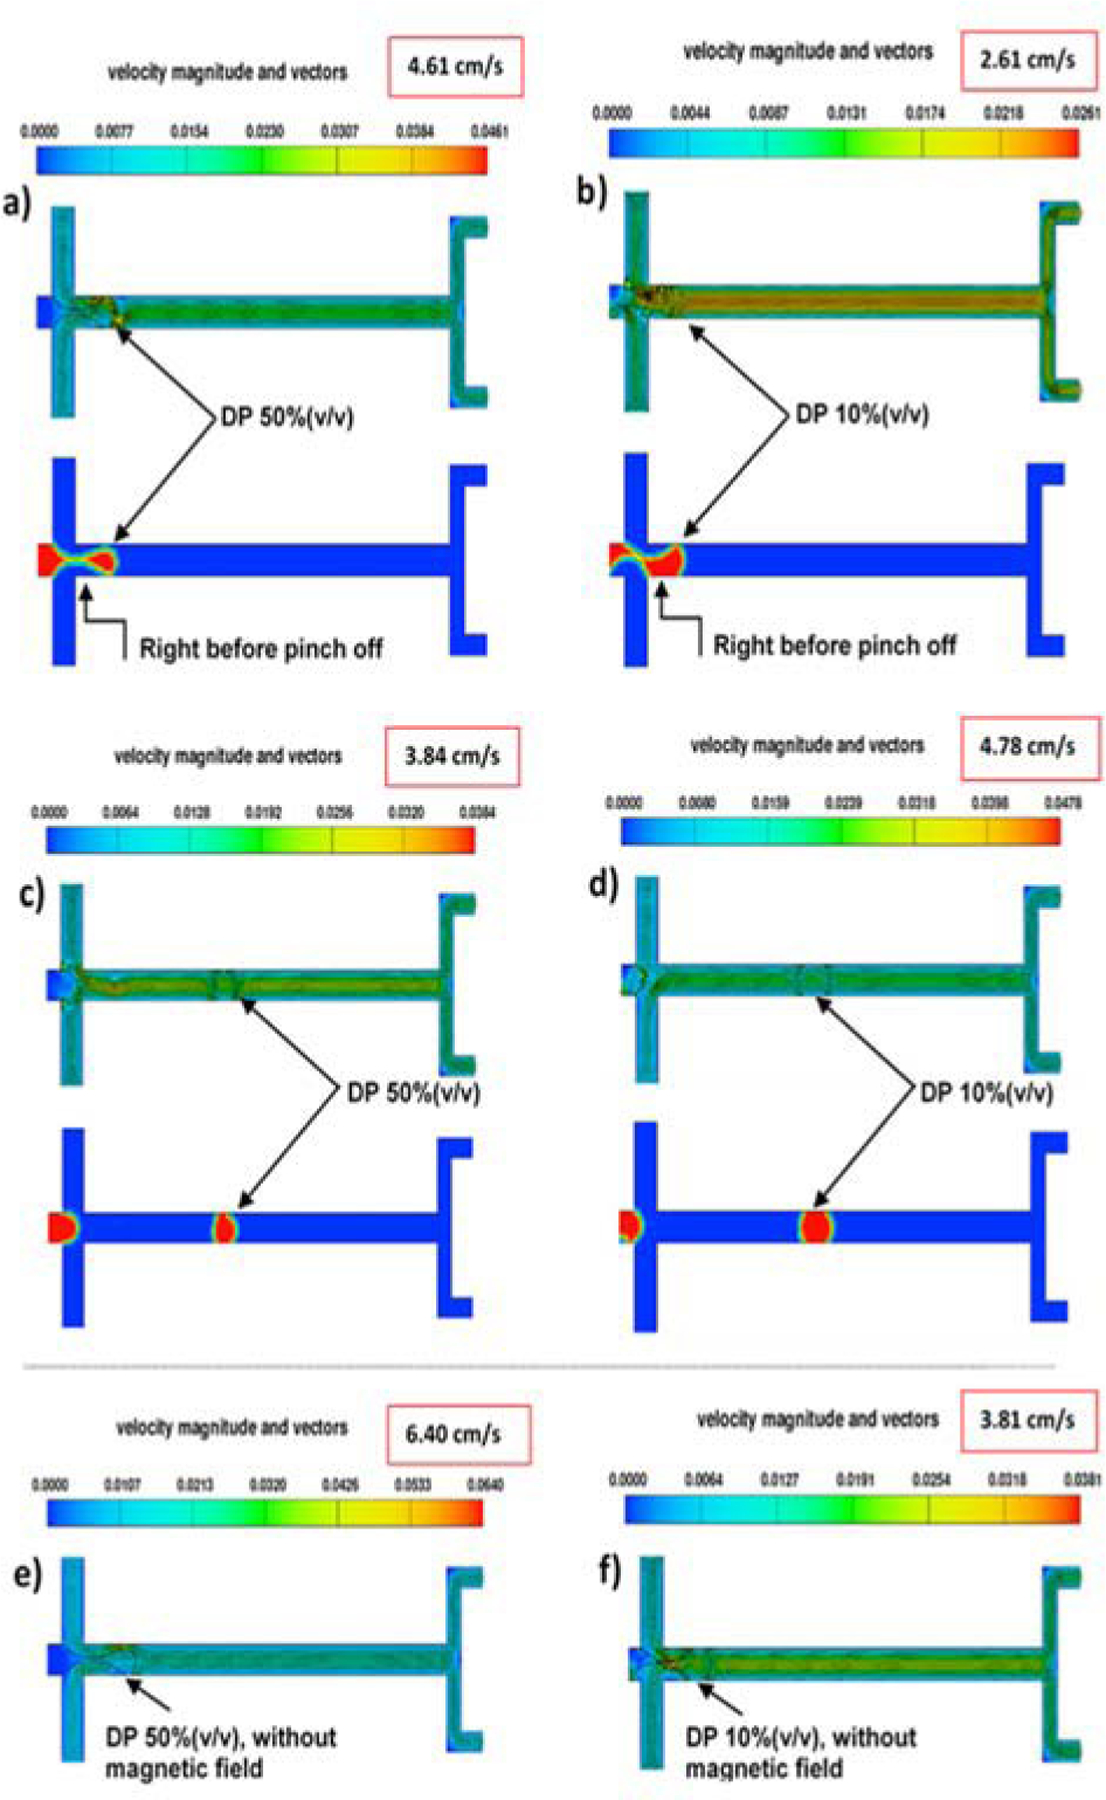
Droplet generation visualization for the 25 µm deep channel at Qc = 200 µL·h−1. a) and c) droplet generation for the 50% (v/v) ferrofluid under an applied magnetic field at different time points, before and after droplet pinch-off; b) and d) droplet generation for the 10% (v/v) ferrofluid under an applied magnetic field at different time points, before and after droplet pinch-off; e) droplet generation for the 50% (v/v) ferrofluid without magnetic field; and f) droplet generation for the 10% (v/v) ferrofluid without magnetic field.
3.2. Influence of magnetic field and flow rate on droplet volume
Various factors, including magnetic forces, interfacial tension, shear stress at the fluid-fluid interface, and applied magnetic field can distort the shape of the droplet, either while it is being generated or in the microchannel before it reaches the outlet. First, we consider the droplet generation process. Fig. 5 depicts the droplet volume (nL) variation as a function of Qc for the 10% (v/v) ferrofluid under an applied magnetic field for all three channel depths. As illustrated by the velocity contours of Fig. 4, ferrofluid droplets are generated at the flow-focusing region at a smaller peak velocity under an applied magnetic field than without an external field. The peak velocity near the droplet at pinch-off is related to the maximum shear stress applied to the droplet by the CP.
Fig. 5.
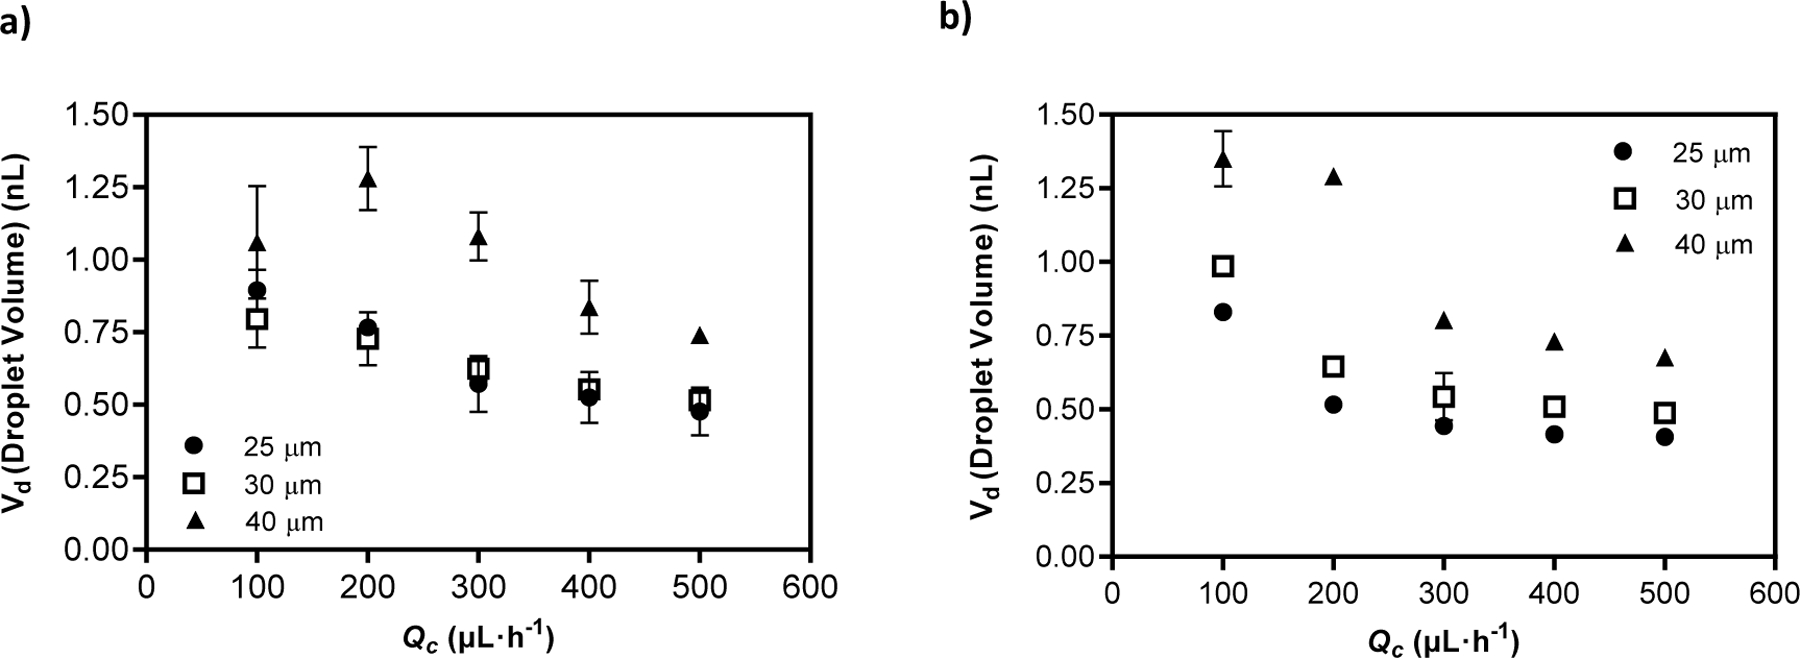
Volume changes for all three channel depths with respect to CP flow rate (Qc) for a) the 10% (v/v) ferrofluid and b) the 50% (v/v) ferrofluid under an applied magnetic field.
This peak velocity is higher for the 50% (v/v) ferrofluid than for the 10% (v/v) ferrofluid because of the higher viscosity of the 50% (v/v) ferrofluid. The peak velocity is lower in the presence of an applied magnetic field because the magnetic force acts along with the shear stress to promote droplet formation. The forming droplet is attracted to the magnet, and therefore, a smaller shear force is required for its formation. A more significant effect was the decrease in the variability of droplet size in the presence of strong magnetic interactions. As shown in Fig. 5, the range of droplet volumes observed, as indicated by the error bars in the plots, became narrower with increasing the CP flow rate, and was much narrower for the 50% (v/v) ferrofluid than for the 10% (v/v) ferrofluid. We attribute this to the stronger magnetic force in the former case. This is also evident in the comparison of the droplet volumes with and without the application of a magnetic field (Supplementary Fig. S3 and S4).
Thus, we conclude that the application of a magnetic field, for which the primary purpose is directing droplet motion at the channel T-outlet, also has the effect of slightly decreasing the size and improving the uniformity of the droplets as they are generated. As illustrated in Fig. 5, the droplet volume generally decreases with increasing the CP flow rate, because the higher CP velocity produces higher shear stress at the interface with the forming droplet. As one would intuitively expect, the droplet volume increases with increasing the channel depth. Droplet sizes decreased for the 50% (v/v) ferrofluid by an average of 23% for 25 µm channel depth and 1.5% and 3% for 30 µm and 40 µm, respectively, when the flow rate was increased from 100 µL·h−1 to 500 µL·h−1. On the contrary, upon increasing the depth, sizes increase by an average of 52% from 30 µm to 40 µm channel depth for the 50% (v/v) ferrofluid and 55% for the 10% (v/v) ferrofluid. For 25 µm, the changes for average percentage variation to deeper channel depth (30 µm) was not significant for the 10% (v/v) ferrofluid. On the contrary, for the 50% (v/v) ferrofluid, the average percentage increase from 25 µm to 30 µm was approximately 21%, from 0.522 nL to 0.634 nL, for the defined range of flow rates (100 µL·h−1 to 500 µL·h−1). The droplet volume is slightly smaller in the presence of an applied magnetic field for most of the flow rates, as can be seen in Figs. S3 through S8. At the lowest CP flow rates, somewhat anomalous behavior was observed, mainly for the largest channel depth; these cases did not follow the broader trends of decreasing droplet size with increasing CP flow rate and with application of a magnetic field. Finally, the effect of ferrofluid concentration does not significantly affect the droplet volume, particularly for deeper channel depths (it varies by less than 5%) upon increasing from 10% to 50% the volume of ferrofluid in the DP. However, changes in channel depth play an important role in droplet size variations based on the observed results that show an average increase of 53% from 30 µm to 40 µm channel depth for both ferrofluid concentrations. Note that this increase exceeds the increase in cross-sectional area of the channel (33%).
Thus, the size of the generated droplets varies with channel depth and flow rate. When Qc is relatively small, the size of the formed droplets is comparatively large and is also somewhat variable, i.e., a range of droplet sizes is observed. As Qc increases, the droplet sizes for all geometries decrease and become more uniform. The droplet sizes obtained for all cases are similar for high flow rates, i.e. 400 µL·h−1 and 500 µL·h−1. The observed results are in good agreement with previous studies. 21,22 Examples of the magnetic force acting on the droplets are shown in Fig. 6, with panels a) and b) showing the forces acting before detachment of a droplet from the upper wall, and panels c) and d) showing them at a time when the droplet reaches the bottom of the T-outlet. The forces act on the magnetic material (ferrofluid DP phase) and are zero in the CP. Since the magnetization of the permanent magnet is parallel to the z-direction, we observe higher forces in this direction (Fz) compared to Fx. When the droplet is close to the permanent magnet, it experiences the maximum force (maximum magnetic field gradient location). The force values are negative in Fig. 6 c) and d) because of the direction of the magnetic field (see Fig. 3).
Fig. 6.
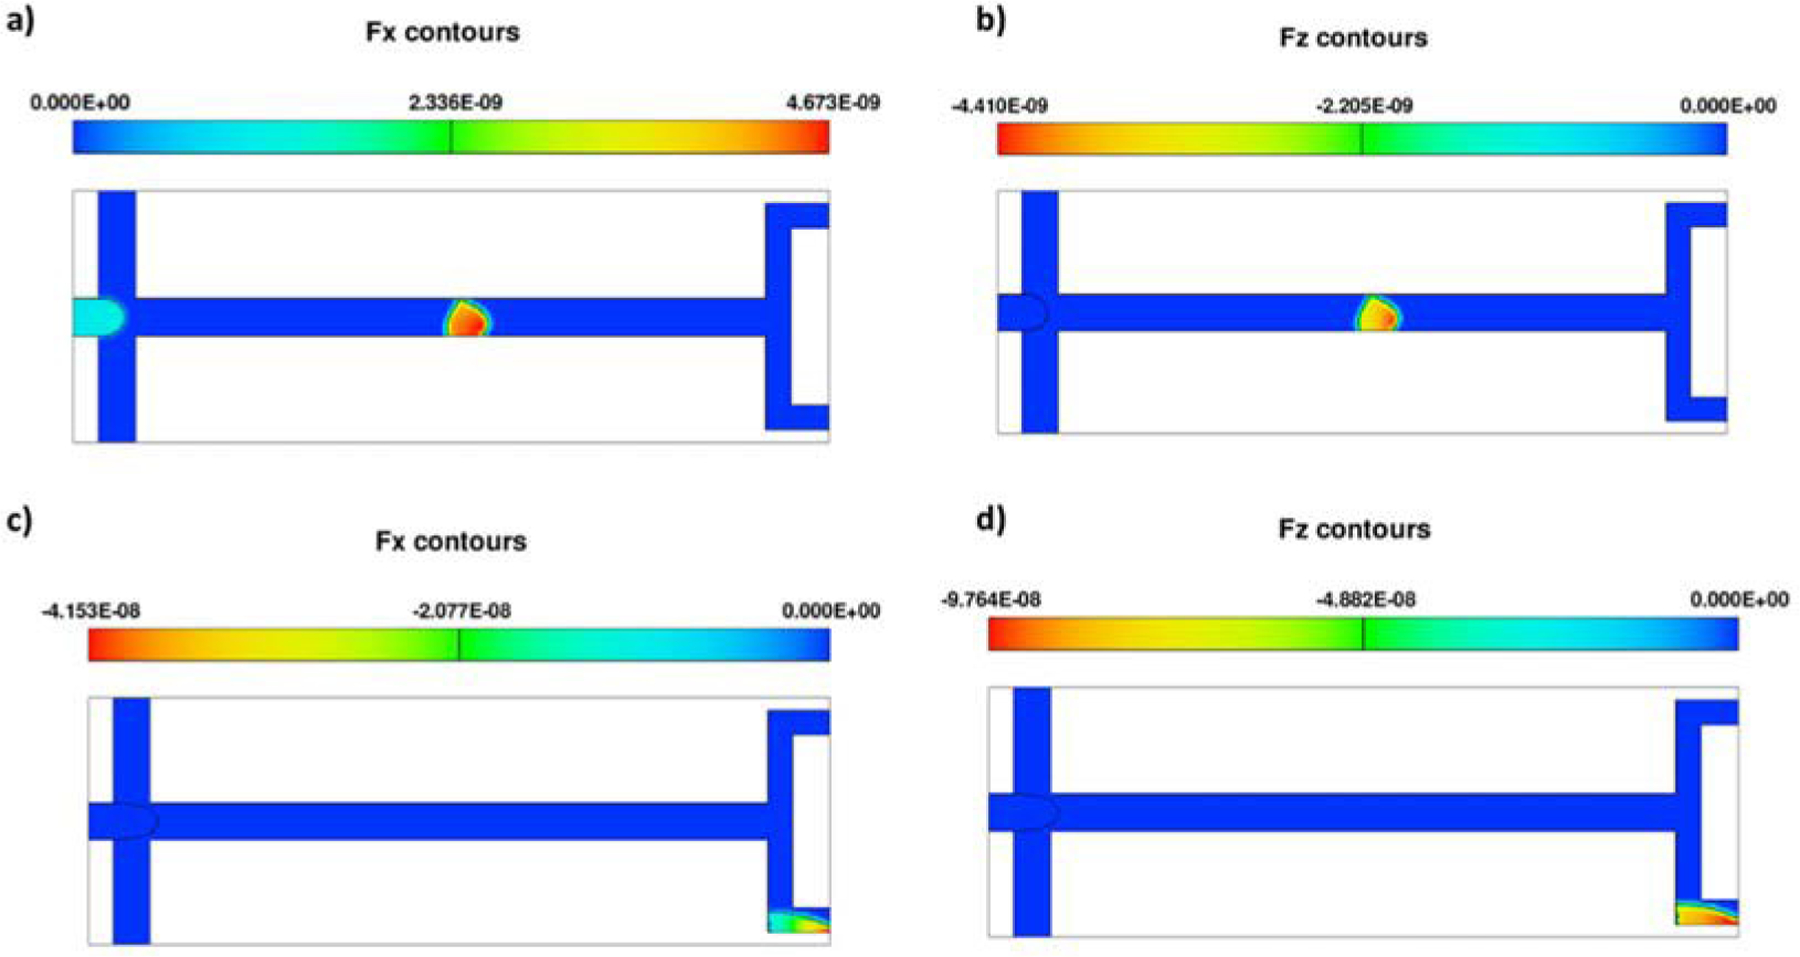
Body force on a droplet for a) Fx and b) Fz before detachment from the upper wall, c) Fx and d) Fz when a droplet arrives at the lower outlet
3.3. Rate of droplet formation
The dispensing rate was also studied as a function of the CP flow rate for the three channel depths modeled in this study. Results are presented as the time interval between droplet formation, which is well defined for each droplet generation event, whereas the dispensing rate is better viewed as an average over many droplets. For the fixed DP flow rate used here, the interval between droplets and the droplet volume are closely related, but due to the transient nature of the flow, it is not exactly proportional for each droplet formation event. In all cases, the dispensing rate increases (interval between drops decreases) as the CP flow rate (Qc) increases. For both ferrofluid volume percentages (10% and 50% (v/v)), the highest dispensing rate is obtained for the shallowest channel, 25 µm. This is a direct result of the higher velocities in the shallower channel for fixed overall flow rates. High velocities for the 25 µm channel depth are converted to high dispensing rates and smaller droplet volumes and diameters.
The effect of an applied magnetic field can be found by comparing Fig. 7 a) and b), in which the time interval for droplet formation decreases for the 40 µm channel depth. Expressed as an average droplet generation frequency, we observe a narrower range of 3.1 drop·s−1 to 3.9 drops·s−1 with an applied magnetic field vs. 2.1 drops·s−1 to 4.1 drops·s−1 without a magnetic field, as Qc increases from 100 to 500 µL·h−1 in each case. The application of the magnetic field has the greatest effect at low flow rates, where viscous shear forces are smallest. For the 10% (v/v) ferrofluid, the effect of the magnetic field was small, but for the 50% (v/v) ferrofluid, the changes were more significant. Upon comparing the results with and without a magnetic field, we also observe that the data for the 50% (v/v) ferrofluid has less variability (indicated by smaller error bars) than those for the 10% (v/v) ferrofluid. The applied magnetic force on the droplet makes the droplet formation event more consistent and reproducible. Although the field is not as strong in the droplet formation region as it is near the T-junction outlet, our results do show an increased rate of droplet generation (decreased droplet volume) under an external magnetic field.
Fig. 7.
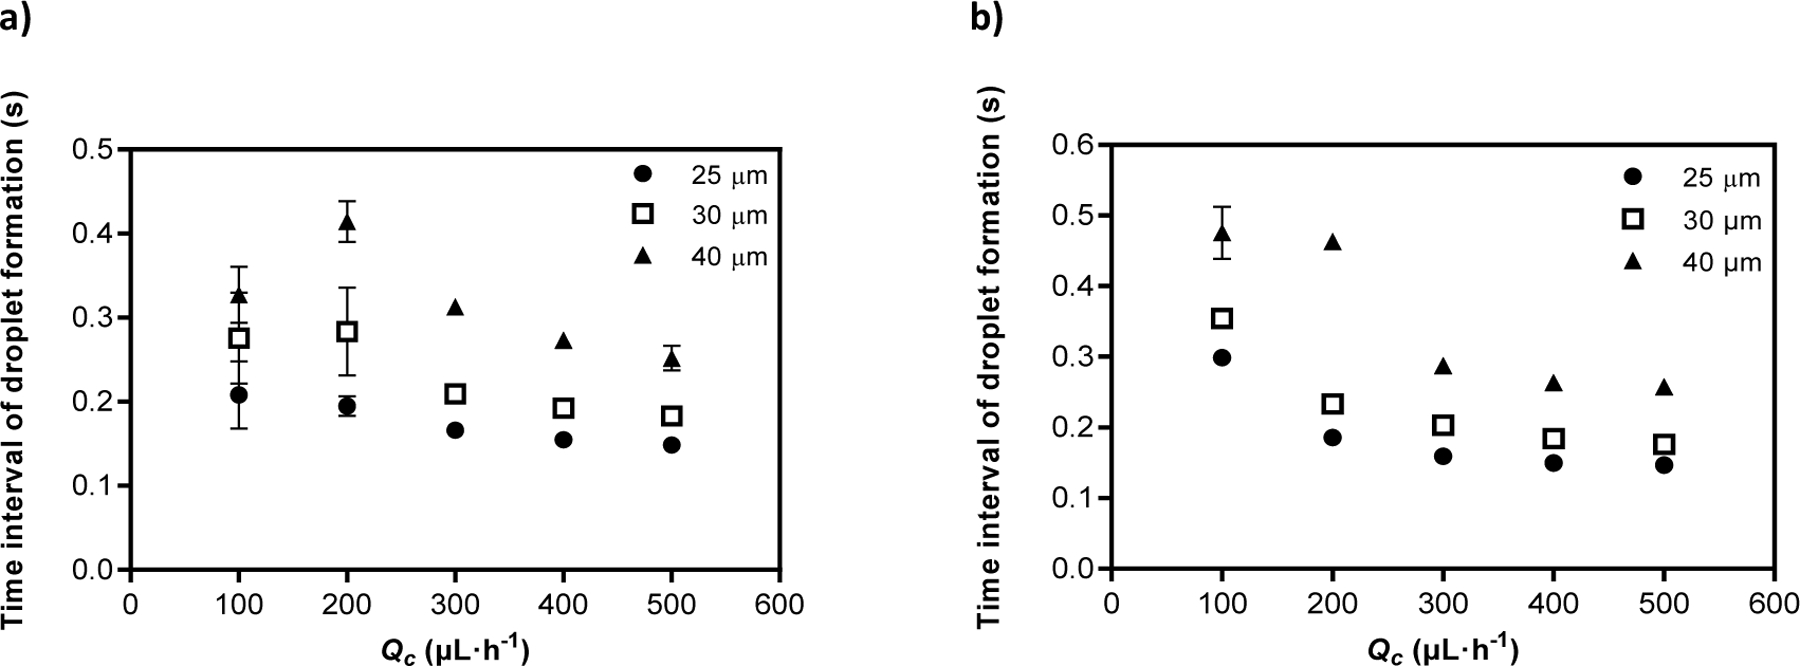
Rate of droplet formation in devices with three different channel depths, for the 50% (v/v) ferrofluid a) without and b) with an applied magnetic field.
3.4. Dimensionless numbers
In this subsection we analyze the dimensionless Ca and Bom with respect to flow rate and diameter of the droplets. As mentioned before, Bom characterizes the strength of an applied magnetic force in comparison with surface tension forces. Fig. 8 indicates the changes of Bom for the three channel depths with respect to changes in flow rate (Qc =100 µL·h−1-500 µL·h−1). The Bond number increases with the channel depth, as one would expect, because the magnetic force is proportional to droplet volume, while surface tension forces depend upon droplet surface area and curvature. In addition, Bom is proportional to droplet volume to the ⅓ power, so it decreases slightly with increasing flow rate as the droplet volume decreases. Fig. 9 presents the magnetic Bond number as a function of the capillary number. For the 50% (v/v) ferrofluid (Fig. 9 b)), the results for the three channel depths are quite similar, reflecting the importance of the magnetic forces in this case. However, for the 10% (v/v) ferrofluid (Fig. 9 a)), the results for the 40 µm channel depth differ substantially from the other depths. The absolute values of the Bond number in this case are also much smaller. This is consistent with the relatively lower importance of the magnetic forces for the less concentrated ferrofluid, such that the magnetic Bond number is no longer a good scaling parameter. The results for the 50% (v/v) ferrofluid show a slight decrease in the magnetic Bond number with increasing capillary number over the range of Qc=100 µL·h−1 to 500 µL·h−1. Overall, the magnetic Bond number changes over a relatively narrow range, both in response to changes in flow rate (capillary number) and channel depth. As shown in Fig. 9, a single power-law fit reasonably captures the dependence of Bom on Ca, with all of the results falling within 5% of the curve and mean absolute deviation between the curve and simulation results of just 14.3%.
Fig. 8.
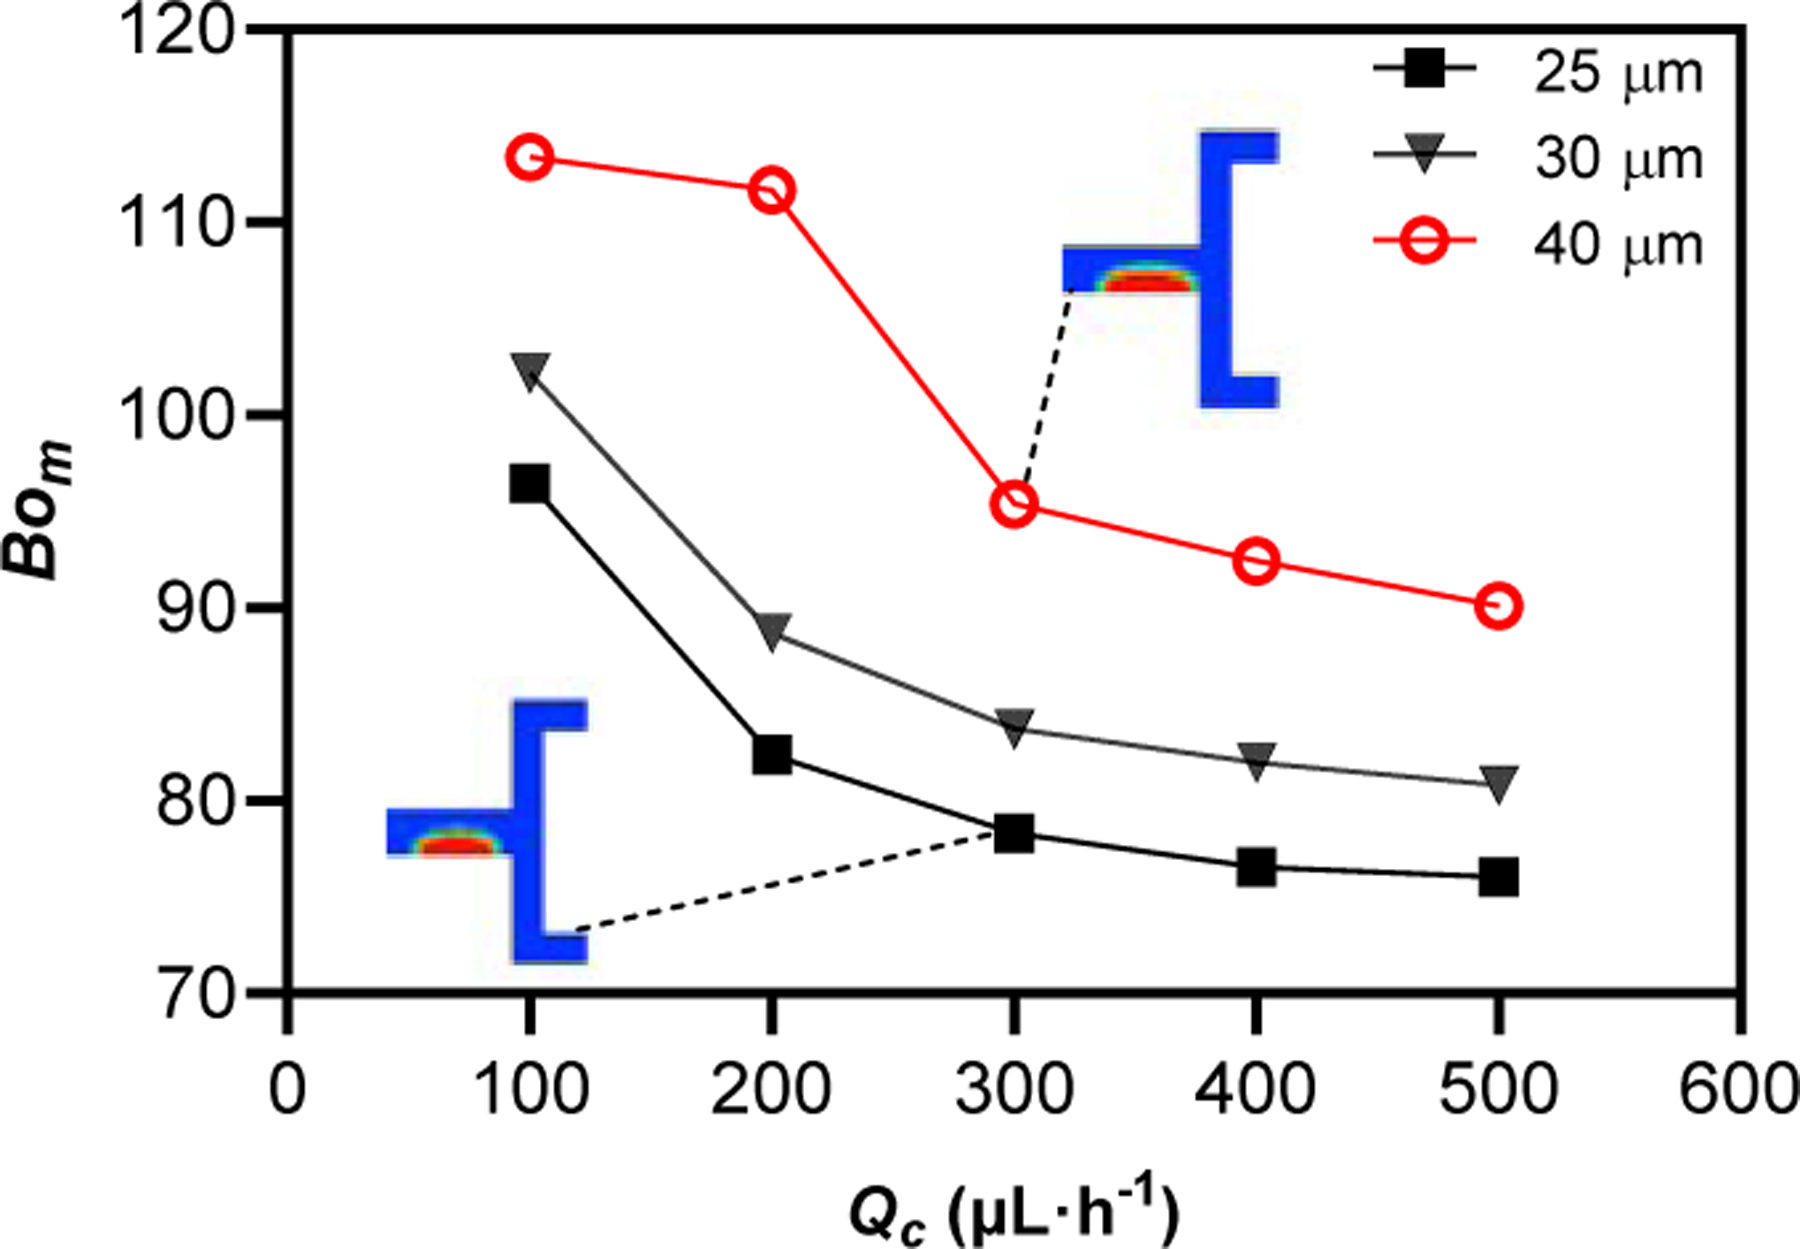
Magnetic Bond number (Bom) versus Qc for the 50% (v/v) ferrofluid DP.
Fig. 9:
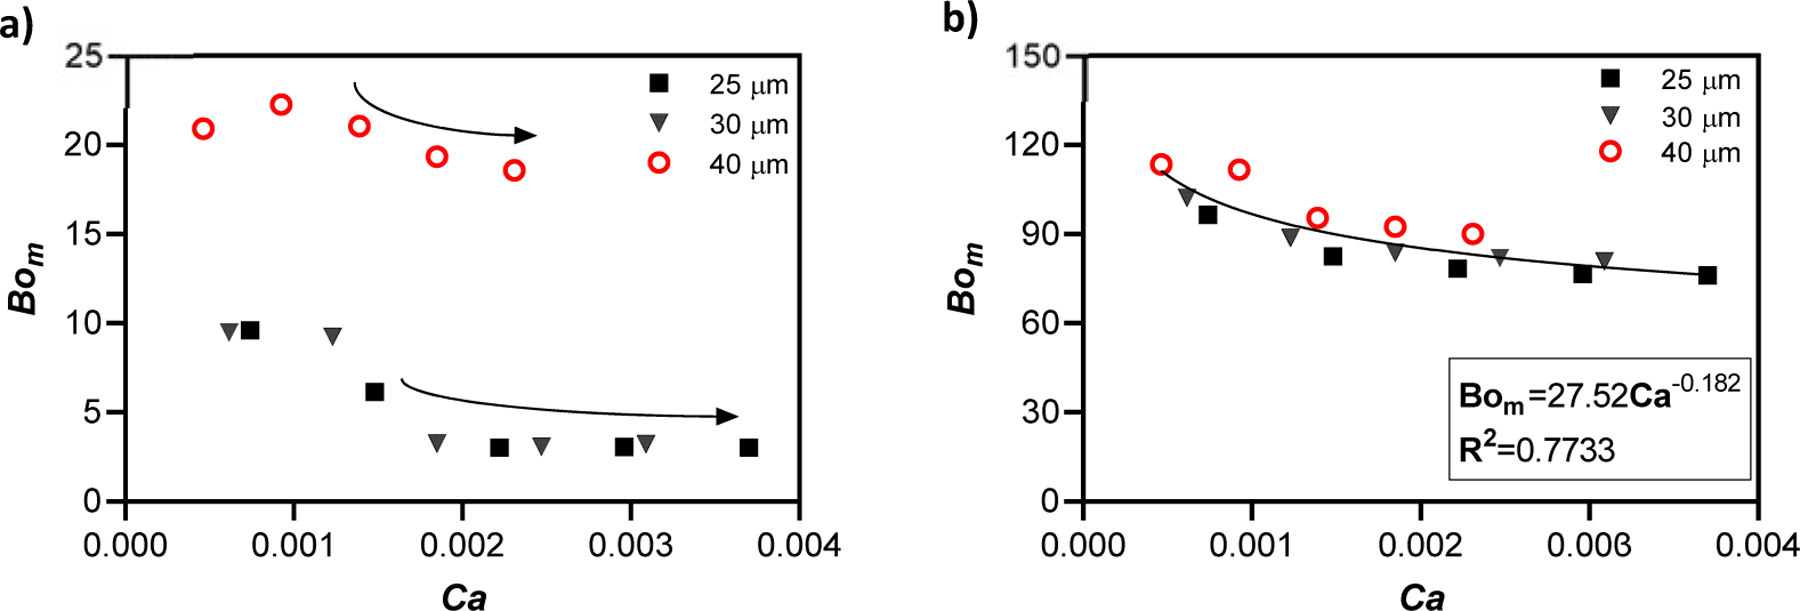
Changes of magnetic Bond number (Bom) with Ca for a) 10% (v/v) and b) 50% (v/v) ferrofluid.
3.5. Elongation of droplets
The elongation of each droplet for each flow rate was measured right after pinch off (at the beginning of microchannel) and before droplet reached the outlet (at the end of the straight section of the microchannel). Due to the stronger magnetic field gradient near the outlet, as droplet approaches that end, it starts to deform and stretches. For the 50% (v/v) ferrofluid, droplets detach from the upper wall of the microchannel in most cases, because of the greater force exerted at higher concentration of magnetic nanoparticles. Only a few cases of detachment from the upper wall were observed for the 10% (v/v) ferrofluid. At low capillary numbers (low flow velocity), a ferrofluid droplet basically adopts a rounded shape, constrained by the channel walls, as shown in Fig. 10 a). As the magnetic force increases, the droplet is deformed. When the magnetic force exceeds other forces acting on the droplet (e.g. surface tension and hydrodynamic forces), it detaches from the upper wall. The magnetic force first causes droplet deformation (the fluid/fluid interface forms a sharp corner along the right edge as it is attracted to the permanent magnet) as seen in Fig. 10 b). As seen in Figs. 10 c) and d), when the velocity is higher, the droplet volume is smaller, and consequently, the dimensionless Bom decreases at higher Ca.
Fig. 10.
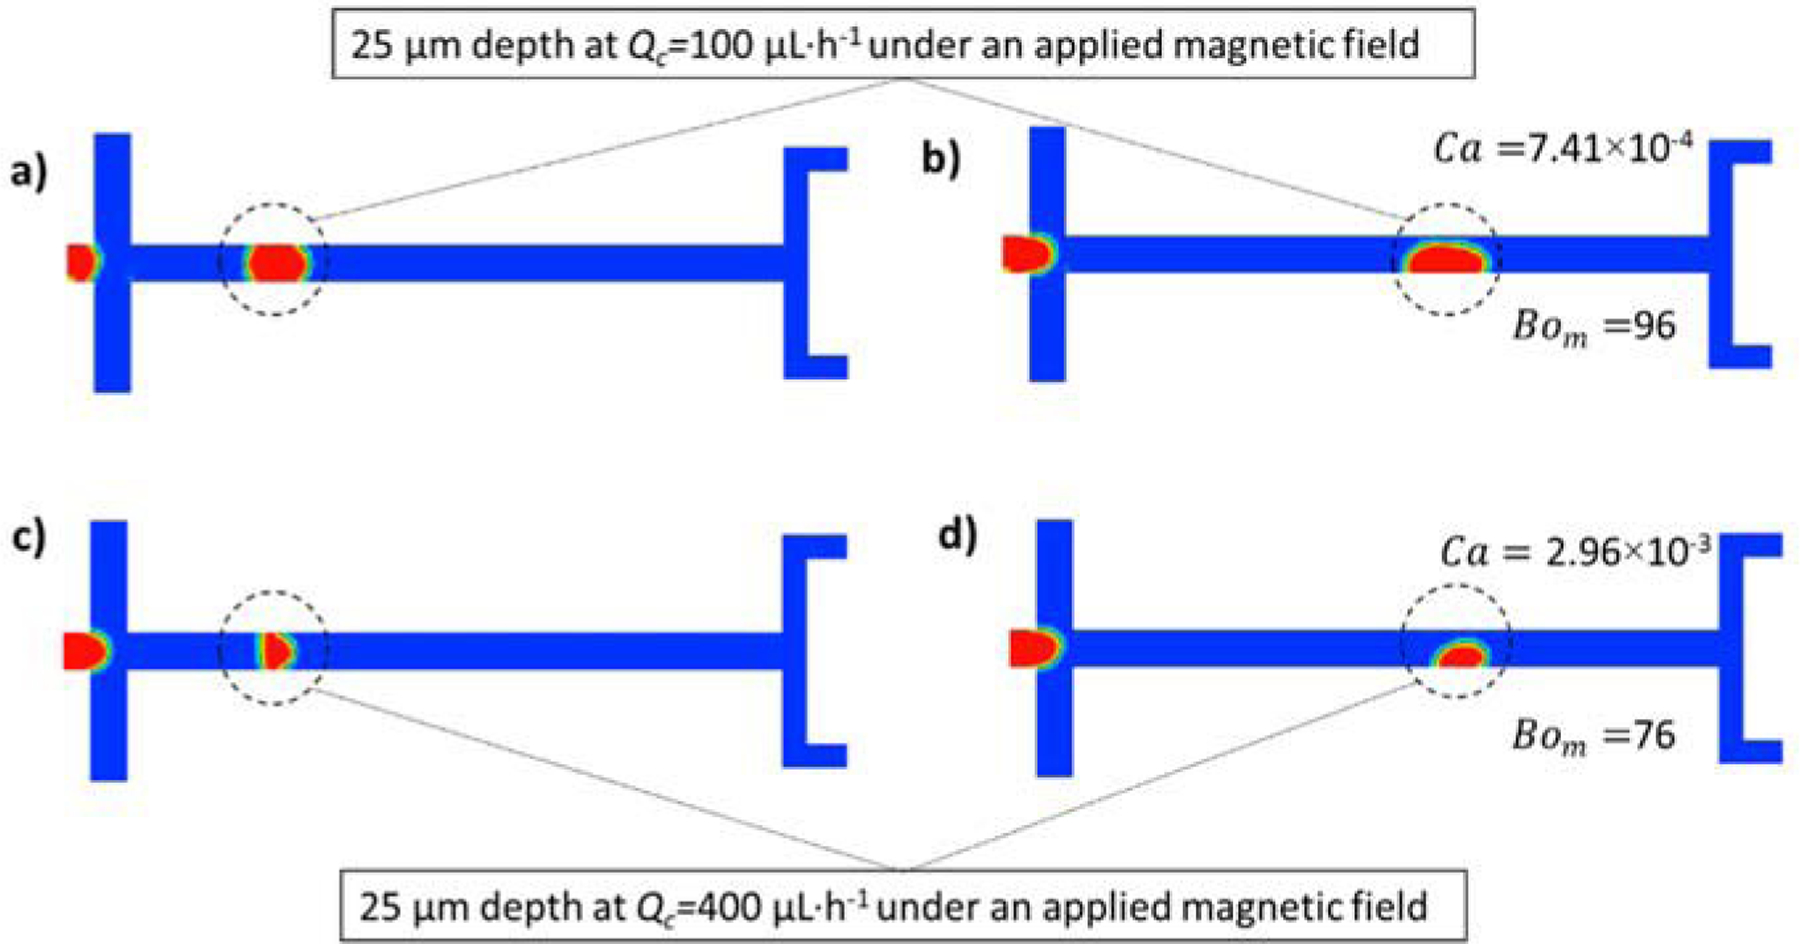
Droplet shapes for 50% (v/v) of ferrofluid for 25 μm deep channels. a) and b) Qc= 100 μL·h−1 under an applied magnetic field c) and d) Qc= 400 μL·h−1 under an applied magnetic field.
For the cases illustrated in Fig. 10, the magnetic force is sufficient to detach the droplet from the upper wall of the channel. This involves a wetting transition in which the flow velocity, interfacial tension, and the magnetic force each play a role. Detachment generates new fluid-fluid interface, which is resisted by interfacial tension forces. Once a droplet has detached, the less viscous continuous phase can flow past the droplet, generating shear forces on the droplet. As the droplet reaches a region of higher magnetic field, increasing the magnetic force, the droplet stretches and forms a tail which is known as rivulet. 42 Based on the strength of the magnetic field, the elongated droplet and the next formed droplet might move towards the previous detached droplet to form a secondary stream at the bottom of the T-shaped outlet.
Elongation was measured as the maximum extent of the dispersed phase in the x-direction. Herein, we present this elongation as a function of capillary number. As can be seen in Fig. S9, the elongation of droplets decreases with increasing capillary number. This result confirms that, as the velocity gets higher, droplets not only decrease in volume, but also are less distorted under an applied magnetic field. For low capillary numbers, at 10% (v/v) of ferrofluid, droplets with bigger diameters are seen (elongation of droplets in the x-direction), which could be due to inconsistency of droplet formation at lower flow rates.
On average, the droplet size for the 10% (v/v) ferrofluid varies from 134 µm to 246 µm depending on the chip depth, while for the 50% (v/v) ferrofluid it varies from 125 µm to 257 µm. At the smaller flow rates, i.e. 100 µL·h−1 and 200 µL·h−1, this result might differ as other forces could dominate over an applied magnetic field while droplet was forming. This could be due to the inhomogeneous droplets observed for these flow conditions. As we reported in the previous sections, the variation in droplet volume for lower flow rates is larger in comparison to 500 µL·h−1.
When a droplet forms in the microchannel right after the pinch off close to the flow-focusing configuration, the magnetic field gradient is not as strong as at the end of the channel before the T-outlet. Therefore, this inhomogeneous applied magnetic field causes the droplet to stretch and deform as it travels along the microchannel (before it gets to the T-outlet). To quantify this phenomenon, we have analyzed the elongation behavior of each droplet and we have compared the results for all three channel depths in Fig. 11 a)-c). For all three depths (Fig. 11 a), b), and c)), the 50% (v/v) ferrofluid shows the greatest deformation. In addition, the 50% (v/v) ferrofluid is more uniform due to steady decrement of droplet diameter as velocity increases, while for the 10% (v/v) ferrofluid, it increased from 100 µL·h−1 to 200 µL·h−1 for 25 µm and 40 µm deep channels. Overall, as the velocity and Ca increase, deformation decreases but remains noticeable.
Fig. 11.
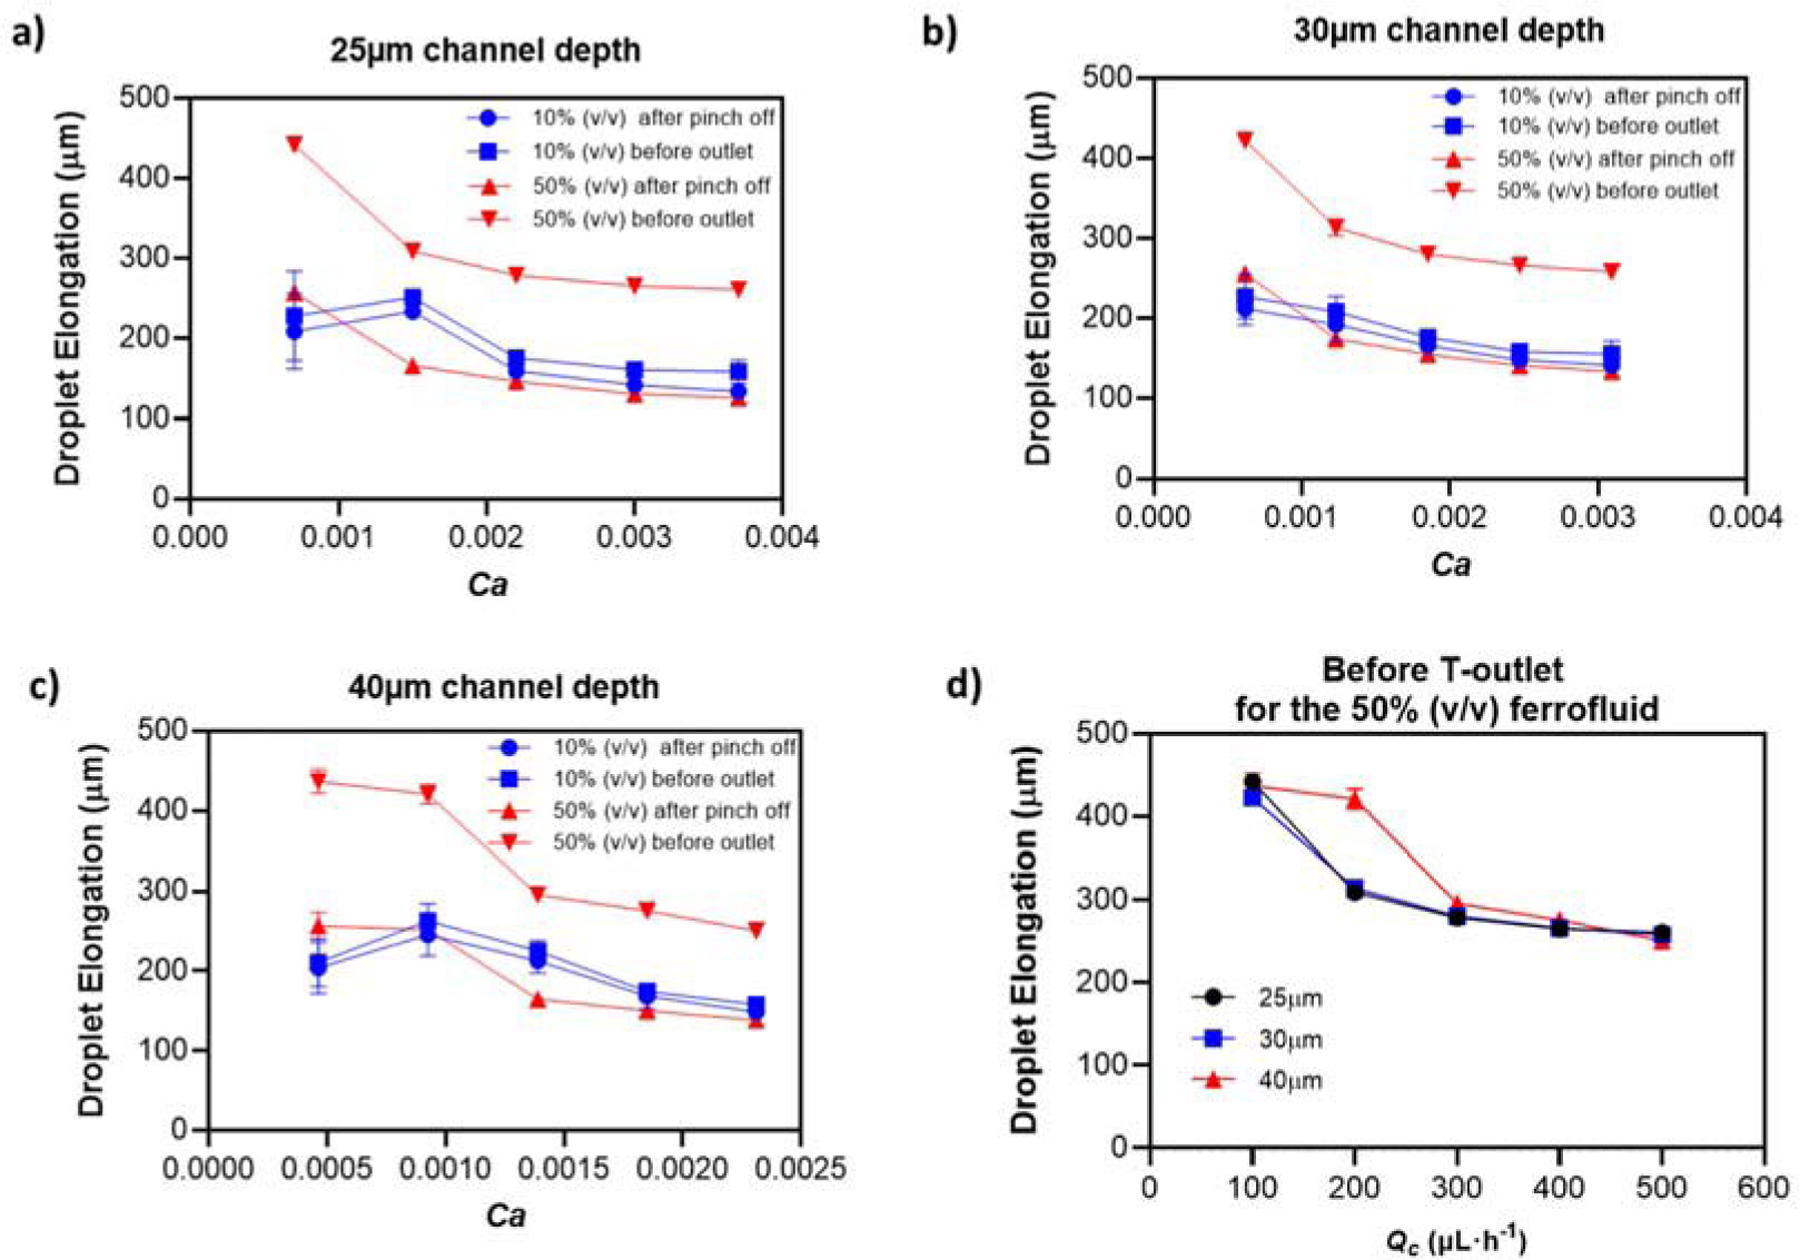
Analysis of droplet elongation vs. Ca and Qc. Droplet elongation vs. Ca for channel depths of a) 25 µm; b) 30 µm; and c) 40 µm depth under an applied magnetic field (elongation measured at the droplet formation region and at the end of the straight section of the microchannel; d) deformation of the droplet before reaching the outlet for the three channel depths vs. Qc.
Due to the bigger changes observed for higher ferrofluid volume percentages, we have analysed the elongation for all three channel depths for the 50% (v/v) ferrofluid in Fig. 11 d), at the point where the droplet reaches the end of the straight channel before entering the T-outlet. By comparing this graph and reported volume in Fig. 5 b), the same peak at the 200 µL·h−1 for 40 µm depth can be observed. This shows the correlation between the droplet volume and its deformation under an inhomogeneous magnetic field.
We have defined a ratio for the droplet elongation to better evaluate our system. It has been defined as R = d1/d2, where d1 is the diameter observed at its formation (at the beginning of the channel) and d2 is the diameter at the end of the channel. Because of the application of a magnetic force on a droplet, the R value is always greater than 1 and as the value increases it shows a greater deformation of the droplets. Typically, this value decreases as the channel gets deeper (from 25 µm to 40 µm). The following ratios support the previous statement where the average ratio (R) for the 25 µm deep channel and with the 10% (v/v) ferrofluid is 1.117 (R is 1.078 and 1.053 for 30 and 40 µm deep channels, respectively). Fig. 12 a) shows the changes of R with respect to Ca, illustrating the increase of R for the 25 µm deep channel with the CP velocity, without a pronounced increase for the 30 and 40 µm deep channels. Overall, for the 10 % (v/v) ferrofluid, R is close to 1, and the changes in it are small, consistent with the observation that droplet detachment was rarely, if ever, observed. These ratios for the 50% (v/v) ferrofluid are greater due to greater magnetic force generated (as it was discussed for Bom). More specifically, they average 1.924, 1.819 and 1.761 for the 25, 30, and 40 µm deep channels, as shown in Fig. 12 b). Compared to the 10% (v/v) ferrofluid, the values of R are much larger and also change over a much wider range, reflecting the droplet detachment and extensive deformation observed for the 50% (v/v) ferrofluid.
Fig. 12.
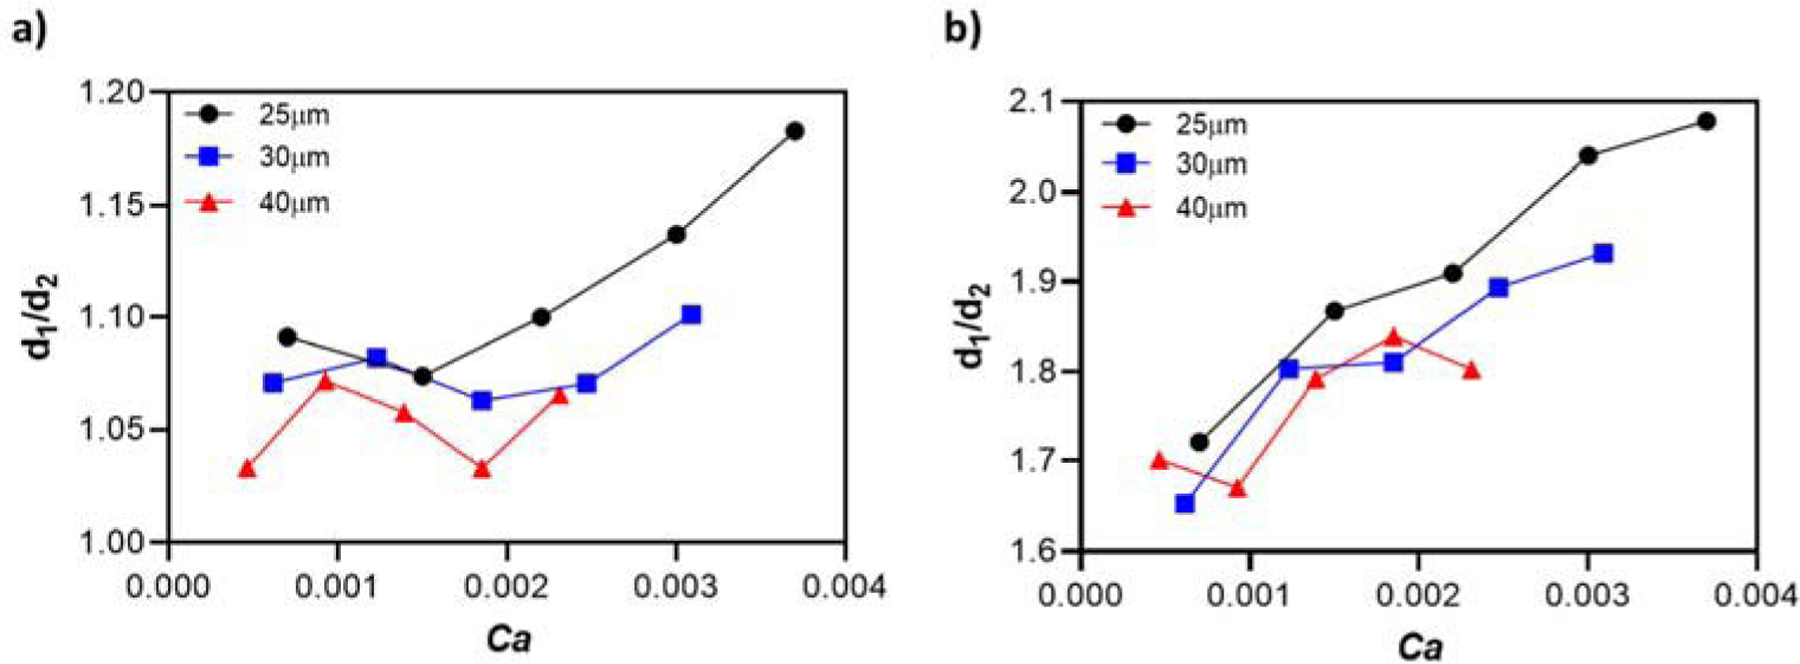
Diameter ratio evolution as a function of Ca for a) 10% (v/v) ferrofluid and b) 50% (v/v) ferrofluid under an applied magnetic field.
Conclusions
In this study, we demonstrated a CFD method to examine the dynamic performance of ferrofluid droplets in microchannels of varying depth, continuous phase flow rate, and ferrofluid content of the dispersed phase. The developed model predicts the generation of ferrofluid droplets along a flow-focusing channel for three considered channel depths: 25 µm, 30 µm, and 40 µm. The applied magnetic field was used to control the droplet performance inside the channel at different locations. The experimental validation of the analytical magnetic field distribution employed here has been previously carried out and the results are consistent with numerical evaluation of the magnetic field. The established model determines the influence of the magnetic field on the droplet generation and its further control at the T-junction outlet.
Firstly, the effect of different volume percentages of ferrofluid, 10% (v/v) and 50% (v/v), were investigated. The effect of the magnetic force and flow rate on the droplet volume was studied for all three channel depths. Furthermore, the time interval between droplet generation events showed that the magnetic field has the greatest effect at low flow rates, where viscous shear forces are smallest. For the 10% (v/v) ferrofluid, the effect of the magnetic field was small, but for the 50% (v/v) ferrofluid, the changes were more significant. The results for the rate of formation indicate that the highest dispensing rate, for given flow rates, was achieved in the shallowest channel, 25 µm deep, for both volume percentages of ferrofluids.
Secondly, 30 µm channel depth showed the greatest consistency for droplet diameter compared to the 25 µm and 40 µm deep channels, particularly for the 50% (v/v) ferrofluid DP. This conclusion can be derived from the time interval of droplet formation, droplet diameter, and droplet volume. The results have shown that higher flow rates tend to generate more uniform droplets. Therefore, for this considered range of flow rates, and for applications which are sensitive to the dimeter of droplets, operating at high flow rates is encouraged.
Lastly, it should be noted that this computational approach for modelling ferrofluid droplets could be a promising tool for a high number of applications in droplet-based microfluidics.
Supplementary Material
Acknowledgements
The research of this work was financially supported by the National Heart, Lung, and Blood Institute from the United States National Institutes of Health (1R01HL131720–01A1). The Spanish Ministry of Science, Innovation and Universities under the project RTI2018–093310-B-I00 (MINECO/FEDER, UE), and the FPU postgraduate research grant (FPU18/03525) is acknowledged.
Footnotes
Electronic Supplementary Information (ESI) available: MATLAB calculation of the magnetic field distribution, changes of volume and dimeter for all channel depths and both volume percentages, and droplet diameter in terms of capillary number.
Conflicts of interest
The authors declare no conflict of interest.
References
- 1.Convery N and Gadegaard N, Micro and Nano Engineering, 2019, 2, 76–91. [Google Scholar]
- 2.Seemann R, Brinkmann M, Pfohl T and Herminghaus S, Reports on Progress in Physics, 2011, 75, 016601. [DOI] [PubMed] [Google Scholar]
- 3.Mashaghi S, Abbaspourrad A, Weitz DA and van Oijen AM, TrAC Trends in Analytical Chemistry, 2016, 82, 118–125. [Google Scholar]
- 4.De Menech M, Garstecki P, Jousse F and Stone HA, Journal of Fluid Mechanics, 2008, 595, 141–161. [Google Scholar]
- 5.Sun Y, Kwok YC and Nguyen NT, Lab on a Chip, 2007, 7, 1012–1017. [DOI] [PubMed] [Google Scholar]
- 6.Serra M, Ferraro D, Pereiro I, Viovy JL and Descroix S, Lab on a Chip, 2017, 17, 3979–3999. [DOI] [PubMed] [Google Scholar]
- 7.Zhang Y and Nguyen N-T, Lab on a Chip, 2017, 17, 994–1008. [DOI] [PubMed] [Google Scholar]
- 8.Zha Y and Zhang J, AIP Advances, 2014, 4. [Google Scholar]
- 9.Zhu P and Wang L, Lab on a Chip, 2016, 17, 34–75. [DOI] [PubMed] [Google Scholar]
- 10.Sharma S, Srisa-Art M, Scott S, Asthana A and Cass A, in Microfluidic Diagnostics: Methods and Protocols, eds. Jenkins G and Mansfield CD, Humana Press, Totowa, NJ, 2013, DOI: 10.1007/978-1-62703-134-9_15, pp. 207–230. [DOI] [Google Scholar]
- 11.Utada AS, Fernandez-Nieves A, Stone HA and Weitz DA, Physical review letters, 2007, 99, 094502–094502. [DOI] [PubMed] [Google Scholar]
- 12.Garstecki P, Gitlin I, Diluzio W, Whitesides GM, Kumacheva E and Stone HA, Applied Physics Letters, 2004, 85, 2649–2651. [Google Scholar]
- 13.Ray A, Varma V, Jayaneel P, Sudharsan N, Wang Z and Ramanujan R, Sensors and Actuators. Part B, Chemical, 2017, 242, 760. [Google Scholar]
- 14.Link DR, Grasland-Mongrain E, Duri A, Sarrazin F, Cheng Z, Cristobal G, Marquez M and Weitz DA, Angewandte Chemie International Edition, 2006, 45, 2556–2560. [DOI] [PubMed] [Google Scholar]
- 15.Khater A, Mohammadi M, Mohamad A and Nezhad AS, Scientific Reports, 2019, 9, 3832. [DOI] [PMC free article] [PubMed] [Google Scholar]
- 16.Wang Y, Liu S, Zhang T, Cong H, Wei Y, Xu J, Ho Y-P, Kong S-K and Ho H-P, Lab on a Chip, 2019, 19, 3870–3879. [DOI] [PubMed] [Google Scholar]
- 17.Lombardi D and Dittrich P, Analytical and Bioanalytical Chemistry, 2011, 399, 347–352. [DOI] [PubMed] [Google Scholar]
- 18.Pamme N, Lab on a Chip, 2006, 6, 24–38. [DOI] [PubMed] [Google Scholar]
- 19.Shanko E-S, van de Burgt Y, Anderson PD and den Toonder JMJ, Micromachines, 2019, 10, 731. [DOI] [PMC free article] [PubMed] [Google Scholar]
- 20.Nguyen N-T, Zhu G, Chua Y-C, Phan V-N and Tan S-H, Langmuir : the ACS journal of surfaces and colloids, 2010, 26, 12553–12559. [DOI] [PubMed] [Google Scholar]
- 21.Jamalabadi MYA, DaqiqShirazi M, Kosar A and Shadloo MS, Theoretical and Applied Mechanics Letters, 2017, 7, 243–251. [Google Scholar]
- 22.Sontti SG and Atta A, Chemical Engineering Journal, 2017, 330, 245–261. [Google Scholar]
- 23.Afkhami S and Renardy Y, Journal of Engineering Mathematics, 2017, 107, 231–251. [Google Scholar]
- 24.Nguyen N-T, Microfluidics and Nanofluidics, 2012, 12, 1–16. [DOI] [PMC free article] [PubMed] [Google Scholar]
- 25.Shi D, Bi Q and Zhou R, Numerical Heat Transfer, Part A: Applications, 2014, 66, 144–164. [Google Scholar]
- 26.Zhang J, Hassan MR, Rallabandi B and Wang C, Soft Matter, 2019, 15, 2439–2446. [DOI] [PubMed] [Google Scholar]
- 27.Ray A, Varma VB, Jayaneel PJ, Sudharsan NM, Wang ZP and Ramanujan RV, Sensors and Actuators B: Chemical, 2017, 242, 760–768. [Google Scholar]
- 28.Wu Y, Fu T, Ma Y and Li HZ, Soft Matter, 2013, 9, 9792–9798. [Google Scholar]
- 29.Cao Q, Han X and Li L, Lab on a Chip, 2014, 14, 2762–2777. [DOI] [PubMed] [Google Scholar]
- 30.Liu J, Tan S-H, Yap Y, Ng M and Nguyen N-T, Microfluidics and Nanofluidics, 2011, 11, 177–187. [Google Scholar]
- 31.Aboutalebi M, Bijarchi MA, Shafii MB and Kazemzadeh Hannani S, Journal of Magnetism and Magnetic Materials, 2018, 447, 139–149. [Google Scholar]
- 32.Banerjee U and Sen AK, Soft Matter, 2018, 14, 2915–2922. [DOI] [PubMed] [Google Scholar]
- 33.Nguyen N-T, Zhu G, Chua Y-C, Phan V-N and Tan S-H, Langmuir, 2010, 26, 12553–12559. [DOI] [PubMed] [Google Scholar]
- 34.Hirt CW and Nichols BD, Journal of Computational Physics, 1981, 39, 201–225. [Google Scholar]
- 35.Maronnier V, Picasso M and Rappaz J, Journal of Computational Physics, 1999, 155, 439–455. [Google Scholar]
- 36.Furlani EP, in Permanent Magnet and Electromechanical Devices, ed. Furlani EP, Academic Press, San Diego, 2001, DOI: 10.1016/B978-012269951-1/50004-8, pp. 97–205. [DOI] [Google Scholar]
- 37.González Fernández C, Gómez Pastora J, Basauri A, Fallanza M, Bringas E, Chalmers JJ and Ortiz I, Sensors (Basel), 2020, 20, 3030. [DOI] [PMC free article] [PubMed] [Google Scholar]
- 38.Gómez-Pastora J, Amiri Roodan V, Karampelas IH, Alorabi AQ, Tarn MD, Iles A, Bringas E, Paunov VN, Pamme N, Furlani EP and Ortiz I, The Journal of Physical Chemistry C, 2019, 123, 10065–10080. [Google Scholar]
- 39.Gómez-Pastora J, González-Fernández C, Real E, Iles A, Bringas E, Furlani EP and Ortiz I, Lab on a Chip, 2018, 18, 1593–1606. [DOI] [PubMed] [Google Scholar]
- 40.Nguyen N-T, Langmuir, 2013, 29, 13982–13989. [DOI] [PubMed] [Google Scholar]
- 41.Alorabi AQ, Tarn MD, Gómez-Pastora J, Bringas E, Ortiz I, Paunov VN and Pamme N, Lab on a Chip, 2017, 17, 3785–3795. [DOI] [PubMed] [Google Scholar]
- 42.Paul G, Das PK and Manna I, Soft Matter, 2020, 16, 1642–1652. [DOI] [PubMed] [Google Scholar]
Associated Data
This section collects any data citations, data availability statements, or supplementary materials included in this article.


