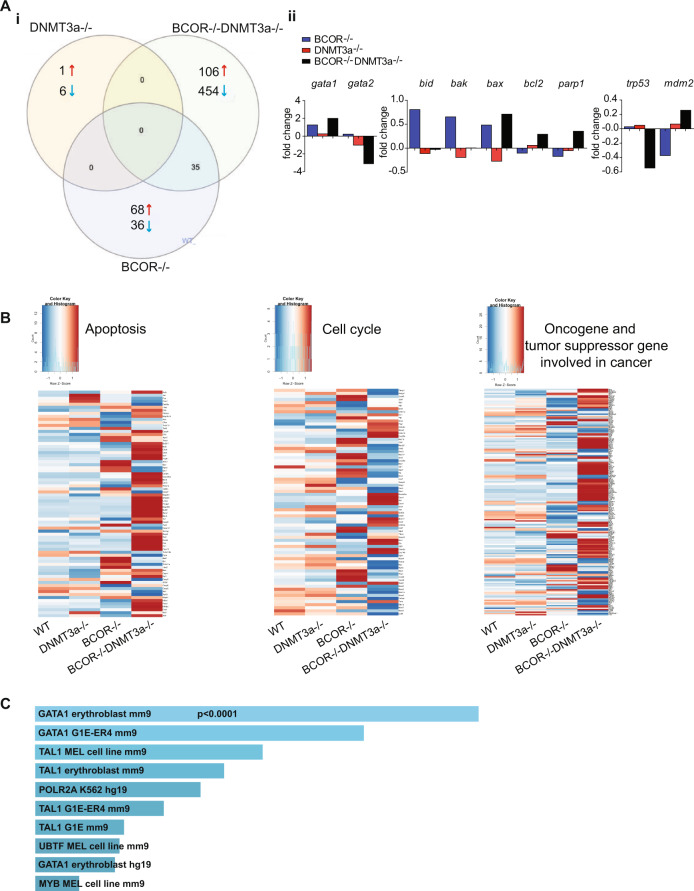
Fig. 6. Deregulated genes in Bcor−/−Dnmt3a−/− leukemia.
A (i) Overlap of differently gene expression (RNAseq) in the LSK cells of Bcor−/−Dnmt3a−/−, Bcor−/−, Dnmt3a−/−compared to WT control (n = 3 mice for each genotype). (ii) mRNA expression in the LSK cells of the indicated genotypes for the most up- and downregulated genes. B Heatmaps of apoptosis pathway (left), cell cycle (middle), cancer (right) in LSK cell for the indicated genotype. C Enrichr bar plot (https://amp.pharm.mssm.edu/Enrichr/). Bars represent the proportion of genes upregulated in both human AEL samples (n = 137) and Bcor−/−Dnmt3a−/− LSK (n = 3) whose promoter is bound by the indicated transcription factor.

