

Abstract
Rationale:
The mechanistic target of rapamycin complex-1 (mTORC1) controls metabolism and protein homeostasis, and is activated following ischemic reperfusion (IR) injury and by ischemic preconditioning (IPC). However, studies vary as to whether this activation is beneficial or detrimental, and its influence on metabolism after IR is little studied. A limitation of prior investigations is their use of broad gain/loss of mTORC1 function, mostly applied prior to ischemic stress. This can be circumvented by regulating one serine (S1365) on tuberous sclerosis complex (TSC2) to achieve bi-directional mTORC1 modulation but only with TCS2-regulated co-stimulation.
Objective:
We tested the hypothesis that reduced TSC2 S1365 phosphorylation protects the myocardium against IR and IPC by amplifying mTORC1 activity to favor glycolytic metabolism.
Methods & Results:
Mice with either S1365A (TSC2SA; phospho-null) or S1365E (TSC2SE; phosphomimetic) knock-in mutations were studied ex vivo and in vivo. In response to IR, hearts from TSC2SA mice had amplified mTORC1 activation and improved heart function compared to WT and TSC2SE hearts. The magnitude of protection matched IPC. IPC requited less S1365 phosphorylation, as TSC2SE hearts gained no benefit and failed to activate mTORC1 with IPC. IR metabolism was altered in TSC2SA, with increased mitochondrial oxygen consumption rate and glycolytic capacity (stressed/maximal extracellular acidification) after myocyte hypoxia-reperfusion. In whole heart, lactate increased and long-chain acyl-carnitine levels declined during ischemia. The relative IR protection in TSC2SA was lost by lowering glucose in the perfusate by 36%. Adding fatty acid (palmitate) compensated for reduced glucose in WT and TSC2SE but not TSC2SA which had the worst post-IR function under these conditions.
Conclusions:
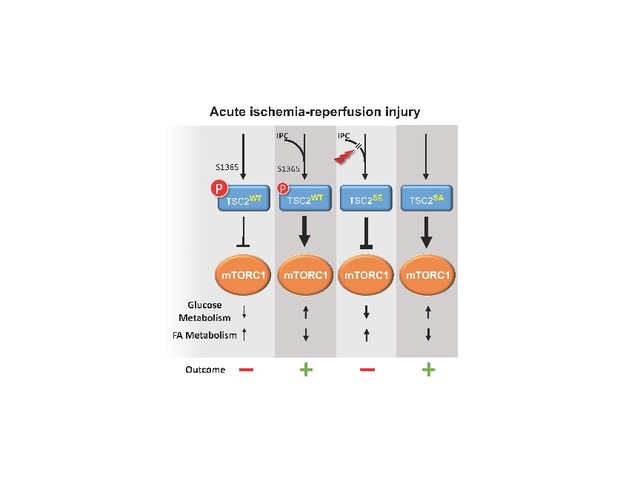
TSC2-S1365 phosphorylation status regulates myocardial substrate utilization, and its decline activates mTORC1 biasing metabolism away from fatty acid oxidation to glycolysis to confer protection against IR. This pathway is also engaged and reduced TSC2 S1365 phosphorylation required for effective IPC.
Keywords: Metabolism, ischemia reperfusion injury, preconditioning, mechanistic target of rapamycin, tuberous sclerosis complex
Subject Terms: Basic Science Research, Cell Signaling/ Signal Transduction, Ischemia, Mechanisms, Metabolism
Graphical Abstract
INTRODUCTION
The mechanistic target of rapamycin complex-1 (mTORC1) controls protein homeostasis and cellular metabolism1, 2. Its activity declines during hypoxic/ischemic stress3, 4 and rises following reperfusion (IR) and with ischemic preconditioning5 (IPC). During no/low flow ischemia (IS), oxygen and nutrient deprivation rapidly deplete ATP, depressing mTORC1 activity by phosphorylation of Raptor and TSC2 by AMP-dependent kinase (AMPK), and modifying REDD1 signaling3, 4, 6. This rapidly suppresses mito-chondrial oxidative phosphorylation by both transcriptional7 and post-translational8 mechanisms. Upon reperfusion, mTORC1 reactivates due to decreased glycogen synthase kinase 3β (GSK3β) phosphorylation of TSC2 to reduce TSC2 inhibition of the complex5. Activation of mTORC1 is also engaged by ischemic preconditioning (IPC) in which exposure to transient IR episodes confers organ protection against sustained ischemia9. The main downstream effectors of mTORC1 are S6 kinase, elF4E binding protein-1 (4EBP1), and Unc-51-like kinase-1 (Ulk-1) that modify gene transcription, translation, and autophagy, respectively. Metabolism is also regulated in part by mTORC1 activation of sterol regulatory element-binding protein 1 (SREBP1) and by other mechanisms that enhance glycolysis and lipogenesis and reduce fatty acid oxidation (FAO)2, 10. This latter impact has been little studied with IR.
Despite its central roles, particularly as a metabolic regulator, the influence of mTORC1 activity on organ function after IR remains controversial as studies report benefits11, 12 or detriments15, 16 from its inhibition, while others find improvement from its enhancement13–15. Similar directionally opposite disparities apply to studies of IPC9, 16, 17. One limitation of these studies is that mTORC1 was manipulated using broad inhibitors such as rapamycin or genetic loss/gain of function models, which altered mTORC1 signaling often prior to IR stress, making the response harder to interpret. A way to circumvent this was revealed by the discovery of two sequential serines in the activation region of TSC2 that provide a rheostat for amplifying or attenuating mTORC1 activity but only upon co-stimulation of the complex6. TSC2 acts as a kinase sensor to transduce multiple signaling inputs and in turn stimulate or suppress mTORC1 activity6. In particular, protein kinase G (PKG1α) activated by nitric oxide and natriuretic peptide signaling phosphorylates S1365/S1366 (mouse, human S1364/S1365) to suppress mTORC1 co-activation6. Site mutagenesis of either serine to glutamic acid (e.g., S1365E, TSC2SE) mimicked phosphorylation and blunts co-stimulated mTORC1, markedly protecting hearts from sustained pressure-overload. Reciprocally, a phospho-null S1365A (TSC2SA) mutation amplified mTORC1 activity and greatly worsened the pathophysiology6, 18. However, neither mutation alters basal mTORC1 activation and consequent signaling.
In this study, we leveraged these genetic models to determine the role of mTORC1 activation via TSC2 on both functional and metabolic responses to cardiac ischemia, IR, and IPC. The studies reveal a potent influence of suppressing S1365 phosphorylation on mTORC1 activation and associated cardioprotection after IR and IPC, biasing substrate utilization away from fatty acids and favoring glycolysis.
METHODS
Data Availability.
The authors declare that all supporting data are available within the article and its Data Supplement. Please see the Major Resources Table in the Data Supplement. TSC2 WT and phospho-mutant expression vectors (plasmids or adenovirus), and corresponding KI mice can be provided upon reasonable request made directly to the corresponding author.
Major Resources Table
| Species | Vendor or Source | Background Strain | Other Information | Persistent ID / URL |
|---|---|---|---|---|
| Mus musculus, TSC2SA, TSC2SE, TSC2WT | own | C57BL/6J | Ranek et al. Nature 2019 | https://www.nature.com/articles/s41586-019-0895-y |
| Clone Name | Sequence | Source / Repository | Persistent ID / URL |
|---|---|---|---|
| Ad - TSC2 WT or TSC2 S1365E or TSC2 S1365A | N-terminally HA-tagged human TSC2 WT, S1365E, S1365A adenovirus, and N-terminally HA-tagged wild-type sequence or human TSC2(S1365A) or TSC2(S1365E) adenovirus | plasmid encoding human HA-tagged TSC2WT or TSC2S1365E or TSC2S1365A (Ranek et al. Nature 2019) | https://www.nature.com/articles/s41586-019-0895-y#Sec2 |
| Name | Vendor or Source | Sex (F, M, or unknown) | Persistent ID / URL |
|---|---|---|---|
| Neonatal rat cardiomyocytes (NRCMs) from Hannover Wistar rats | Janvier Labs, France | both | https://www.janvier-labs.com/en/fiche_produit/wistar_rat/ |
| Description | Source / Repository | Persistent ID / URL |
|---|---|---|
| Ppara (mouse) | Forward 5’-GCGTACGGCAATGGCTTTAT-3’, Reverse 5’-GAACGGCTTCCTCAGGTTCTT-3’ | |
| Pgc1a (mouse) | Forward 5’-CAACATGCTCAAGCCAAACCAACA-3’, Reverse 5’-CGTCAATAGTCTTGTTCTCAAATGGG-3’ | |
| Acot1 (mouse) | Forward 5’-GACAAGAAGAGCTTCATTCCCGTG-3’, Reverse 5’-CATCAGCATAGAACTCGCTCTTCC-3’ | |
| Acot2 (mouse) | Forward 5’-AGTCAACGACGCAAAATGGTG-3’, Reverse 5’-GCTCTTCCAATCCTGTTGGC-3’ | |
| Acc1 (mouse) | Forward 5’-TGTACAAGCAGTGTGGGCTGGCT-3’, Reverse 5’-CCACATGGCCTGGCTTGGAGGG-3’ | |
| Acc2 (mouse) | Forward 5’-CTGCTACGAGGTGTGTTCATC-3’, Reverse 5’-AGCTCTGCATGACATTGCCC-3’ | |
| Gapdh (mouse) | Forward 5’-AGGTCGGTGTGAACGGATTTG-3’, Reverse 5’-TGTAGACCATGTAGTTGAGGTCA-3’ |
Animal models.
Male mice expressing global TSC2 knock-in mutations mmTSC2-S1365A (TSC2SA) or mmTSC2-S1365E (TSC2SE) were generated using CRISPR/Cas9 gene editing (Transgenic Core Laboratory, Johns Hopkins University) in C57BL/6J embryos as reported previously6. We maintained each colony by crossing heterozygous males and females, with WT being littermate controls. Males were studied as these mice exhibit more post IR dysfunction compared to females, facilitating adequate powering of the study to detect further improvement19.
Isolated Heart preparation.
Twelve to 22-week old WT and TSC2SE and TSC2SA homozygous and heterozygous knock-in male mice were heparinized subcutaneously, anesthetized with isoflurane, and sacrificed by cervical dislocation. The heart was rapidly excised, placed in cold perfusion medium, weighed, and rapidly attached to a Langendorff apparatus using retrograde perfusion (37°C) at constant pressure of 80 cm H2O. The perfusion medium consisted of oxygenated Krebs-Henseleit (KH) buffer containing 11 mM glucose. A latex balloon was inserted into the left ventricle through the mitral valve, connected to a pressure transducer, and LV function stabilized for 44 minutes. For IPC protocol, instead of 44 minutes, 20 minutes of stabilization were followed by 3 cycles of 5 minutes of ischemia and 3 minutes reperfusion. LV preload (balloon volume) was adjusted in each heart to obtain a minimal pressure of 10 mmHg and then maintained constant for the experiment. After obtaining baseline data, hearts were subjected to 30 minutes of no-flow global ischemia followed by 2 hours of control flow reperfusion. Systolic function was assessed by peak-minimal LV pressure × heart rate (rate-pressure product) and peak rate of pressure rise dP/dtmax. Relaxation was indexed by the peak rate of pressure decline (dP/dtmin). Data were acquired using a BIOPAC 100 System and analyzed with Acknowledge software (BIOPAC system).
In a separate set of studies, we modified the apparatus slightly using a sealed water-jacketed glass buffer reservoir with a tubing oxygenator (Harvard Apparatus) to prevent foaming of fat-containing perfusate during oxygenation. Palmitate was diluted in warm dH2O in a 4:1 ratio (12mM) and then diluted in warm 20% BSA-KH solution (3mM BSA), then dialyzed overnight (dialysis tube #21–152-9, FisherBrand) against KH buffer under constant stirring. After sterile-filtering (0.2μm filter, Corning) the 12mM palmitate solution was diluted in KH to a final 0.8mM concentration, glucose (4mM) and CaCl2 added. No animals were excluded in the analysis.
In vivo Ischemia (IS) and ischemia-reperfusion (IR) model.
Regional ischemia in vivo was performed in isofluorane anesthetized male mice, subjected to 30 minute ligation of the proximal left anterior descending artery (LAD) followed by 1 or 6 hours of reperfusion20. Sham controls underwent similar surgery without LAD occlusion. Age and weight-matched littermates were randomly divided into the three four groups using male mice. The protocols were approved by the Johns Hopkins Medical Institutions Animal Care and Use Committee. No animals were excluded in the analysis.
Conscious mouse echocardiography.
Intact heart morphology and function were measured in conscious male mice by serial M-mode transthoracic echocardiography in parasternal long axis (VisualSonics Vevo 2100, 18–38 MHz transducer; SanoSite Inc.) as previously described6. Images were obtained and analyzed using VisualSonics image software, by an individual blinded to the animal condition.
Neonatal rat cardiomyocyte studies (NRCMs).
NRCMs were isolated from 4 pregnant females, providing a total of 40 to 52 pups, from which 260–340 mL of myocytes (0.5 million cells/mL) were harvested. Each preparation involved mixing from multiple pups. Cells were cultured at 5,000–8,000 cells/well in 96-well plates for 24 hours in DMEM with 10% FBS and antibiotics prior to study, described21. NRCMs were infected over 4 hours with adenoviral vectors (0.5 MOI) expressing HA-tagged TSC2WT,TSC2S1365A,or TSC2S1365E proteins as previously described6. Dose-titration showing protein expression for each mutant versus native protein, and equal levels of expression are shown in Online Figure I. After an additional 48 hr, NRCMs were exposed to simulated ischemia buffer (DMEM medium with 20mM 2D-Deoxyglucose, 125mM NaCl, 8mM KCl, 1.2 mM KH2PO4, 1.25mM MgSO4, 1.2mM CaCl2, 6.25mM NaHCO3, 5mM sodium lactate, 20mM HEPES, adjusted to pH 6.6) and incubated in a hypoxia chamber (Billups-Rothenberg®) flushing the chamber with hypoxic gas (95% N2, 4% CO2, 1% O2) for 90 sec at 5psi, 10L/min for 45 minutes. Then cells were reoxygenated and fresh medium was added, either DMEM with 10% fetal calve serum for 2 hours for western blot analysis, or fresh medium to perform the mitochondrial respiration assay.
Mitochondrial Respiration Assay.
Mitochondrial respiration was determined by measuring oxygen consumption rates (OCRs) with a Seahorse XF96 Extracellular Flux Analyzer, according to the manufacturer’s protocol. Briefly, primary NRCM cells were plated onto wells of a 1% gelatin coated XF96 plate. Next day, cells were treated with adenovirus (TSC2WT, TSC2SE and TSC2SA) and incubated for 48 hrs. Oxygen consumption rates (OCR) were measured using the mitochondrial stress test protocol in DMEM containing 10 mM glucose, 4 mM L-glutamine, and 2 mM sodium pyruvate with pH 7.4. After calibration of the sensor cartridge, the XF96 plate was placed into the instrument and OCR measured in pMol/minute normalized to number of cells/well. Analysis of mitochondrial function was determined based on changes in OCR in the presence of 1.0 μM oligomycin, 1.0 μM FCCP, and 0.5 μM Rotenone and Antimycin A, with OCR determined x4 at five time points after each injection. Extracellular acidification rate (ECAR) was also measured per manufacturer’s protocol. Baseline ECAR reflects resting conditions with non-limiting substrate and is generally reflective of glycolysis.
Immunoblot analysis.
Myocardial lysates were derived from flash frozen tissue (Cell Signaling Technology #9803) and protein concentration determined by BCA (Pierce). Samples were prepared in SDS Tris-Glycine buffer (Life Technologies) and run on TGX 7.5% or 4–15% Tris-Glycine Gels (Bio-Rad) and blotted onto a nitrocellulose membrane. The following primary antibodies were used in this study: phospho-p70 S6K (T389) #9205 lot 26 used at 1:1,000, p70 S6K #9202 lot 20 used at 1:1,000, phospho-4EBP1 (S65) #9451 lot 14 used at 1:1,000, 4EBP1 #9452 lot 12 used at 1:1,000, phospho-Ulk-1 (S757) #1420 clone D706U lot 4 used at 1:500, Ulk-1 #8054 clone D8H5 lot 5 used at 1:500, TSC2 #3612 clone D93F12 lot 6 used at 1:1,000 (Cell Signaling Technology), phospho-TSC2 (S1365) #120718 lot NFSA12072OAH used at 1:500 (NovoPro Labs), and P62 #ab109012 lot GR12843–70 used at 1:1,000 (Abcam), and a total protein stain #926–11016 lot C80522–02 used at 5 ml/membrane (Li-Cor). Antibody binding was visualized by infrared imaging (Odyssey, Li-Cor) and quantified with Li-Cor Image Studio Software 3.1.
Gene expression by quantitative RT-PCR.
Total RNA isolated from LV myocardium (Trizol Reagent, Invitrogen) was reverse transcribed to cDNA (High Capacity RNA-to-cDNA Kit, Applied Biosystems, Life Technologies), and were analyzed by real-time PCR (BioRad CFX 384 Touch Real-Time PCR Detection System) using Fast SYBR Green MasterMix (ThermoFisher Scientific). The PCR protocol was: Initial Denaturation: 95°C × 3 min; 40 cycles: Denaturation: 95°C ×10 sec, annealing, extension, and read fluorescence: 56°C × 30 sec. Denaturation: 95°C × 10 sec, annealing, extension, and read fluorescence: 56°C × 5 sec, Hold: 95°C/0.5°C for a total time of 1:39. Cq values were determined using the standard manufacturer settings, and values are referenced to Gapdh. The PCR probes were:
| Ppara (Forward 5’-GCGTACGGCAATGGCTTTAT-3’, | Reverse 5’-GAACGGCTTCCTCAGGTTCTT-3’), |
| Pgc1a (Forward 5’-CAACATGCTCAAGCCAAACCAACA-3’, | Reverse 5’-GCGTCAATAGTCTTGTTCTCAAATGGG-3’), |
| Acot1 (Forward 5’-GACAAGAAGAGCTTCATTCCCGTG-3’, | Reverse 5’-CATCAGCATAGAACTCGCTCTTCC-3’), |
| Acot2 (Forward 5’-AGTCAACGACGCAAAATGGTG-3’, | Reverse 5’-GCTCTTCCAATCCTGTTGGC-3’), |
| Acc1 (Forward 5’-TGTACAAGCAGTGTGGGCTGGCT-3’, | Reverse 5’-CCACATGGCCTGGCTTGGAGGG-3’), |
| Acc2 (Forward 5’- CTGCTACGAGGTGTGTTCATC-3’, | Reverse 5’- AGCTCTGCATGACATTGCCC-3’), |
| Gapdh (Forward 5’-AGGTCGGTGTGAACGGATTTG-3’, | Reverse 5’-TGTAGACCATGTAGTTGAGGTCA-3’). |
Metabolite Profiling.
Frozen mouse heart tissue samples were homogenized with TissueLyser II by adding the −20°C-cold HPLC-grade methanol to the final concentration of 100mg/ml. The denatured protein was pelleted by centrifuging the tube at 14,000 rpm for 20min at 4°C and the supernatant of individual sample was transfer into the new tube for metabolite profiling analysis. Before the LC-MS based analysis, 10μl of supernatant was diluted with 90ul of methanol for positive mode analysis, and 30ul of supernatant was diluted with 70ul of Acetonitrile/methanol (3:1) for negative mode analysis respectively.
Profiling of TCA cycle intermediates, sugars and bile acids was performed by LC-MS in negative ion mode. In brief, 10 μl of reconstituted sample was loaded onto either a 150 × 2.1 mm Atlantis HILIC column (Waters, Milford, MA) for positive mode analysis or 5ul was loaded on a 100 × 2.1mm 3.5μm XBridge amide column (Waters) for negative mode analysis using an HTS PAL autosampler (Leap Technologies, Carrboro, NC) or Agilent 1290 Infinity autosampler. The metabolites were separated using an Agilent 1200 Series HPLC system (Agilent Technologies, Santa Clara, CA) coupled to a 4000-QTRAP mass spectrometer (AB SCIEX, Foster City, CA) in positive mode analysis; an Agilent 1290 infinity HPLC binary pump system (Agilent Technologies, Santa Clara, CA) coupled to a 6490-QQQ mass spectrometer (Agilent Technologies, Santa Clara, CA) in negative mode analysis MultiQuant software v2.1 (AB SCIEX, Foster City, CA) and MassHunter quantitative software were used for automated peak integration respectively and metabolite peaks were also assessed manually for quality of peak integration. L-Lactate was also assessed from heart tissue (~20 mg) using a colorimetric assay (ab65331, Abcam) per manufacturer’s instructions.
Statistical Analysis.
Group data are generally presented as violin plots, with median, quartiles, and distribution density, but some plots are presented as mean ± SD. Data analyzed by parametric models (e.g. ANOVA) had at least n>5 for each data group and were determined to be normally distributed in each group using the Shapiro-Wilks test. If either condition failed, non-parametric tests were used. The specific test and associated post-hoc multiple comparisons test for each data set are identified in the corresponding figure legends. The sample size for each group is provided either in the figures themselves or legends, and each symbol depicted denotes a biological replicate. As our specific experimental analysis lacked the precise data to pre-determine sample size accurately, we initially used estimates based on existing data from the same TSC2 genetic models6, 18. These estimates were updated as data were obtained in the new experiments using the relevant variances and effect size to power the study. All statistical analyses were performed using Graphpad Prism software (Ver. 9, 2020), and the selection of primary and post-hoc multiple comparisons testing was based on the data distribution, sample size, and variance between groups, as recommended by this software.
RESULTS
TSC2SA expression stimulates mTORC1 during IR and enhances cardio-protection.
Isolated hearts from TSC2WT, TSC2SA and TSC2SE KI mice were subjected to 30 minutes of global no-flow ischemia followed by 2 hours of reperfusion (IR). Baseline function for each model was the same (Online Table I). TSC2SA hearts had improved post-IR systolic function in comparison versus TSC2WT which was reflected by a higher rate-pressure product and peak rate of pressure rise (dp/dtmax), and improved diastolic function reflected by greater peak rate of pressure decline (dP/dtmin) (Figure 1A, representative pressure traces in Online Figure IIA). The improved function was not statistically different between homozygous TSC2SA where S1365 phosphorylation was prevented and heterozygous where it was reduced (Online Figure IIB), therefore for the primary analysis, both groups were combined. Function after I/R in TSC2SA did not statistically differ from that achieved by ischemic preconditioning (IPC) of TSC2WT hearts. Lastly, TSC2SE heart function post IR was not statistically different from that in TSC2WT. Heart rate was not significantly altered among the groups (Online Figure IIC).
Figure 1: TSC2 S1365 phospho-null (TSC2SA) mice show increased cardiac performance and mTORC1 activation after IR.
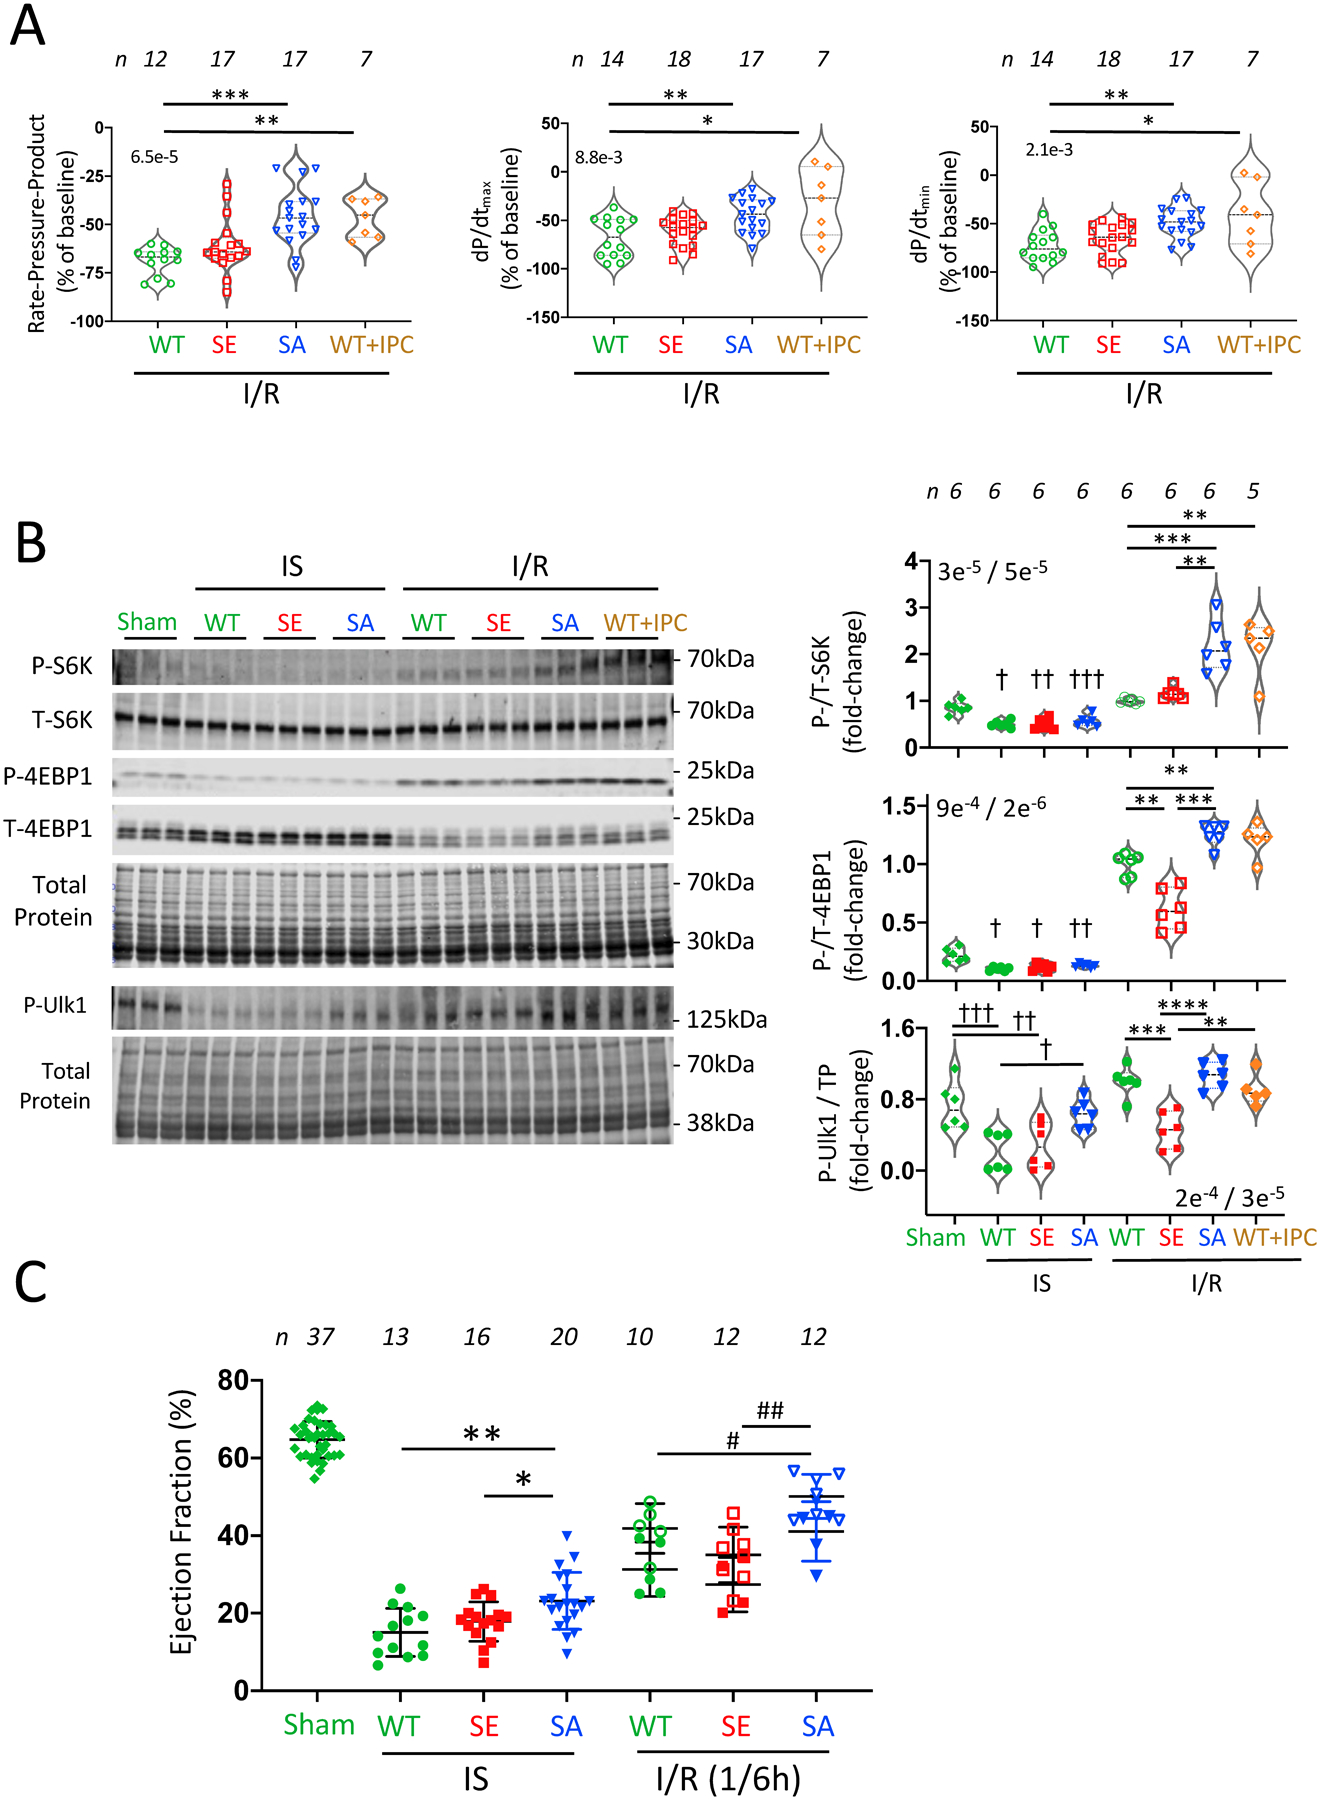
(A) Ex vivo heart function in wild-type (WT), TSC2SE (SE), TSC2SA (SA), and WT with ischemic preconditioning (WT+IPC) following ischemia-reperfusion (IR) injury. Violin data plots with median, upper and lower quartiles display percent reduction relative to pre-ischemic baseline. Both SA and WT+IPC displayed less dysfunction in comparison to WT. SE and WT were not statistically different. Rate-pressure product (RPP) and dp/dtmax (peak rate of pressure rise) reflect contraction, dp/dtmin (peak rate of pressure decline) relaxation. (n/group shown in figure; Kruskal-Wallis (KW) test (overall p-value in upper left), Dunn’s multiple comparisons test (DMCT) p-values: RPP: *** 0.0002, ** p=0.002; dp/dtmax: ** 0.02, * 0.04; dp/dtmin: ** 0.003, * 0.028). (B) Example immunoblot and summary data for mTORC1 activation reflected by phosphorylation of its primary downstream substrates S6K, 4EBP1, and Ulk1. (n/group shown in figure, normality passed for each plot by Shapiro-Wilk test; 1WANOVA with Sidak’s multiple comparisons test (SMCT) separately applied to Sham vs. IS groups and the four post-IR groups. p/t-S6K: † 6e−5, †† 5e−5, ††† 5e−4; ** 3e−4, *** 2e−4; p/t-4EBP1: † p=0.01, †† p=0.03, ** p≤0.006, *** p=0.0002, p/TP-Ulk1 (TP-total protein): † 0.03, †† 0.009, ††† 0.003, ** 0.001, *** 9e−5, **** 2e−5. (C) Ejection fraction measured in vivo in hearts subjected to transient anterior wall regional I/R injury. Initial control data are obtained in nearly all the mice, and then each subsequent data point reflects a single independent experiment. Results at end of 30-minute coronary occlusion (ischemia, IS) or after 1 or 6 hours of I/R are displayed for each group. (n/group shown in figure, data are mean ± SD. For IS data: 1-way ANOVA, 3-way Tukey’s multiple comparisons test (TMCT); ** p=0.002, * p=0.04; For IR data (1h solid symbols, 6h open symbols; 2-way ANOVA with time (p=0.002) and genotype (p=0.0001) groups: 3-way SMCT - * 0.033, IR(6h): ** 0.0009.
At baseline, we have previously shown mTORC1 activity reflected by the phosphorylation of its three primary downstream protein effecters - S6K, 4EBP1, and Ulk1 is low and no different between the three TSC2 models6. During IS, we found a modest significant and similar magnitude reduction in their phosphorylation, the only exception being pUlk1 in TSC2SA hearts that did not differ significantly from Sham control (Figure 1B). Following IR, phospho-S6K more than doubled in TSC2SA as compared to TSC2WT or TSC2SE hearts, matching levels in WT hearts subjected to IPC. Phosphorylation of 4EBP1 also rose more in TSC2SA than in the other models. 4EBP1 and Ulk1 phosphory-lation was less in TSC2SE than all other groups. Thus, genetically preventing TSC2 pS1365 amplifies mTORC1 activity after IR, improving heart function at levels matching WT+IPC.
TSC2SA protects the heart during IS and IR in vivo.
We next determined if TSC2SA and TSC2SE modifications had a similar impact on in vivo hearts subjected to 45 minutes of coronary artery occlusion followed by 6 hours of reperfusion. Even during coronary occlusion, TSC2SA KI mice had better function as reflected by a higher ejection fraction compared to TSC2WT and TSC2SE; this disparity increased further after 1 or 6 hours of reperfusion (Figure 1C, representative M-mode images in Online Figure IIIA). Data for heterozygous and homozygous KI mice were again not statistically different, so they are combined. Border-zone myocardial mTORC1 activity data varied considerably most likely due to the narrow physical region and heterogeneity, so instead we assessed this activity using global myocardial lysates that mostly reflected non-infarcted tissue. This activity rose during IS in each model (Online Figure IIIB) consistent with remote tissue being under greater hemodynamic and neurohormonal stress. After IR, S6K phosphorylation declined most notably in TSC2SE hearts. For 4EPB1, phosphorylation rose after IR in both TSC2WT and TSC2SA but not TSC2SE hearts. These results confirm that in vivo protection against IR is afforded by suppressing TSC2-S1365 phosphorylation, highlighting its role in amplifying mTORC1 signaling.
Reduced Phosphorylation of TSC2 S1365 is required for IPC.
Following IR, cardio-protection and mTORC1 activation did not statistically differ between TSC2SA (non-IPC) and WT-IPC-treated hearts, suggesting shared mechanisms. To test this, we measured phosphorylation of S1365 in WT hearts under sham, IS, IR, or IR+IPC conditions (Figure 2a). S1365 phosphorylation declined during IS, and while it then increased after IR, it was still relatively reduced with IPC+IR. Thus, p1365 levels varied inversely with function after IR (c.f. Figure 1A). To test if reduced S1365 phosphorylation is required for IPC, we subjected WT or TSC2SE hearts to IPC followed by IR, with WT+IR serving as a control. IPC improved post-IR LV function in WT but not TSC2SE hearts (Figure 2B). This disparity was associated with reduced mTORC1 activation in TSC2SE+IPC hearts as compared to WT+IPC hearts (Figure 2C, D). The shaded areas in Figure 2D show 90% confidence bands for IR data in WT (dark) or SE (light) hearts without IPC (determined from data shown in Figure 1B), and reveal the primary differential change with IPC was specific to S6K phosphorylation. Together these data show that mTORC1 activation with IPC requires a decline in TSC2 S1365 phosphorylation with associated activation of S6K.
Figure 2: TSC2 S1365 hypophosphorylation is essential for ischemic preconditioning (IPC).
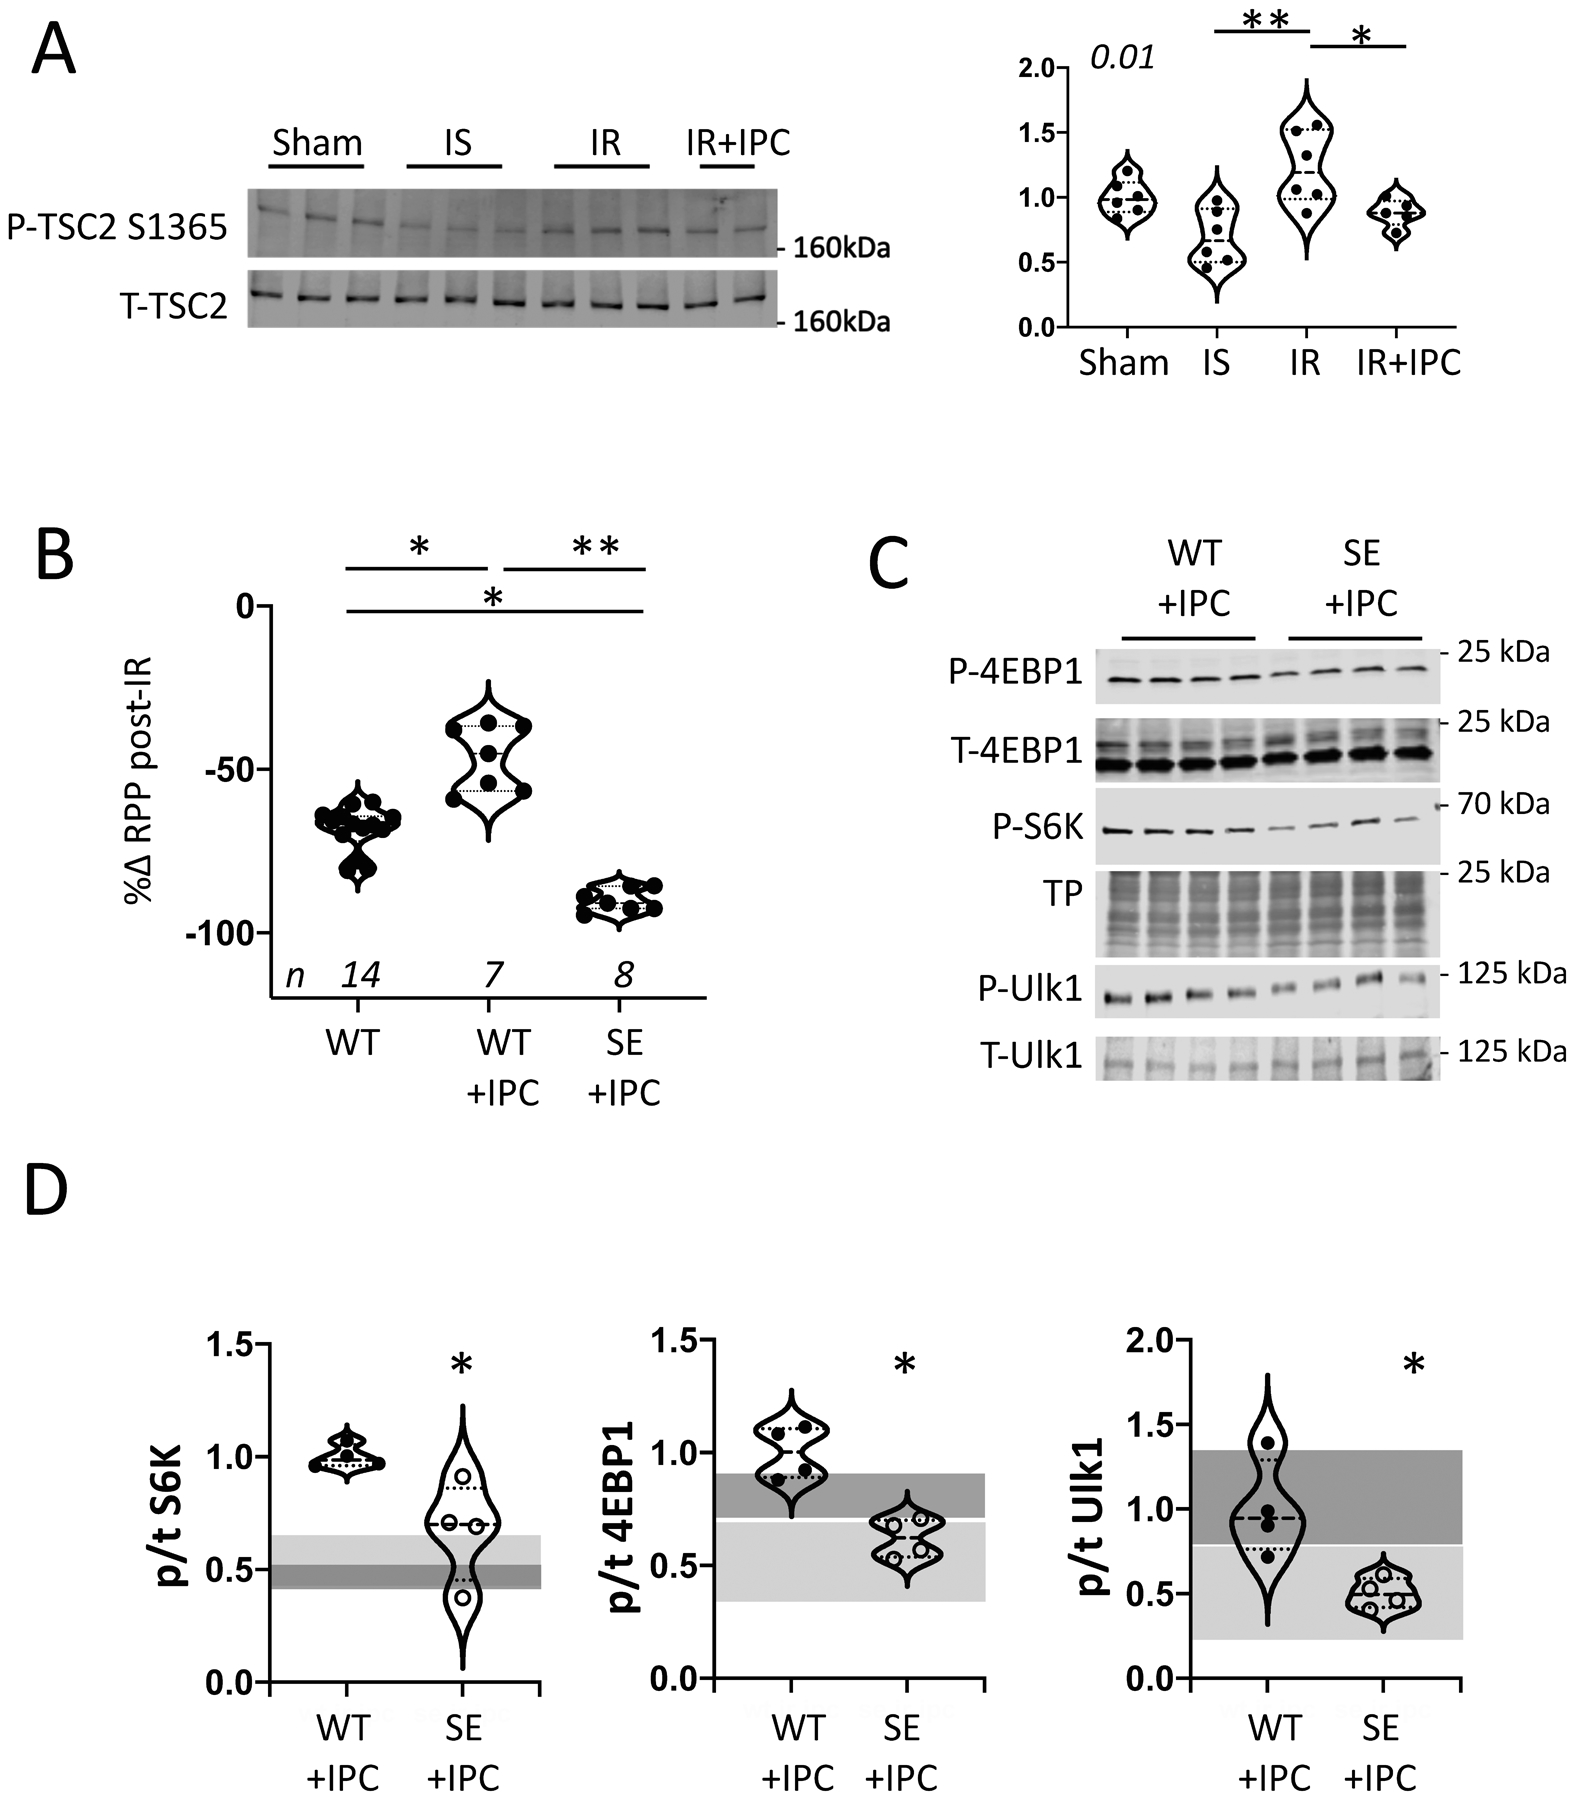
(A) Immunoblot and summary data for total and pS1365 TSC2 for sham, IS, IR, (n=6/group) and IR+IPC (n=5). KW test (p=0.01), DMTC (2-comparison test): * p=0.07; ** 0.003. (B) Percent change in isolated heart rate-pressure product (RPP) after IR in TSC2WT +/− IPC, and TSC2SE + IPC. (n/group in figure; one outlier excluded in SE+IPC by ROUT outlier test (Q=1%). KW (p=1e−5, DMCT (3-way comparison): *p=0.017, ** 5e−6. (C) Example immunoblots and (D) summary data for mTORC1 activation substrates 4EBP1, S6K, and Ulk1 from TSC2WT and TSC2SE ex vivo hearts pre-treated with IPC and then subjected to IR. Summary results for n=4/group, WT vs SE compared by Mann-Whitney test * p=0.028). The dark and light gray shaded areas show 90% confidence bands for comparison results for WT+IR and SE+IR respectively - without IPC, as derived from data provided in Figure 1B. Each data symbol within groups represents a biological replicate.
TSC2SA increases oxygen consumption, acidification, and depresses fatty acid utilization.
Given the short time course of IR-mediated changes, we explored the potential impact of TSC2SA or TSC2SE on myocyte and cardiac metabolism. First, we performed a mitochondrial respiration assay on isolated myocytes infected with the different TSC2 mutants under resting conditions and found no differences in OCR or ECAR. (Figure 3A). However, upon exposure to hypoxia/reoxygenation, cells expressing TSC2SA had higher maximal OCR versus TSC2WT whereas mean ATP generation rates were not statistically different (Figure 3B). Myocardial lactate was also greater in IR TSC2SA myocardium in vivo than in the other two groups (Online Figure IVA). During IS, FAO normally declines rapidly, whereas proximal FA metabolism is less depressed so that long-chain acyl-carnitine levels can rise and contribute to lipotoxicity22, 23. Activated mTORC1 promotes lipogenesis and reduces free FA synthesis and β-oxidation1, and as this was likely more favored by TSC2SA, we hypothesized these hearts may have reduced long-chain acylcarnitines compared to TSC2SE hearts. This was tested by metabolomics assay and we found such reductions (Figure 3D).
Figure 3: TSC2SA expression augments aerobic glycolysis.
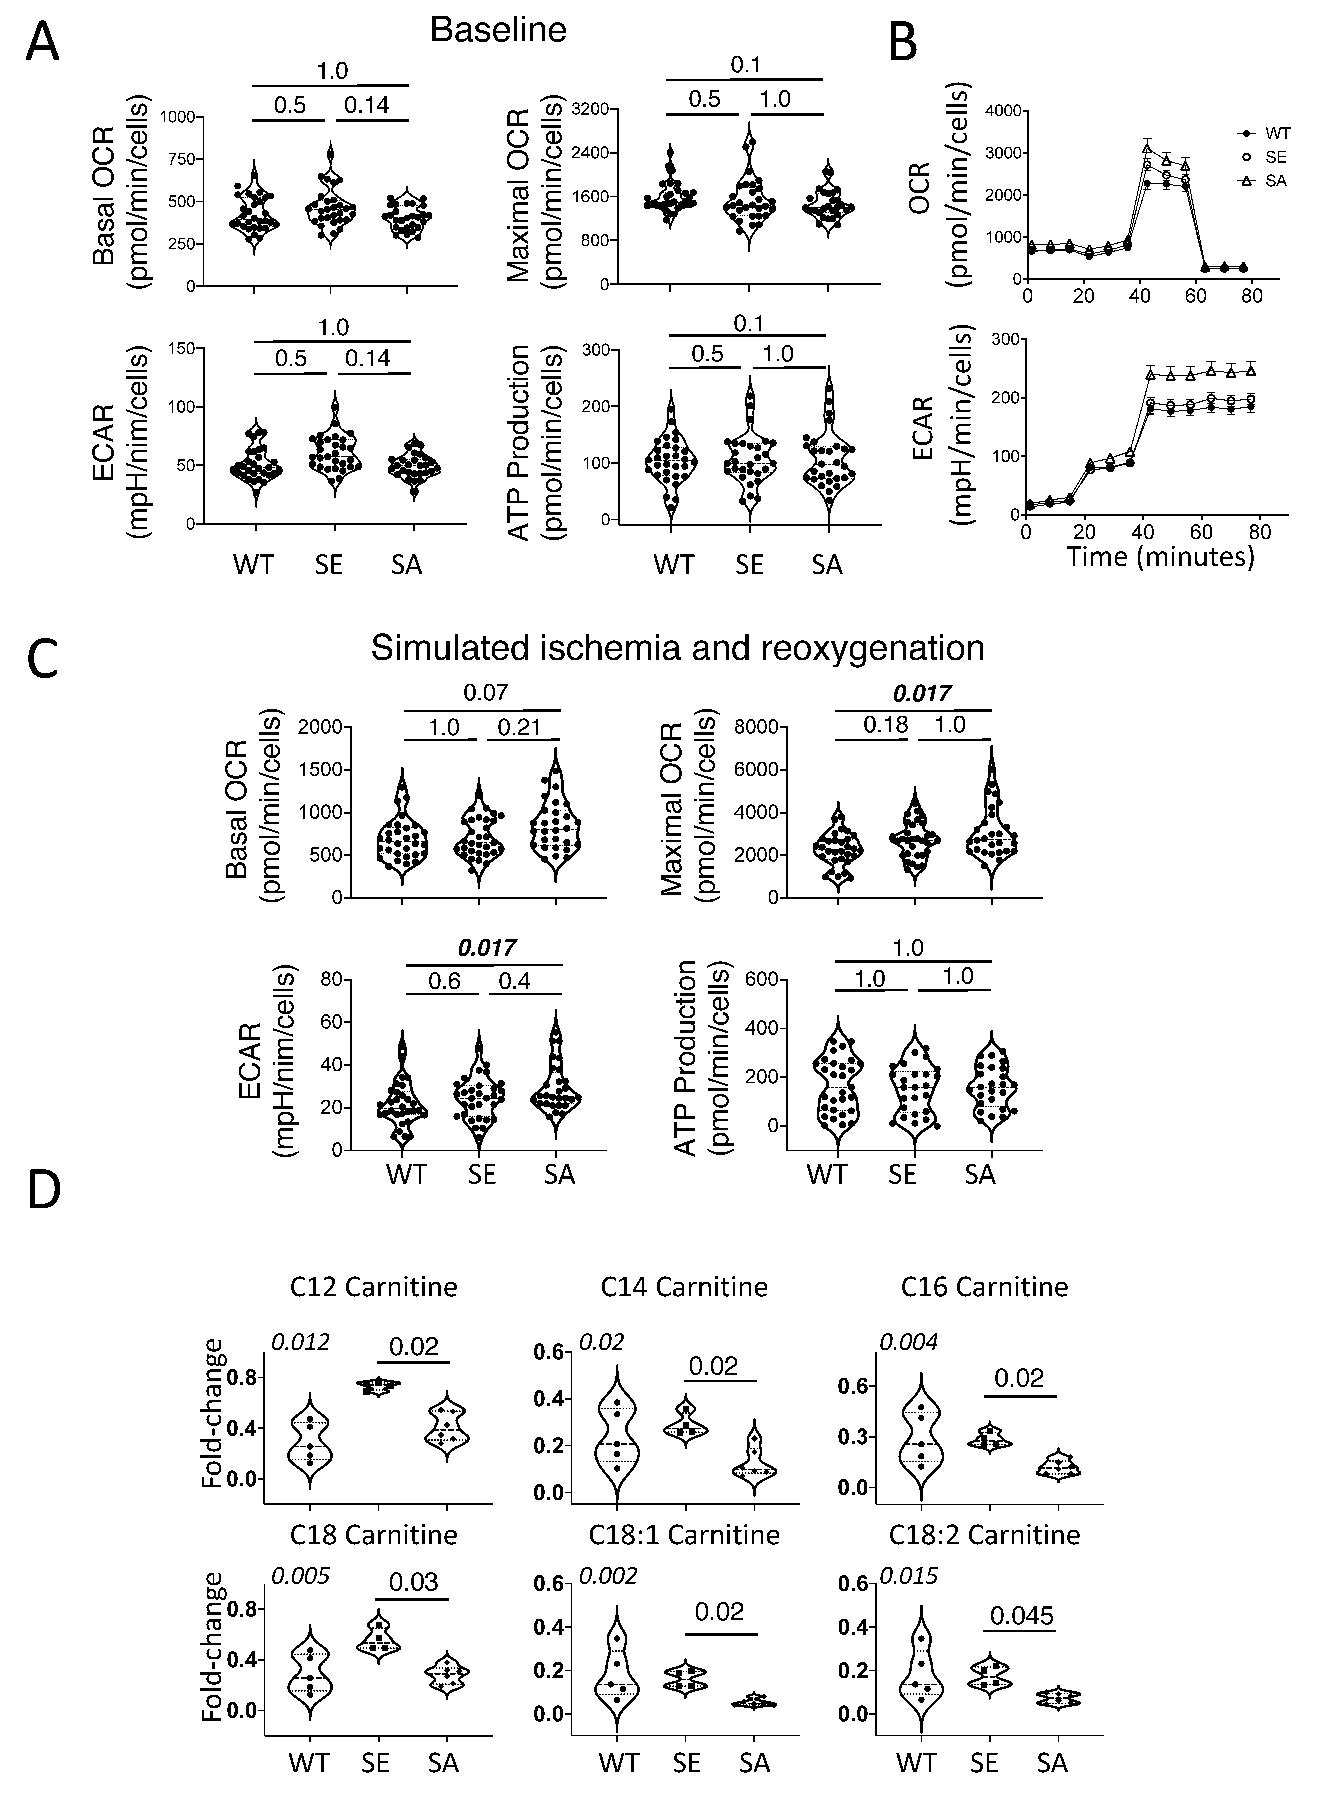
(A) Baseline mitochondrial respiration in isolated neonatal rat ventricular myocytes (NRVMs) infected with adenovirus expressing either TSC2 WT, SA, or SE (n=30, 29, 27, respectively, KW test, DMCT: p=values in panels). (B) Mean time-tracings for stress-test protocol (see methods) comparing each group. (C) Mitochondrial respiration after ischemia/reoxygenation (n=30, 31, 28/group,respectively), KW test, DMCT, p-values in panels. (D) Myocardial long-chain acyl-carnitines from isolated hearts during ischemia (n = 5, 4, 6 for WT, SE, SA, respectively , KW test (p-values in upper left of each panel), DMCT (WT or SA vs SE: p values shown). Biological replicates indicated in figure. ATP: adenosine triphosphate, OCR: oxygen consumption rate, ECAR: extracellular acidification rate. Each data dot symbol within groups reflects a biological replicate.
Cardiac protection against IR in TSC2SA hearts requires glucose as the substrate.
The preceding analysis supports a model whereby TSC2SA favors glucose metabolism under the control of TSC2 S1365-mTORC1 signaling, limiting toxicity during IS, and improving function after reperfusion. If so, then reducing the glucose concentration in the perfusate would compromise cardioprotection afforded by TSC2SA. We tested this with a 36% reduction (to 7mM glucose), and found both WT and TSC2SA hearts exhibited marked cardiac depression after IR, with the TSC2SA performing even slightly worse (Online Figure IVB). We further speculated that supplementing FA to compensate for reduced glucose during IR would selectively limit the benefits afforded by the TSC2SA mutation with adequate glucose available. To test this, ex vivo hearts were perfused with 4 mM (low-glucose, LG) and palmitic acid (0.8 mM, PA). As observed with reduced (7 mM) glucose, TSC2WT hearts perfused with LG alone had a marked decline in LV function after IR as compared to perfusion at higher glucose (e.g., TSC2WT in Figure 1A, p<0.01 for all indexes). However, with LG+PA, post-MI function did not statistically differ from that with higher glucose alone (p>0.2 for all indexes, Figure 4A). TSC2SE hearts also utilized LG+PA to achieve similar post IR function as they did with higher glucose alone (p>0.18 for all indexes). In stark contrast, TSC2SA hearts that performed best after IR when perfused with 11 mM glucose (Fig. 1A) had worse function than the other groups when perfused with LG+PA (p≤6e−6 compared to other groups, Figure 4A). Thus, the TSC2SA hearts did not utilize the fatty acids, and post IR function was statistically indistinguishable from WT with LG alone. Consistent with lacking (TSC2WT with LG) or not effectively using (TSC2SA with LG+PA) their fuel supply, both displayed minimal mTORC1 activation post-IR, whereas the two groups that could utilize LG+PA (TSC2WT and TSC2SE) had greater activation (Figure 4B, Online Figure V).
Figure 4: TSC2SA expressing hearts develop worse LV function after IR when perfused with low glucose + palmitate.
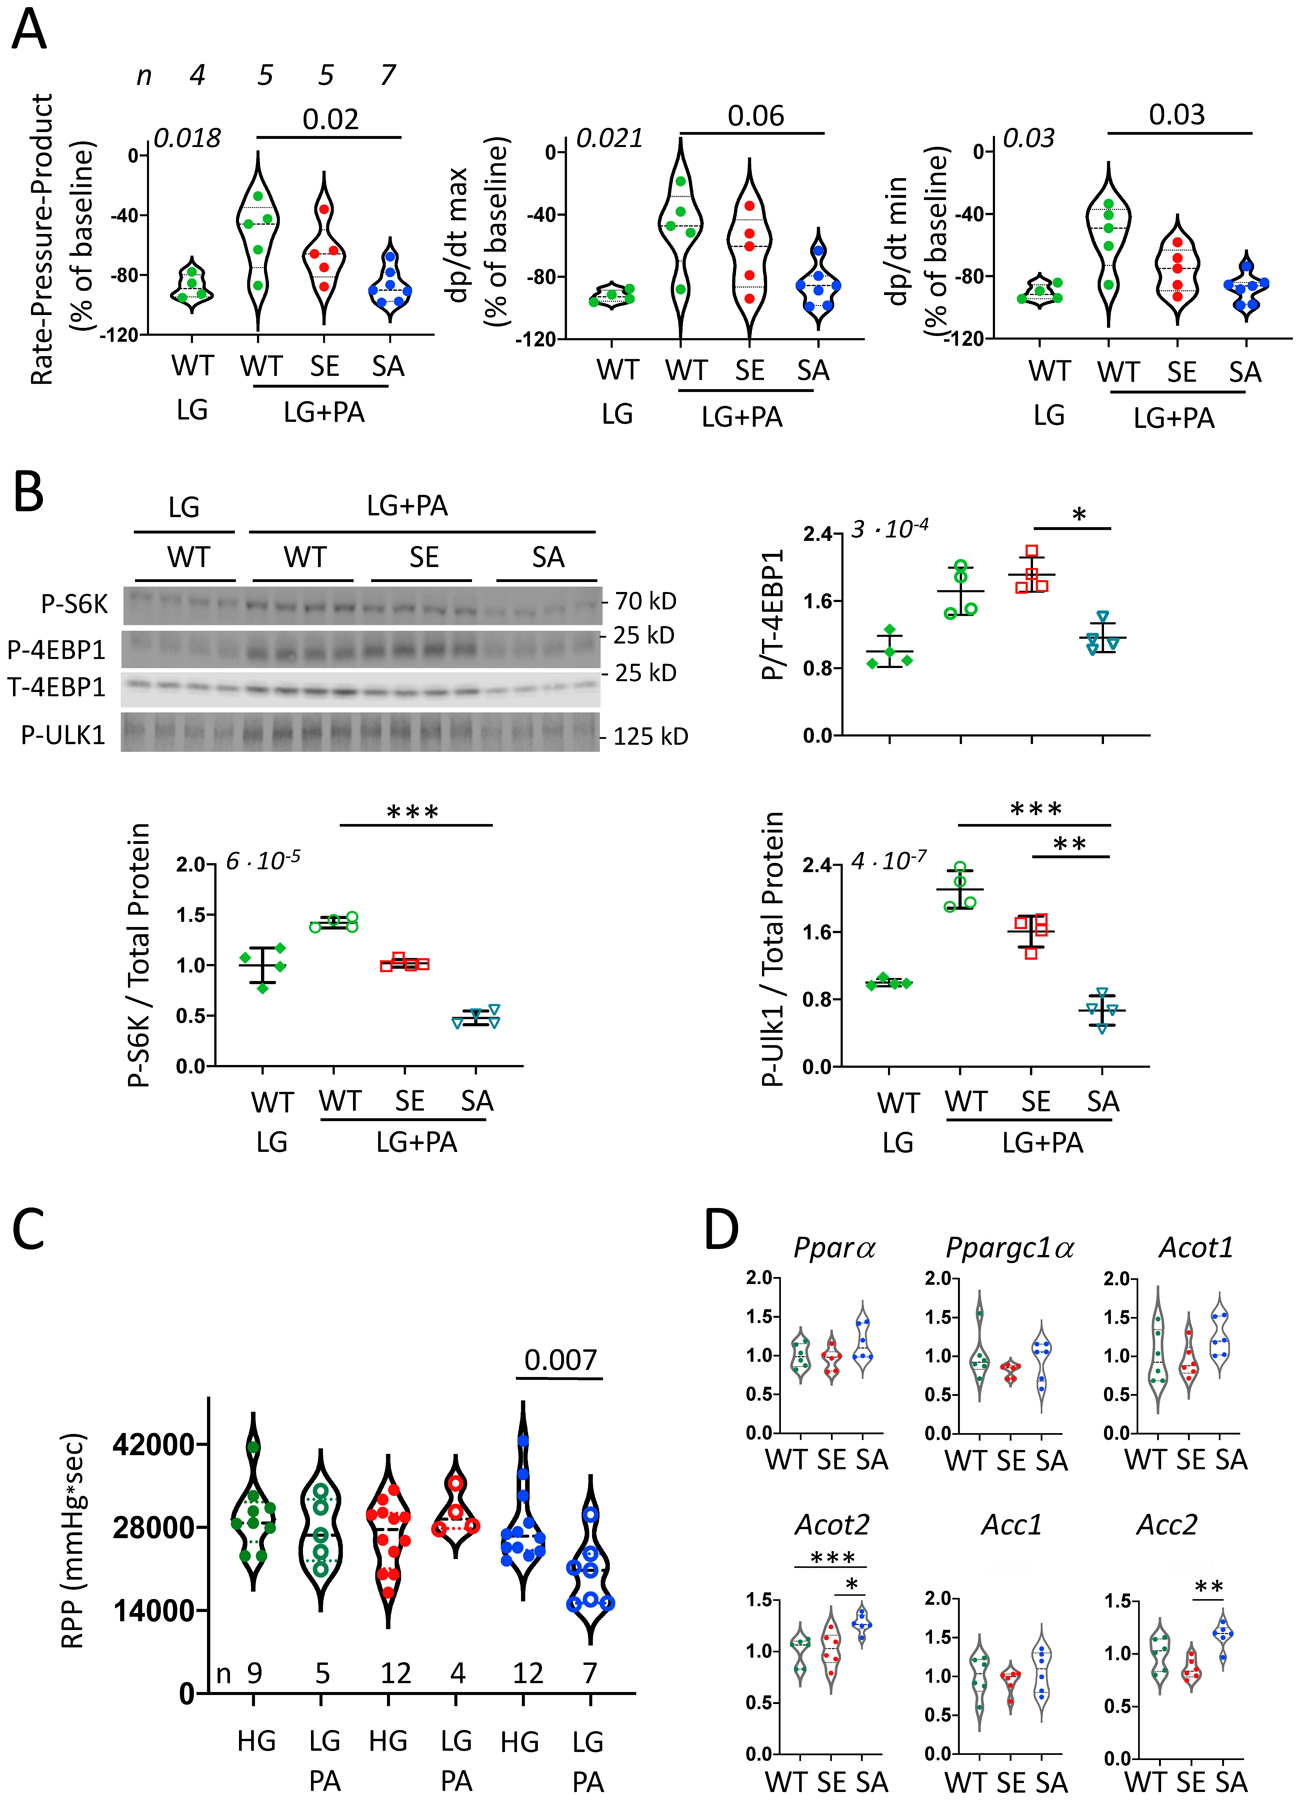
(A) LV function in TSC2WT isolated hearts subjected to IR and perfused with low glucose (LG, 4mM) and TSC2WT, TSC2SA, and TSC2SE hearts perfused with LG+0.8 mM palmitate (PA). (n/group provided above left panel, KW, p-values in upper left of each panel and DMCT comparison to SA-LG+PA displayed. (B) Immunoblots for phosphorylated S6K, 4E-BP1, and Ulk1 from same experiment. Corresponding total protein gels for S6K and Ulk-1 are provided in Online Fig 5. (n=4/group, KW test p-value in upper left for each panel; DMCT: * p=0.052, ** p=0.035, *** p=0.0007, TP – total protein. (C) LV rate pressure product in isolated hearts at baseline perfused with LG+PA (Mann Whitney test within group). (D) Gene expression of PPARα, PGC1α and associated FAO-related genes from WT, SE, and SA myocardium at baseline. (n=6/group, KW with 3-group comparison by DMCT: *** p=0.009, * 0.02, ** 0.005). Each data symbol within each group reflects a biological replicate.
Lastly, we tested if chronic suppression of TSC2 S1365 phosphorylation generated by TSC2SA intrinsically alters myocardial substrate preference away from FA. Isolated hearts without IS, IR, or IPC, were perfused with LG+PA for 44 minutes. Even with this short-term substrate change, we observed a 33% mean decline in function of TSC2SA hearts, whereas the same switch had a negligible impact in TSC2WT or TSC2SE (Figure 4C). One possibility is that TSC2SA expression impacts the expression and regulation of FAO pathways coupled to peroxisome proliferator-activated receptor alpha (PPARα/PGC1α), known major regulators of fat metabolism. However, qPCR revealed no differences in their gene expression between the groups (Figure 4D). Expression of downstream FAO regulators acyl-CoA thioesterase (Acot1) or acyl-CoA carboxylase 1 (Acc1) were not statistically different, though Acot2 and Acc2 expression was higher in TSC2SA hearts. ACOT2 also hydrolyzes acyl-CA to free fatty acids and CoA and can reduce lipotoxicity, while ACC2 enhances generation of malonyl CoA to inhibit FA uptake by the carnitine palmitoyl-transferase complex. Thus, while broad inhibition of PPARα signaling was not detected in TSC2SA hearts, some changes consistent with reduced FA utilization were present.
DISCUSSION
This study reveals that downregulating TSC2 phosphorylation at S1365 is required for effective myocardial ischemic preconditioning, confers cardiac protection after IR, and does so with a shift away from fatty acid and to glucose utilization. To our knowledge, this is the first study to selectively alter a TSC2 phospho-site and detect an impact on mTORC1 regulated metabolism and IR and IPC biology in an intact organ. The present findings support prior work showing benefits from mTORC1 activation with IR9, 13, 24, 25 rather than its inhibition. Here, however, the salutary effects were achieved without impacting broad mTORC1 signaling or instilling changes prior to the relevant stress. This is important as TSC2 modulation by AMPK plays an important role to IR signaling4, 26 and is suppressed by rapamycin, but is not impacted by blocking TSC2 S1365 phosphorylation despite proximity of the targeted serine residues6.
Reducing S1365 phosphorylation limited the cardiac utilization of fat over glucose, the opposite of the normal heart’s fuel preference. This was most revealed by the depressed post-IR LV function in TSC2SA hearts fed LG+PA and even their modest decline in function with this perfusate prior to IS. By contrast, this fuel switch had no impact on the other genotypes. While this was not due to broad suppression of PPARα-signaling in TSC2SA hearts, the response is compatible with mTORC1-S6K-mediated activation of SREBP1 and HIF1α, both known to enhance lipogenesis and aerobic glycolysis while reducing FAO2, 27. The heart normally derives 60–70% of its ATP from FAO, but during no-flow ischemia, this is greatly reduced as does oxidative phosphorylation, and metabolism shifts to glycolysis with glycogenolysis, and activation of HIF1α and AMPK, and 6-phosphofructokinase-1. Both glucose and FA oxidation restart upon reperfusion, and the heart still favors FA oxidation even as it exacerbates post-IR damage (reviewed in23). Treatments increasing aerobic glycolysis with reperfusion are beneficial28, 29 likely by reducing oxygen requirements over FAO yielding less proton and ROS accumulation. The latter contributes to Na+ and Ca2+ overload and associated contractile and mitochondrial damage and cell necrosis. Inhibiting FAO is also beneficial against IR injury23, 30, in part by increased glucose oxidation via a feedback loop linking reduced acetyl-CoA to pyruvate dehydrogenase activation (reverse Randal effect)23. Amplified mTORC1 activity also biases to glucose oxidation to favor many of the same changes. This feature is common in tumors and activated T-cells, where mTORC1 activation stimulates aerobic glycolysis to support rapid growth and survival, often in nutrient challenging environments31. In this regard, it is intriguing that even during coronary occlusion in vivo, heart function was better in TSC2SA hearts, perhaps reflecting the improved performance of the peri-infarct territory. Of note, our studies employed a moderate infarction model where approximately 30% infarction typically occurs32. More severe or persistent ischemia could lead to different results.
The second major finding is that reducing TSC2-S1365 phosphorylation is required for IPC, revealed by resistance to IPC in TSC2SE hearts. In TSC2WT hearts, IPC reduced S1365 phosphorylation, and this and its associated rise in mTORC1 activity and cardio-protection was absent in TSC2SE hearts. To our knowledge, this is the first linkage of a TSC2-phosphosite to IPC biology. The direction of regulation (less S1365 phosphorylation) is somewhat surprising in light of data showing PKG1α as the primary kinase of this site in the heart, and that stimulating PKG1α is generally cardio-protective against IR and confers preconditioning33–36. Proposed mechanisms include PKG-mediated opening of the mitochondrial ATP-sensitive potassium channel, improved mitochondrial function and less post-IR oxidant stress and associated myocyte apoptosis37. We did not measure PKG1α activity in the present study given that blocking PKG1α (or any other kinase) from phosphorylating TSC2-S1365 was protective, we can conclude this modification is not underlying cardiac and myocyte IR protection previously documented with various PKG-stimulation strategies. Prior studies have reported that TSC2-S1365 can also be phosphorylated by protein kinase C38, though PKC stimulates mTORC1 so this is not its singular effector. Other kinases may modify this serine as well. However it is unlikely kinase inhibition as a means of reducing S1365 phosphorylation would be sufficiently selective to provide a therapeutic strategy. However, our findings may have applications to cell therapies where genetic modification of TSC2 are more feasible and might confer enhanced survival or reproduction despite hypoxic or ischemic environments.
The protective impact of the TSC2SA with IR in vivo is opposite the detriment observed when these mice are subjected to chronic pressure-overload6, 18. While both prior and the present study show TSC2SA amplifies and TSC2SE attenuates mTORC1 stimulation, the net biological impact depends on the precise role of mTORC1 to the physiology/pathophysiology. The outcome also likely varies with signaling amplitude and duration. The current IR model was imposed over a few hours, whereas pressure-overload spanned several weeks. In this sense, suppressing chronic mTORC1 signaling using the PKG1α-mimetic TSC2SE maybe beneficial in chronic infarction or ischemic heart failure, where pathological growth, defective autophagy, and dysfunction all contribute to the underlying disease, much as with pressure-overload.
The impact of TSC2 S1365 mutations on SREBP1, HIF1α or REDD1 signaling could not be ascertained in this study, as we found all of these signals very difficult to detect in myocardial tissue. Isolated myocytes also did not provide a suitable alternative, as their lack of physiological load and lower oxygen/nutrient demand limited the mTORC1 response to hypoxia-reoxygenation stress, displaying little activation. We also did not ascertain infarct size but instead used functional measures to assess IR injury. This was done to preserve as much of the myocardium as possible for the various molecular/metabolism assays. While a limitation of the analysis, improved function without a reduced infarct size in IR models is extremely rare. Lastly, we did not employ mTOR inhibitors to test if the prevented the beneficial impact from the SA mutation, but rather used the comparison to the SE mutation to test the role of mTORC1 activation. As noted earlier, the problem posed by inhibitors is the difficulty of applying them in a temporarily pricise manner whereas the TSC2 mutations provide this intrinsically by design.
In summary, we reveal that S1365 on TSC2 provides a post-translational control switch regulating glucose-FA metabolic preference. Moreover, suppressing its phosphorylation shifts the heart towards aerobic glycolysis and improves its post IR recovery. This same suppression normally occurs with IPC and is required for the consequent cardio-protection. From a translational perspective, a TSC2 S1365-mTORC1 genetic switch to favor glucose utilization may find application in T-cells39 for adoptive cell therapy, where enhanced survival and function in a metabolically challenging environment is often required.
Supplementary Material
NOVELTY AND SIGNIFICANCE.
What Is Known?
The mechanistic (mammalian) target of rapamycin complex 1 (mTORC1) regulates ischemia/reperfusion (IR) injury and ischemic preconditioning (IPC); however whether its activation or inhibition is needed for cardioprotection remains controversial as existing data supports both possibilities.
Beyond controlling protein homeostasis, mTORC1 modulates metabolism and its activation enhances glycolysis versus fatty acid oxidation that might help a post-ischemic heart.
Tuberin (TSC2) phosphorylation at Ser1365 (mouse) modulates mTORC1 stimulation, with an S→A mutation amplifying and S→E mutation attenuating activity without altering basal levels.
What New Information Does This Article Contribute?
Expression of TSC2 S1365A protects isolated hearts against IR injury at levels similar to IPC in hearts with wild-type TSC2; both exhibiting enhanced mTORC1 activation of WT control.
Reduced S1365 phosphorylation is required for IPC protection, as TSC2 S1365E hearts maintain reduced mTORC1 activity following I/R+IPC and have no functional improvement.
TSC2 S1365A hearts have reduced fat catabolism during ischemia, and fail to compensate for reduced glucose by adding fatty acid, revealing its role in mTORC1 shifting of metabolic substrate preference towards glycolysis.
Critically reduced blood flow to the heart, called ischemia, can cause severe heart damage and affects ~1.5 million adults in the U.S. annually. Restoring flow is the major therapy, but one may also improve how the heart adapts during and after the period of reduced fuel supply. A key part of this adaptation involves shifting the fuel used by the heart from preferred fats to sugars. This protects the heart when oxygen/fuel delivery declines and then it later recovers. A protein cluster known as the mechanistic target of rapamycin complex-1 (mTORC1) is involved with this adaptation, though just how has remained unclear. Here, we show a brake on mTORC1 activity is controlled by a single amino acid (sub-unit) of the protein tuberin (TSC2), and its release augments mTORC1 activity to shift the heart’s fuel use from fat to sugars and protect it from damage after ischemia. We also find this mechanism is required for a process well known as preconditioning, where hearts and other organs are protected against severe damage by being briefly exposed to short periods of low blood flow before a longer episode. The results link metabolic shifts to TSC2 and reveal a new pathway for improving function of the heart after a heart attack.
ACKNOWLEDGEMENTS
We thank Daniel Kelly, Gary Lopaschuk, and Miguel Aon for their advice, and Guangzhou Zhu, Djahida Bedja, Masayuki Sasaki, Fan Wu, and Xu Shi for technical support.
SOURCES OF FUNDING
Supported by Deutsche Forschungsgemeinschaft (German Research Foundation) OE 688/1–1 (CUO), BIH-Charité clinical scientist program funded by the Charité – Universitätsmedizin Berlin and the Berlin Institute of Health (CUO), NIH/NHLBI: HL-135827, HL-107153, and AHA: 16SFRN28620000 (DAK), F31-HL143905 (BLDE), R01-HL136918 and R01-HL063030 (NP); AHA PD fellowship and CDA 18CDA34110140 (MJR).
Nonstandard Abbreviations and Acronyms:
- 4EBP1
elF4E binding protein-1
- ACC1
acyl-CoA carboxylase
- ACOT1
acyl-CoA thioesterase
- AMPK
5’ adenosine monophosphate-activated protein kinase
- ATP
adenosine triphosphate
- DMCT
Dunn’s multiple comparisons test
- DMEM
Dulbecco minimal essential medium
- FA
fatty acid
- FAO
fatty acid oxidation
- FCCP
carbonyl cyanide-4-(trifluoromethoxy)phenylhydrazone
- GSK3β
glycogen synthase kinase 3β
- HIF1α
hypoxia-inducible factor 1-alpha
- IPC
ischemic preconditionin
- IS
ischemia
- IR
ischemia-reperfusion
- KW
Kruskal Wallis
- LAD
left anterior descending artery
- LG
low-glucose
- MI
myocardial infarction
- mTORC1
mammalian target of rapamycin complex-1
- NRCM
neonatal rat cardiomyocyte
- OCR
oxygen consumption rate
- P-4EBP1
phosphorylated elF4E binding protein-1 at Serine 65
- P-S6K
phosphorylated S6 kinase at Threonin 389
- P-Ulk1
phosphorylated Unc-51-like kinase-1 at Serine 757
- PA
palmitic acid
- PKG1α
protein kinase G 1 alpha
- PPARα
peroxisome proliferator-activated receptor alpha
- S1365
Serine at position 1365 on TSC2
- S6K
(P70) S6 kinase
- SA
serine 1365 mutation to alanine
- SE
serine 1365 mutation to glutamate
- SREBP1
sterol regulatory element-binding protein 1
- TMCT
Tukey multiple comparisons test
- TSC2
tuberin, tuberous sclerousis complex 2
- Ulk1
Unc-51-like kinase-1
- WT
wild type
Footnotes
Publisher's Disclaimer: This article is published in its accepted form. It has not been copyedited and has not appeared in an issue of the journal. Preparation for inclusion in an issue of Circulation Research involves copyediting, typesetting, proofreading, and author review, which may lead to differences between this accepted version of the manuscript and the final, published version.
DISCLOSURES
David A. Kass, Mark Ranek, and Brittany Dunkerly-Eyring are co-inventors on patents related to use of TSC2-S1364/S1365 (human) modifications for immunological and other applications. David Kass and Mark Ranek are co-founders and shareholders of Meta-T Cellular Inc., a start-up company that aims to develop applications of this IP for immune therapy.
SUPPLEMENTAL MATERIALS
Online Supplemental Materials include:
Online Figures I–V
Online Tables I
REFERENCES
- 1.Valvezan AJ and Manning BD. Molecular logic of mTORC1 signalling as a metabolic rheostat. Nature Metabolism. 2019;1:321–333. [DOI] [PubMed] [Google Scholar]
- 2.Saxton RA and Sabatini DM. mTOR Signaling in Growth, Metabolism, and Disease. Cell. 2017;168:960–976. [DOI] [PMC free article] [PubMed] [Google Scholar]
- 3.Inoki K, Zhu T and Guan KL. TSC2 mediates cellular energy response to control cell growth and survival. Cell. 2003;115:577–90. [DOI] [PubMed] [Google Scholar]
- 4.Matsui Y, Takagi H, Qu X, Abdellatif M, Sakoda H, Asano T, Levine B and Sadoshima J. Distinct roles of autophagy in the heart during ischemia and reperfusion: roles of AMP-activated protein kinase and Beclin 1 in mediating autophagy. Circ Res. 2007;100:914–22. [DOI] [PubMed] [Google Scholar]
- 5.Zhai P, Sciarretta S, Galeotti J, Volpe M and Sadoshima J. Differential roles of GSK-3beta during myocardial ischemia and ischemia/reperfusion. Circ Res. 2011;109:502–11. [DOI] [PMC free article] [PubMed] [Google Scholar]
- 6.Ranek MJ, Kokkonen-Simon KM, Chen A, Dunkerly-Eyring BL, Vera MP, Oeing CU, Patel CH, Nakamura T, Zhu G, Bedja D, Sasaki M, Holewinski RJ, Van Eyk JE, Powell JD, Lee DI and Kass DA. PKG1-modified TSC2 regulates mTORC1 activity to counter adverse cardiac stress. Nature. 2019;566:264–269. [DOI] [PMC free article] [PubMed] [Google Scholar]
- 7.Cunningham JT, Rodgers JT, Arlow DH, Vazquez F, Mootha VK and Puigserver P. mTOR controls mitochondrial oxidative function through a YY1-PGC-1alpha transcriptional complex. Nature. 2007;450:736–40. [DOI] [PubMed] [Google Scholar]
- 8.MacVicar T, Ohba Y, Nolte H, Mayer FC, Tatsuta T, Sprenger HG, Lindner B, Zhao Y, Li J, Bruns C, Kruger M, Habich M, Riemer J, Schwarzer R, Pasparakis M, Henschke S, Bruning JC, Zamboni N and Langer T. Lipid signalling drives proteolytic rewiring of mitochondria by YME1L. Nature. 2019;575:361–365. [DOI] [PubMed] [Google Scholar]
- 9.Vigneron F, Dos Santos P, Lemoine S, Bonnet M, Tariosse L, Couffinhal T, Duplaa C and Jaspard-Vinassa B. GSK-3beta at the crossroads in the signalling of heart preconditioning: implication of mTOR and Wnt pathways. Cardiovasc Res. 2011;90:49–56. [DOI] [PubMed] [Google Scholar]
- 10.Sciarretta S, Forte M, Frati G and Sadoshima J. New Insights Into the Role of mTOR Signaling in the Cardiovascular System. Circ Res. 2018;122:489–505. [DOI] [PMC free article] [PubMed] [Google Scholar]
- 11.Das A, Salloum FN, Durrant D, Ockaili R and Kukreja RC. Rapamycin protects against myocardial ischemia-reperfusion injury through JAK2-STAT3 signaling pathway. J Mol Cell Cardiol. 2012;53:858–69. [DOI] [PMC free article] [PubMed] [Google Scholar]
- 12.Ma LL, Ma X, Kong FJ, Guo JJ, Shi HT, Zhu JB, Zou YZ and Ge JB. Mammalian target of rapamycin inhibition attenuates myocardial ischaemia-reperfusion injury in hypertrophic heart. J Cell Mol Med. 2018;22:1708–1719. [DOI] [PMC free article] [PubMed] [Google Scholar]
- 13.Aoyagi T, Kusakari Y, Xiao CY, Inouye BT, Takahashi M, Scherrer-Crosbie M, Rosenzweig A, Hara K and Matsui T. Cardiac mTOR protects the heart against ischemia-reperfusion injury. Am J Physiol Heart Circ Physiol. 2012;303:H75–85. [DOI] [PMC free article] [PubMed] [Google Scholar]
- 14.Wang JF, Mei ZG, Fu Y, Yang SB, Zhang SZ, Huang WF, Xiong L, Zhou HJ, Tao W and Feng ZT. Puerarin protects rat brain against ischemia/reperfusion injury by suppressing autophagy via the AMPK-mTOR-ULK1 signaling pathway. Neural Regen Res. 2018;13:989–998. [DOI] [PMC free article] [PubMed] [Google Scholar]
- 15.Wei Q, Zhao J, Zhou X, Yu L, Liu Z and Chang Y. Propofol can suppress renal ischemia-reperfusion injury through the activation of PI3K/AKT/mTOR signal pathway. Gene. 2019;708:14–20. [DOI] [PubMed] [Google Scholar]
- 16.Jonassen AK, Sack MN, Mjos OD and Yellon DM. Myocardial protection by insulin at reperfusion requires early administration and is mediated via Akt and p70s6 kinase cell-survival signaling. Circ Res. 2001;89:1191–8. [DOI] [PubMed] [Google Scholar]
- 17.Khan S, Salloum F, Das A, Xi L, Vetrovec GW and Kukreja RC. Rapamycin confers preconditioning-like protection against ischemia-reperfusion injury in isolated mouse heart and cardiomyocytes. J Mol Cell Cardiol. 2006;41:256–64. [DOI] [PubMed] [Google Scholar]
- 18.Oeing CU, Nakamura T, Pan S, Mishra S, Dunkerly-Eyring BL, Kokkonen-Simon KM, Lin BL, Chen A, Zhu G, Bedja D, Lee DI, Kass DA and Ranek MJ. PKG1alpha Cysteine-42 Redox State Controls mTORC1 Activation in Pathological Cardiac Hypertrophy. Circ Res. 2020;127:522–533. [DOI] [PMC free article] [PubMed] [Google Scholar]
- 19.Casin KM, Fallica J, Mackowski N, Veenema RJ, Chan A, St Paul A, Zhu G, Bedja D, Biswal S and Kohr MJ. S-Nitrosoglutathione Reductase Is Essential for Protecting the Female Heart From Ischemia-Reperfusion Injury. Circ Res. 2018;123:1232–1243. [DOI] [PMC free article] [PubMed] [Google Scholar]
- 20.Stahlberg M, Nakagawa R, Bedja D, Zhu G, Lin BL, Saberi A, Lee DI and Kass DA. Chronic Atrial and Ventricular Pacing in the Mouse. Circ Heart Fail. 2019;12:e005655. [DOI] [PMC free article] [PubMed] [Google Scholar]
- 21.Lee DI, Zhu G, Sasaki T, Cho GS, Hamdani N, Holewinski R, Jo SH, Danner T, Zhang M, Rainer PP, Bedja D, Kirk JA, Ranek MJ, Dostmann WR, Kwon C, Margulies KB, Van Eyk JE, Paulus WJ, Takimoto E and Kass DA. Phosphodiesterase 9A controls nitric-oxide-independent cGMP and hypertrophic heart disease. Nature. 2015;519:472–6. [DOI] [PMC free article] [PubMed] [Google Scholar]
- 22.Liepinsh E, Makrecka-Kuka M, Volska K, Kuka J, Makarova E, Antone U, Sevostjanovs E, Vilskersts R, Strods A, Tars K and Dambrova M. Long-chain acylcarnitines determine ischaemia/reperfusion-induced damage in heart mitochondria. Biochem J. 2016;473:1191–202. [DOI] [PubMed] [Google Scholar]
- 23.Zuurbier CJ, Bertrand L, Beauloye CR, Andreadou I, Ruiz-Meana M, Jespersen NR, Kula-Alwar D, Prag HA, Eric Botker H, Dambrova M, Montessuit C, Kaambre T, Liepinsh E, Brookes PS and Krieg T. Cardiac metabolism as a driver and therapeutic target of myocardial infarction. J Cell Mol Med. 2020. [DOI] [PMC free article] [PubMed] [Google Scholar]
- 24.Lassaletta AD, Elmadhun NY, Zanetti AV, Feng J, Anduaga J, Gohh RY, Sellke FW and Bianchi C. Rapamycin treatment of healthy pigs subjected to acute myocardial ischemia-reperfusion injury attenuates cardiac functions and increases myocardial necrosis. Ann Thorac Surg. 2014;97:901–7. [DOI] [PMC free article] [PubMed] [Google Scholar]
- 25.Li X, Hu X, Wang J, Xu W, Yi C, Ma R and Jiang H. Inhibition of autophagy via activation of PI3K/Akt/mTOR pathway contributes to the protection of hesperidin against myocardial ischemia/reperfusion injury. Int J Mol Med. 2018;42:1917–1924. [DOI] [PMC free article] [PubMed] [Google Scholar]
- 26.Wang LT, Chen BL, Wu CT, Huang KH, Chiang CK and Hwa Liu S. Protective role of AMP-activated protein kinase-evoked autophagy on an in vitro model of ischemia/reperfusion-induced renal tubular cell injury. PLoS One. 2013;8:e79814. [DOI] [PMC free article] [PubMed] [Google Scholar]
- 27.Peterson TR, Sengupta SS, Harris TE, Carmack AE, Kang SA, Balderas E, Guertin DA, Madden KL, Carpenter AE, Finck BN and Sabatini DM. mTOR complex 1 regulates lipin 1 localization to control the SREBP pathway. Cell. 2011;146:408–20. [DOI] [PMC free article] [PubMed] [Google Scholar]
- 28.Wang P, Lloyd SG and Chatham JC. Impact of high glucose/high insulin and dichloroacetate treatment on carbohydrate oxidation and functional recovery after low-flow ischemia and reperfusion in the isolated perfused rat heart. Circulation. 2005;111:2066–72. [DOI] [PubMed] [Google Scholar]
- 29.Ussher JR, Wang W, Gandhi M, Keung W, Samokhvalov V, Oka T, Wagg CS, Jaswal JS, Harris RA, Clanachan AS, Dyck JR and Lopaschuk GD. Stimulation of glucose oxidation protects against acute myocardial infarction and reperfusion injury. Cardiovasc Res. 2012;94:359–69. [DOI] [PubMed] [Google Scholar]
- 30.Tamm C, Benzi R, Papageorgiou I, Tardy I and Lerch R. Substrate competition in postischemic myocardium. Effect of substrate availability during reperfusion on metabolic and contractile recovery in isolated rat hearts. Circ Res. 1994;75:1103–12. [DOI] [PubMed] [Google Scholar]
- 31.Myers DR, Wheeler B and Roose JP. mTOR and other effector kinase signals that impact T cell function and activity. Immunol Rev. 2019;291:134–153. [DOI] [PMC free article] [PubMed] [Google Scholar]
- 32.Kanno S, Lee PC, Zhang Y, Ho C, Griffith BP, Shears LL, 2nd and Billiar TR. Attenuation of myocardial ischemia/reperfusion injury by superinduction of inducible nitric oxide synthase. Circulation. 2000;101:2742–8. [DOI] [PubMed] [Google Scholar]
- 33.Inserte J and Garcia-Dorado D. The cGMP/PKG pathway as a common mediator of cardioprotection: translatability and mechanism. Br J Pharmacol. 2015;172:1996–2009. [DOI] [PMC free article] [PubMed] [Google Scholar]
- 34.Ockaili R, Salloum F, Hawkins J and Kukreja RC. Sildenafil (Viagra) induces powerful cardioprotective effect via opening of mitochondrial K(ATP) channels in rabbits. Am J Physiol Heart Circ Physiol. 2002;283:H1263–H1269. [DOI] [PubMed] [Google Scholar]
- 35.Salloum FN, Chau VQ, Hoke NN, Abbate A, Varma A, Ockaili RA, Toldo S and Kukreja RC. Phosphodiesterase-5 inhibitor, tadalafil, protects against myocardial ischemia/reperfusion through protein-kinase g-dependent generation of hydrogen sulfide. Circulation. 2009;120:S31–S36. [DOI] [PMC free article] [PubMed] [Google Scholar]
- 36.Kukreja RC, Salloum FN and Das A. Cyclic guanosine monophosphate signaling and phosphodiesterase-5 inhibitors in cardioprotection. J Am Coll Cardiol. 2012;59:1921–7. [DOI] [PMC free article] [PubMed] [Google Scholar]
- 37.Das A, Durrant D, Salloum FN, Xi L and Kukreja RC. PDE5 inhibitors as therapeutics for heart disease, diabetes and cancer. Pharmacol Ther. 2015;147:12–21. [DOI] [PMC free article] [PubMed] [Google Scholar]
- 38.Ballif BA, Roux PP, Gerber SA, MacKeigan JP, Blenis J and Gygi SP. Quantitative phosphorylation profiling of the ERK/p90 ribosomal S6 kinase-signaling cassette and its targets, the tuberous sclerosis tumor suppressors. Proc Natl Acad Sci U S A. 2005;102:667–72. [DOI] [PMC free article] [PubMed] [Google Scholar]
- 39.Pollizzi KN and Powell JD. Integrating canonical and metabolic signalling programmes in the regulation of T cell responses. Nat Rev Immunol. 2014;14:435–46. [DOI] [PMC free article] [PubMed] [Google Scholar]
Associated Data
This section collects any data citations, data availability statements, or supplementary materials included in this article.
Supplementary Materials
Data Availability Statement
The authors declare that all supporting data are available within the article and its Data Supplement. Please see the Major Resources Table in the Data Supplement. TSC2 WT and phospho-mutant expression vectors (plasmids or adenovirus), and corresponding KI mice can be provided upon reasonable request made directly to the corresponding author.
Major Resources Table
| Species | Vendor or Source | Background Strain | Other Information | Persistent ID / URL |
|---|---|---|---|---|
| Mus musculus, TSC2SA, TSC2SE, TSC2WT | own | C57BL/6J | Ranek et al. Nature 2019 | https://www.nature.com/articles/s41586-019-0895-y |
| Clone Name | Sequence | Source / Repository | Persistent ID / URL |
|---|---|---|---|
| Ad - TSC2 WT or TSC2 S1365E or TSC2 S1365A | N-terminally HA-tagged human TSC2 WT, S1365E, S1365A adenovirus, and N-terminally HA-tagged wild-type sequence or human TSC2(S1365A) or TSC2(S1365E) adenovirus | plasmid encoding human HA-tagged TSC2WT or TSC2S1365E or TSC2S1365A (Ranek et al. Nature 2019) | https://www.nature.com/articles/s41586-019-0895-y#Sec2 |
| Name | Vendor or Source | Sex (F, M, or unknown) | Persistent ID / URL |
|---|---|---|---|
| Neonatal rat cardiomyocytes (NRCMs) from Hannover Wistar rats | Janvier Labs, France | both | https://www.janvier-labs.com/en/fiche_produit/wistar_rat/ |
| Description | Source / Repository | Persistent ID / URL |
|---|---|---|
| Ppara (mouse) | Forward 5’-GCGTACGGCAATGGCTTTAT-3’, Reverse 5’-GAACGGCTTCCTCAGGTTCTT-3’ | |
| Pgc1a (mouse) | Forward 5’-CAACATGCTCAAGCCAAACCAACA-3’, Reverse 5’-CGTCAATAGTCTTGTTCTCAAATGGG-3’ | |
| Acot1 (mouse) | Forward 5’-GACAAGAAGAGCTTCATTCCCGTG-3’, Reverse 5’-CATCAGCATAGAACTCGCTCTTCC-3’ | |
| Acot2 (mouse) | Forward 5’-AGTCAACGACGCAAAATGGTG-3’, Reverse 5’-GCTCTTCCAATCCTGTTGGC-3’ | |
| Acc1 (mouse) | Forward 5’-TGTACAAGCAGTGTGGGCTGGCT-3’, Reverse 5’-CCACATGGCCTGGCTTGGAGGG-3’ | |
| Acc2 (mouse) | Forward 5’-CTGCTACGAGGTGTGTTCATC-3’, Reverse 5’-AGCTCTGCATGACATTGCCC-3’ | |
| Gapdh (mouse) | Forward 5’-AGGTCGGTGTGAACGGATTTG-3’, Reverse 5’-TGTAGACCATGTAGTTGAGGTCA-3’ |