

Abstract
We investigated the temporal trends of short-term mortality (death within 1 year of diagnosis) and cause-specific deaths in human immunodeficiency virus (HIV)-infected persons by stage of HIV infection at diagnosis. We also assessed the impact of late diagnosis (LD) on short-term mortality.
Epidemiological records of HIV-infected Singapore residents from the National HIV Registry were linked to death records from the Registry of Births and Deaths for observational analyses. Newly-diagnosed HIV cases with available cluster of differentiation 4 count at time of diagnosis in a 5-year period from 2012 to 2016 were included in the study. Hazard ratios (HRs) and 95% confidence interval (CI) of LD for all deaths excluding suicides and self-inflicted or accidental injuries, and HIV/ acquired immunodeficiency syndrome (AIDS)-related deaths occurring within 1 year post-diagnosis were calculated using Cox proportional hazards regression models with adjustment for age at HIV/AIDS diagnosis. Population attributable risk proportions (PARPs) were then calculated using the adjusted HRs.
Of the 1990 newly-diagnosed HIV cases included in the study, 7.2% had died by end of 2017, giving an overall mortality rate of 2.16 per 100 person-years (PY) (95% CI 1.82–2.54). The mortality rate was 3.81 per 100 PY (95% CI 3.15–4.56) in HIV cases with LD, compared with 0.71 (95% CI 0.46–1.05) in non-LD (nLD) cases. Short-term mortality was significantly higher in LD (9.1%) than nLD cases (1.1%). Of the 143 deaths reported between 2012 and 2017, 58.0% were HIV/AIDS-related (nLD 28.0% vs LD 64.4%). HIV/AIDS-related causes represented 70.4% of all deaths which occurred during the first year of diagnosis (nLD 36.4% vs LD 74.7%). The PARP of short-term mortality due to LD was 77.8% for all deaths by natural causes, and 87.8% for HIV/AIDS-related deaths.
The mortality rate of HIV-infected persons with LD was higher than nLD, especially within 1 year of diagnosis, and HIV/AIDS-related causes constituted majority of these deaths. To reduce short-term mortality, persons at high risk of late-stage HIV infection should be targeted in outreach efforts to promote health screening and remove barriers to HIV testing and treatment.
Keywords: AIDS-defining illness, causes of death, HIV, late diagnosis, mortality, Singapore
1. Introduction
The advent of highly-active antiretroviral therapy (HAART) has revolutionized human immunodeficiency virus (HIV) treatment and transformed HIV from a terminal illness to a manageable chronic disease. However, late diagnosis (LD) of HIV infection remains an important clinical and public health issue. Late-stage HIV infection at diagnosis reflects missed opportunities to reap the full benefits of early initiation of antiretroviral therapy (ART), and results in a higher likelihood of negative health outcomes including premature death and risk of onward transmission by persons who are unaware of their HIV status.[1]
The estimates of the proportion of newly-diagnosed HIV cases with delayed entry to HIV care in developed countries ranged from 15% to 45%, depending on the definition of LD.[2,3] The elevated risk of death among HIV-infected persons has been attributed mainly to delayed entry into HIV care, hence it is important to initiate early diagnosis and treatment, and management of immunosuppression and associated opportunistic infections and other acquired immunodeficiency syndrome (AIDS)-associated diseases.[4–8] In particular, deaths during the first year of treatment could be prevented and short-term mortality drastically reduced if the HIV diagnosis had been made earlier with timely access to ART.[9] As earlier use of ART has been found to yield better clinical outcomes for people living with HIV (PLHIV) in both resource-rich and resource-limited settings[10,11] the World Health Organization made a recommendation in 2015 that ART should be initiated in all HIV cases regardless of cluster of differentiation 4 (CD4) cell count or clinical stage.[12]
In countries with high levels of linkage to HIV care and access to antiretroviral drugs, the spectrum of causes of deaths among HIV-infected persons has gradually shifted with an increasing proportion of deaths due to non-AIDS defining illnesses (non-ADIs) in the HAART era compared with the pre-HAART era.[13–17] It is important to monitor the causes of death in HIV-infected persons, so that appropriate and timely interventions can be undertaken to improve the quality of patient care and management of comorbidities, and reduce preventable mortality.[7]
In Singapore, a cumulative total of 8618 infected residents had been reported as of end-2019, of whom 2097 had died.[18] Despite the availability of HAART since 1996, 54% of Singapore residents diagnosed with HIV/AIDS between 1996 and 2009 had late-stage HIV infection at diagnosis.[19] Among HIV/AIDS cases diagnosed between 1985 and 2007, the median survival of those with LD was 5 years, whereas the cumulative proportion of cases with non-LD (nLD) surviving until the fifth year since diagnosis was 80%.[20]
In this study, we described the temporal trends of short-term mortality and cause-specific deaths by stage of HIV infection at diagnosis in Singapore. We also examined the impact of LD on survival pattern of HIV-infected persons, and estimated the population attributable risk proportion (PARP) of all-cause and HIV/AIDS-related deaths due to LD.
2. Methods
2.1. Study population
In Singapore, HIV/AIDS is a notifiable disease under the Infectious Diseases Act.[21] The National HIV Registry contains information on notification by medical practitioners and laboratories of HIV cases, and additional information obtained through review of medical case notes and interviews with the HIV-infected individuals. The information collected includes socio-demographic characteristics, the first CD4 count, mode of transmission, mode of detection, and whether there were HIV tests prior to the positive diagnosis. Less than 2% of all cases notified between 2012 and 2015 progressed from HIV to AIDS within 1 year of diagnosis.
The study population comprised all HIV cases who, after diagnosis, were notified to the National HIV Registry between 2012 and 2016. Approval for this study was provided by the Ministry of Health, Singapore. As the data were collected under the Infectious Diseases Act, and analyses were performed on an anonymized dataset, informed consent was not required for this study.
2.2. Mortality data
The primary causes of death based on the 10th edition of International Classification of Diseases (ICD-10) codes were obtained from the Singapore Registry of Births and Deaths. We classified causes of death into the following 9 categories: HIV/AIDS infection (B20-B24, R75); malignancies (codes C00-D48), cardiovascular disease (codes I00-I99); liver disease (B15-B19, B70, K73, K74, K769); tuberculosis (A15-A19); pneumonia (J12-J18); suicide and self-inflicted injuries (X60-X84, Y10-Y34); accidental injuries (V01-Y89, excluding X60-X84 and Y10-Y34), and other causes (excluding codes included in the preceding categories).
We defined short-term mortality as death from any cause within 1 year of HIV/AIDS diagnosis. Deaths reported by the end of 2017 were included in the analysis.
LD was defined as having CD4 count <200 cells/mm3 at the time of HIV diagnosis or an ADI at diagnosis or within 1 year of HIV diagnosis.[19] We excluded cases whose first available date of CD4 count was >90 days after their HIV diagnosis date as they would most likely have been started on treatment on their first date of CD4 count, hence it was unknown whether these cases had LD or non-LD (nLD).
2.3. Data analysis
The Chi-square test or Fisher exact test, where appropriate, was used to compare baseline characteristics between any 2 groups. Changes in proportion over time were analyzed using the Chi-square test for linear trend.
We used Kaplan–Meier curves to describe the survival patterns, and log-rank test to compare survival between LD and nLD cases. Follow-up commenced on the date of HIV diagnosis and ceased on the date of death or December 31, 2017 for cases who were still alive. Mortality rates per 100 person-years (PY) were calculated.
Adjusted hazard ratios (aHRs) and 95% confidence intervals (CIs) of LD for all-cause deaths excluding suicide and self-inflicted or accidental injuries, and HIV/AIDS-related deaths, were calculated using Cox proportional hazards regression models with adjustment for age at HIV/AIDS diagnosis. For the purposes of this analysis of short-term mortality, cases were censored if they were still alive 1 year after HIV/AIDS diagnosis. We checked the proportionality assumption of the multivariable Cox model using Schoenfeld residuals test, and no violation was observed.
Population attributable risk proportion (PARP) indicated the proportional reduction in average risk of death over a specific time interval if the risk factor for excess mortality were absent while distributions of other risk factors in the population remained unchanged.[22] The PARP due to LD was defined as the proportion of deaths within 1 year from diagnosis that would have been prevented in the absence of LD, and it was calculated as pd × (aHR − 1)/aHR, where pd was the proportion of deaths among HIV/AIDS cases with LD.[23] The estimated number of excess deaths due to LD was computed as PARP multiplied by number of deaths in the first year of HIV diagnosis, and the percentage of potential reduction in total number of deaths was then calculated as the estimated number of excess deaths divided by total number of deaths (short-term and long-term mortality).
All P values reported were 2-sided and statistical significance was taken as P < .05. We used R version 3.6.1 (R Foundation for Statistical Computing, Vienna, Austria) and Stata version 16 (StataCorp, College Station, TX) for statistical analyses.
3. Results
3.1. Characteristics of the study population
Between January 2012 and December 2016, 2242 newly diagnosed HIV/AIDS cases were notified to the National HIV Registry. 1990 cases were included in the analysis, after excluding 138 cases without any record of CD4 cell count and 114 cases whose date of first CD4 count was >90 days after the date of HIV diagnosis. These 1990 cases contributed 6622 person-years during the follow-up period. The median follow-up was 3.33 years (interquartile range [IQR] 2.05–4.64).
Most of the cases were men (93.2%), median age at HIV/AIDS diagnosis was 41 years (IQR 32–52), 72.7% were Chinese, 77.8% had attained post-secondary or higher educational level, and 61.2% worked in professional/managerial positions or administrative/service-oriented sectors (Table 1). Nearly half of the cases were detected via medical care (49.9%) and had HIV test(s) prior to positive diagnosis (47.8%) while 11.3% had unknown testing history. About 54.3% of the cases were infected via homosexual/bisexual transmission.
Table 1.
Sociodemographic and epidemiological characteristics of HIV/AIDS cases newly-diagnosed in 2012 to 2016, and deaths within 1 year of diagnosis stratified by stage of HIV infection at diagnosis.
| Stage of HIV infection at diagnosis | ||||||||
| LD | nLD | |||||||
| Characteristic | No. of newly diagnosed cases | No. of deaths within 1 year of diagnosis | No. of LD | % of newly diagnosed cases with LD | No. of deaths within 1 year of diagnosis | Short-term mortality (%) | No. of deaths within 1 year of diagnosis | Short-term mortality (%) |
| All | 1990 | 98 | 957 | 48.1 | 87 | 9.1 | 11 | 1.1 |
| Age at diagnosis, y | ||||||||
| 0–14 | 2 | 0 | 0 | 0.0 | 0 | - | 0 | 0.0 |
| 15–24 | 182 | 2 | 26 | 14.3 | 2 | 7.7 | 0 | 0.0 |
| 25–34 | 454 | 10 | 134 | 29.5 | 9 | 6.7 | 1 | 0.3 |
| 35–44 | 532 | 19 | 251 | 47.2 | 18 | 7.2 | 1 | 0.4 |
| 45–54 | 460 | 26 | 288 | 62.6 | 23 | 8.0 | 3 | 1.7 |
| 55–64 | 264 | 23 | 187 | 70.8 | 22 | 11.8 | 1 | 1.3 |
| ≥65 | 96 | 18 | 71 | 74.0 | 13 | 18.3 | 5 | 20.0 |
| Gender | ||||||||
| Male | 1854 | 92 | 886 | 47.8 | 82 | 9.3 | 10 | 1.0 |
| Female | 136 | 6 | 71 | 52.2 | 5 | 7.0 | 1 | 1.5 |
| Ethnic group | ||||||||
| Chinese | 1446 | 75 | 715 | 49.4 | 68 | 9.5 | 7 | 1.0 |
| Malay | 346 | 13 | 162 | 46.8 | 12 | 7.4 | 1 | 0.5 |
| Indian | 123 | 8 | 47 | 38.2 | 5 | 10.6 | 3 | 3.9 |
| Others | 75 | 2 | 33 | 44.0 | 2 | 6.1 | 0 | 0.0 |
| Education level | ||||||||
| No formal/Primary | 170 | 11 | 114 | 67.1 | 10 | 8.8 | 1 | 1.8 |
| Secondary | 262 | 11 | 147 | 56.1 | 11 | 7.5 | 0 | 0.0 |
| Post-secondary/Diploma | 1,298 | 71 | 608 | 46.8 | 62 | 10.2 | 9 | 1.3 |
| University degree or higher | 251 | 5 | 86 | 34.3 | 4 | 4.7 | 1 | 0.6 |
| Unknown | 9 | 0 | 2 | 22.2 | 0 | 0.0 | 0 | 0.0 |
| Occupational type | ||||||||
| Professional/executive | 407 | 17 | 196 | 48.2 | 16 | 8.2 | 1 | 0.5 |
| Administrative/service | 811 | 27 | 374 | 46.1 | 27 | 7.2 | 0 | 0.0 |
| Blue-collar worker | 283 | 22 | 194 | 68.6 | 18 | 9.3 | 4 | 4.5 |
| Unemployed | 73 | 8 | 40 | 54.8 | 7 | 17.5 | 1 | 3.0 |
| Others | 275 | 12 | 89 | 32.4 | 9 | 10.1 | 3 | 1.6 |
| Unknown | 141 | 12 | 10 | 7.1 | 54 | 15.6 | 2 | 2.6 |
| Mode of detection | ||||||||
| Own request | 380 | 2 | 75 | 19.7 | 2 | 2.7 | 0 | 0.0 |
| Medical care | 993 | 84 | 706 | 71.1 | 76 | 10.8 | 8 | 2.8 |
| Routine programmatic HIV screening∗ | 501 | 10 | 140 | 27.9 | 8 | 5.7 | 2 | 0.6 |
| Others | 116 | 2 | 36 | 31.0 | 1 | 2.8 | 1 | 1.3 |
| Whether had previous HIV test(s) | ||||||||
| Yes | 947 | 4 | 287 | 30.3 | 2 | 0.7 | 2 | 0.3 |
| No | 819 | 18 | 537 | 65.6 | 16 | 3.0 | 2 | 0.7 |
| Unknown | 224 | 76 | 133 | 59.4 | 69 | 51.9 | 7 | 7.7 |
| Mode of HIV transmission | ||||||||
| Homosexual/ bisexual | 1,081 | 26 | 397 | 36.7 | 24 | 6.0 | 2 | 0.3 |
| Heterosexual | 849 | 57 | 526 | 62.0 | 50 | 9.5 | 7 | 2.2 |
| IDU and others | 15 | 0 | 6 | 40.0 | 0 | 0.0 | 0 | 0.0 |
| Unknown | 45 | 15 | 28 | 62.2 | 13 | 46.4 | 2 | 11.8 |
| Year of HIV/AIDS diagnosis | ||||||||
| 2012 | 417 | 26 | 220 | 52.8 | 23 | 10.5 | 3 | 1.5 |
| 2013 | 381 | 18 | 177 | 46.5 | 17 | 9.6 | 1 | 0.5 |
| 2014 | 410 | 27 | 219 | 53.4 | 23 | 10.5 | 4 | 2.1 |
| 2015 | 412 | 14 | 177 | 43.0 | 13 | 7.3 | 1 | 0.4 |
| 2016 | 370 | 13 | 164 | 44.3 | 11 | 6.7 | 2 | 1.0 |
IDU = intravenous drug use, LD = late diagnosis, nLD = non-late diagnosis.
Routine programmatic HIV screening includes screening programmes for persons with sexually transmitted infections, hospital inpatients, and those identified through contact tracing.
About 48.1% of the cases had LD. The overall median CD4 count was 220 cells/mm3 (IQR 51–382), and the median CD4 count was lower for LD cases at 48 cells/mm3 (IQR 20–113) compared with nLD cases at 371 cells/mm3 (286–499) (P < .0005). The proportion of cases with LD decreased from 52.8% in 2012 to 44.3% in 2016 (P for trend = .009) (Table 1). Among the 957 newly-diagnosed LD cases, 46.9% had CD4 <200 cells/mm3 without an ADI, 2.9% had an ADI with CD4 ≥200 cells/mm3, and 50.2% presented with CD4 <200 cells/mm3 and an ADI. There was a significant decline in the proportion of LD cases who presented with both CD4 <200 cells/mm3 and an ADI, from 59.1% in 2012 to 39.0% in 2016 (Fig. 1).
Figure 1.

Distribution of clinical and immunological features of HIV/AIDS cases with late diagnosis (LD) by year of diagnosis, 2012 to 2016. LD = late diagnosis, nLD = non-late diagnosis.
Compared with nLD cases, those with LD were older; the median age was 47 years (IQR 38–55) versus 36 years (IQR 27–45) (P < .0005). A significantly higher proportion of LD cases had secondary school or lower level of education (27.3% vs16.6%), worked as blue-collar workers (20.3% vs 8.6%), were detected during the course of medical care (73.8% vs 27.8%), and were infected via the heterosexual route (55.0% vs 31.3%).
The short-term mortality was higher in LD cases than nLD cases across most of the socio-demographic and epidemiological characteristics (Table 1). Among elderly persons aged ≥65 years at HIV diagnosis, the short-term mortality was not statistically different between LD cases and nLD cases (18.3% vs 20.0%; P = .852).
3.2. Mortality rates
By the end of 2017, 143 (7.2%) of the 1990 HIV cases diagnosed between 2012 and 2016 had died. The median age at death was 53 years (IQR 42–62), with a decrease from 56 years in 2016 to 44 years in 2017. There was no significant difference in age at death between LD cases (median 53, IQR 42–62) and nLD cases (median 54, IQR 41–65). The overall mortality rate per 100 PY was 2.16 (95% CI 1.82–2.54), with a drastic drop from 8.93 (95% CI 5.37–13.93) in 2012 to 1.02 (95% CI 0.62–1.60) in 2017 (Fig. 2A). The median interval between HIV/AIDS diagnosis and death was 3.2 months (IQR 1.1–16.0).
Figure 2.

Annual all-cause mortality rate per 100 person-years among HIV/AIDS cases, 2012 to 2017. (A) Overall. (B) Late diagnosis and non-late diagnosis. LD = late diagnosis, nLD = non-late diagnosis.
The mortality rate per 100 PY was 3.81 (95% CI 3.15–4.56) in LD cases, compared with 0.71 (95% CI 0.46–1.05) in nLD cases; the mortality rate ratio was 5.37 (95% CI 3.49–8.27). The median interval between HIV/AIDS diagnosis and death was shorter in LD cases at 2.0 months (IQR 0.8–13.8), compared with 13.5 months (IQR 4.3–22.5) in nLD cases (P = .001).
Among LD cases, the mortality rate per 100 PY decreased from 15.33 (95% CI 8.92–24.52) in 2012 to 1.30 (95% CI 0.65–2.33) in 2017 (Fig. 2B). Among nLD cases, the mortality rate per 100 PY halved from 1.96 (95% CI 0.24–7.08) in 2012 to 1.00 (95% CI 0.21–2.93) in the following year (Fig. 2B). The mortality rate per 100 PY in nLD cases was lowest at 0.29 (95% CI 0.03–1.04) in 2015, followed by a gradual increase to 0.79 (95% CI 0.34–1.56) in 2017.
One hundred forty three deaths occurred in the 6-year period from 2012 to 2017, of which 68.5% died within the first year of their HIV/AIDS diagnosis. The proportion of LD cases who died within 1 year of HIV/AIDS diagnosis was 9.1% (87 of 957), compared with 1.1% (11 of 1033) for nLD cases (P < .0005) (Table 1). The short-term mortality increased with age at HIV diagnosis; the proportion of deaths within 1 year of diagnosis doubled from 5.7% in HIV-infected persons aged 45 to 54 years to 11.4% in those aged ≥55 years. There was a significant decline in short-term mortality during the period of HIV diagnosis, from 6.6% in cases diagnosed in 2014 (6.6%) to 3.4% in those diagnosed in 2015 (P = .036).
The survival patterns differed between LD cases and nLD cases (Fig. 3) (P < .0005). The survival probability at 1 year from HIV/AIDS diagnosis was 90.9% (95% CI 89.1–92.7) for LD cases, compared with 98.9% (95% CI 98.3–99.6) for nLD cases. At 3 years from diagnosis, the survival probability was 88.0% (95% CI 85.9–90.1) for LD cases, compared with 97.6% (95% CI 96.6–98.6) for nLD cases. At 5 years from diagnosis, the survival probability was 86.5% (95% CI 84.2–88.9) for LD cases, compared with 97.3% (95% CI 96.1–98.4) for nLD cases.
Figure 3.
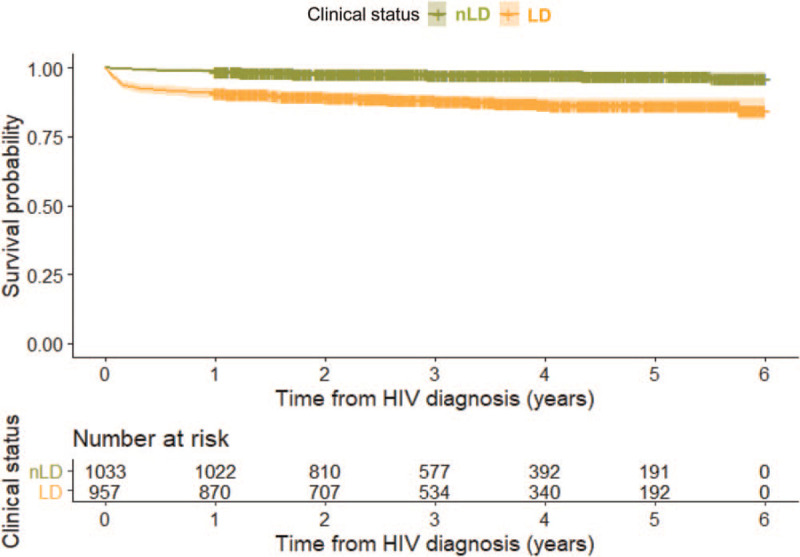
Kaplan–Meier survival estimates of HIV/AIDS cases stratified by stage of HIV infection at diagnosis. The number at risk since diagnosis is shown in the table below the figure. LD = late diagnosis, nLD = non-late diagnosis.
3.3. Causes of death
Of the 143 deaths that occurred in 2012 to 2017, 58.0% were HIV/AIDS-related (nLD 28.0% vs LD 64.4%), 11.9% were malignancy-related (nLD 12.0% vs LD 11.9%), 9.8% were due to suicide and self-inflicted injuries (nLD 28.0% vs LD 5.9%), 6.3% were cardiovascular disease related (nLD 8.0% vs LD 5.9%), 3.5% were pneumonia-related (nLD 0.0% vs LD 4.2%), 2.1% were due to accidental injuries (nLD 8.0% vs LD 0.8%), 1.4% were tuberculosis-related (nLD 0.0% vs LD 1.7%), 1.4% were related to liver disease (nLD 4.0% vs LD 0.8%), and the remaining 5.6% were due to other causes (nLD 12.0% vs LD 4.2%) (Fig. 4).
Figure 4.

Distribution of causes of death of HIV/AIDS cases diagnosed from 2012 to 2016 according to time interval between HIV diagnosis and death, stratified by stage of HIV infection at diagnosis. LD = late diagnosis, nLD = non-late diagnosis.
Of the 98 deaths that occurred within 1 year of HIV diagnosis, the majority (88.8%) had LD. HIV/AIDS-related causes accounted for 70.4% of all deaths that occurred during the first year of diagnosis (nLD 36.4% vs LD 74.7%), compared with 31.1% of deaths that occurred >1 year (nLD 21.4% vs LD 35.5%). Among the 45 cases who died >1 year since diagnosis, malignancies were the second most common cause of death (24.4% overall; nLD 21.4% vs LD 25.8%) after HIV/AIDS.
There was a decrease in HIV/AIDS-related mortality rate per 100 PY from 6.58 (95% CI 3.59–11.03) in 2012 to 0.27 (95% CI 0.09–0.63) in 2017 (Fig. 5). Non-HIV/AIDS related mortality rate per 100 PY declined from 2.35 (95% CI 0.76–5.48) in 2012 to 0.65 (95% CI 0.32–1.16) in 2016, followed by a slight increase to 0.75 (95% CI 0.41–1.27) in 2017. The rate ratio of HIV/AIDS-related to non-HIV/AIDS-related mortality decreased from 2.80 (95% CI 1.01–7.77) in 2012 to 0.91 (95% CI 0.39–2.14) in 2016, and 0.36 (95% CI 0.13–0.99) in 2017.
Figure 5.

Annual mortality rate per 100 person-years by HIV/AIDS-related and non-HIV/AIDS related causes of death, 2012 to 2017.
3.4. Short-term mortality attributable to late-stage HIV infection at diagnosis
Table 2 illustrates the impact of LD on all-cause and HIV/AIDS-related deaths during the first year post-HIV diagnosis. Compared with nLD, cases with LD had nearly 7-fold higher risk of all-cause death (aHR 6.7, 95% CI 3.5–12.9), and 15-fold higher risk of HIV/AIDS-related death (aHR 6.7, 95% CI 3.5–12.9).
Table 2.
Hazard ratio and population attributable risk proportion for short-term mortality from all deaths by natural causes and HIV/AIDS-related deaths due to late diagnosis among newly-diagnosed cases in 2012 to 2016.
| Number of cases | PY | Number of deaths within 1 year of HIV/AIDS diagnosis | Mortality rate per 1000 PY (95% CI) | aHR† (95% CI) | PARP | Estimated number of excess deaths | Reduction in total number of deaths | |
| All-cause death∗ | ||||||||
| nLD | 1024 | 1018 | 9 | 8.8 (4.0–16.8) | 1.0 (Referent) | |||
| LD | 949 | 884 | 81 | 91.7 (72.8–113.9) | 7.4 (3.6–15.0) | 77.8% | 70 | 55.6% |
| HIV/AIDS-related death | ||||||||
| nLD | 1015 | 1023 | 4 | 3.9 (1.1–10.0) | 1.0 (Referent) | |||
| LD | 915 | 883 | 65 | 73.7 (56.8–93.8) | 14.6 (5.2–41.1) | 87.8% | 61 | 73.5% |
aHR = adjusted hazard ratio, CI = confidence intervals, LD = late diagnosis, nLD = non-late diagnosis, PARP = population attributable risk proportion, PY = person-years.
Excluding deaths due to suicide and self-inflicted or accidental injuries.
Adjusted for age group at HIV diagnosis.
The PARP due to LD was 77.8% for all deaths excluding those due to suicide and self-inflicted or accidental injuries, and 87.8% for HIV/AIDS-related deaths that occurred within 1 year from HIV/AIDS diagnosis (Table 2). Assuming no effect on deaths occurring >1 year after diagnosis and no other competing risks, this suggested a potential reduction of 55.6% for all deaths by natural causes and 73.5% for HIV/AIDS-related deaths over the study period if there were no LD among the cases.
4. Discussion
The advent of HAART has brought about a drastic decline in the mortality rate among PLHIV, particularly for those diagnosed at early-stage HIV infection. This could be attributed to improvements in treatment, including earlier initiation of ART regardless of CD4 count, increased potency and reduced toxicity of antiretroviral drugs, particularly with the growing use of integrase inhibitors, and more strategic monitoring for treatment effectiveness and toxicity. However, about half of the newly-diagnosed cases in our study were already at late-stage HIV infection at the time of diagnosis. Compared with nLD cases, LD cases had significantly higher mortality risk in the first year following their HIV/AIDS diagnosis, which was 7-fold higher for all deaths excluding suicides and self-inflicted or accidental injuries, and 15-fold higher for HIV/AIDS-related deaths (Table 2).
In our study, a higher proportion of heterosexual men had LD compared with MSM, and their short-term mortality was also higher (7.3% vs 2.4%). This could be attributed to differences in their knowledge and risk perception of HIV and frequency of HIV testing.
Our study revealed that nearly three-quarters of deaths in LD cases who died within 1 year of diagnosis were due to HIV/AIDS (Fig. 4). The proportion of deaths attributable to hepatic disease among HIV-infected persons has increased in developed countries.[13,15,24] Coinfection with hepatitis C virus (HCV) is known to increase the risk of death for all causes and liver-related causes.[25] The proportion of deaths due to hepatic disease was much lower (1.4%) in our study. This could be due to the low prevalence of HCV coinfection in Singapore, which was 6.5% in HIV-infected patients seeking HIV care between 2006 and 2017.[26]
Non-HIV/AIDS related mortality rate had overtaken the HIV/AIDS-related mortality rate in 2016 and 2017. Factors contributing to the shift in spectrum of the causes of death include the proportion of LD, prevalence of comorbidities and lifestyle risk factors, poly-pharmacy and socio-economic profile.[13,17,24,27] This underscores the importance of early screening, prompt diagnosis, optimization of treatment, and effective management of comorbidities and drug–drug interactions in reducing mortality in HIV-positive persons.
LD was found to be a major prognostic factor of mortality, particularly in premature and HIV/AIDS-related deaths in many countries.[4,6,28,29,30,31,32] We estimated that 77.8% of all deaths excluding suicides and self-inflicted or accidental injuries and 87.8% of HIV/AIDS-related deaths within 1 year from diagnosis could have been prevented with early diagnosis (Table 2). As the rate of inpatient HIV testing remains low in Singapore,[33,34] it is imperative to boost the uptake of HIV testing in order to reduce LD and delayed treatment resulting in poorer prognosis.
The second most common cause of death was suicide and self-inflicted injuries (7.1%) for short-term mortality, and non-AIDS-related malignancies (24.4%) for cases who died >1 year after diagnosis. Deaths from suicide and self-inflicted injuries are of particular concern. Despite the availability of ART, suicide rates remained significantly higher in PLHIV than in the general population.[35] PLHIV facing high levels of HIV-related stigma were more likely to delay enrollment into care than those who did not perceive HIV-related stigma.[36] To reduce rates of suicide, there is a need to reduce HIV-related stigma and discrimination, provide routine screening and close monitoring for depression and drug and alcohol misuse, and expand the network of psychosocial support.
In Spain, the highest excess mortality rates compared with the general population were observed in cancer and cardiovascular disease, which could be attributed to higher frequency of smoking, alcohol and recreational drug consumption, faster ageing, and the premature presentation of comorbidities in PLHIV.[37] While mortality rates among the HIV population may remain higher than in the general population, further improvements in life expectancy could be made by facilitating prompt HIV diagnosis, modifying lifestyle or behavioral risk factors, and improving retention in HIV care.[38] The impact of LD on mortality highlights the importance of early detection of the infection through regular HIV testing particularly in the at-risk groups, that is, older men, and those with heterosexual orientation and non-professional occupations.[19] An ageing population may present additional challenges in the clinical management of PLHIV, such as interaction between medications for chronic comorbid conditions and antiretroviral drugs.[39]
There are a few limitations in this study. Epidemiological data from the National HIV Registry did not capture information on treatment history, including duration for cases to commence treatment following their diagnosis, or whether these cases died before receiving treatment. We excluded 11.2% of all newly-diagnosed HIV/AIDS cases from the analysis, as their CD4 count at time of diagnosis was unavailable for classification of the stage of HIV infection. The impact on short-term mortality could otherwise have been under-estimated to some extent if ART increased CD4 cell counts significantly between HIV diagnosis and the first CD4 count.[9] On the other hand, a study had assessed that while the impact of LD on mortality could be significantly reduced by ART over time, excess mortality related to late-stage HIV infection would not be eliminated in the first year after diagnosis.[6] As death certificates were used to ascertain the cause of death for this study, there is a lack of specificity in the underlying cause compared with medical records.[16] We classified deaths as HIV/AIDS-related if the ICD-10 code for the underlying cause was B20-B24. There might be misclassification for some causes of death, especially if the ICD-10 code was for an opportunistic illness in the case definition for HIV infection.[40] Information on pre-existing medical conditions such as cancer and cardiovascular disease, which might have contributed to mortality but not regarded as the primary cause of death, was unavailable. HIV-infected persons might not have been enrolled into care or reported to the National HIV Registry. It was estimated that 80% of PLHIV in Singapore were aware of their HIV status as of end-2018.[41]
In conclusion, the mortality rate of HIV-infected persons with LD was higher than those with nLD. Of the deaths that occurred within 1 year of HIV diagnosis, majority were due to HIV/AIDS-related causes and those with LD. In order to achieve better prognosis and reduce short-term mortality, early testing and diagnosis of persons at high risk of late-stage HIV infection remains a public health priority.
Acknowledgments
The authors thank the staff at the Singapore National HIV Registry for cross-matching the HIV epidemiological database and death records, and providing the de-identified data for this study.
Author contributions
Conceptualization: Li Wei Ang.
Data curation: Li Wei Ang.
Formal analysis: Li Wei Ang.
Methodology: Li Wei Ang.
Visualization: Li Wei Ang.
Writing – original draft: Li Wei Ang.
Writing – review & editing: Li Wei Ang, Matthias Paul Han Sim Toh, Chen Seong Wong, Irving Charles Boudville, Sophia Archuleta, Vernon Jian Ming Lee, Yee Sin Leo, Angela Chow.
Footnotes
Abbreviations: AIDS = acquired immunodeficiency syndrome, CD4 = cluster of differentiation 4, CI = confidence interval, HAART = highly-active antiretroviral therapy, HR = hazard ratio, HIV = human immunodeficiency virus, ICD = International Classification of Diseases, LD = late diagnosis, nLD = non-late diagnosis, PARP = population attributable risk proportion, PY = person-years.
How to cite this article: Ang LW, Toh MP, Wong CS, Boudville IC, Archuleta S, Lee VJ, Leo YS, Chow A. Short-term mortality from HIV-infected persons diagnosed from 2012 to 2016: impact of late diagnosis of HIV infection. Medicine. 2021;100:26(e26507).
Patient Consent: Not applicable.
Data Availability Statement: The datasets analyzed during the current study are not publicly available due to institutional restrictions as the data is collected under the Infectious Diseases Act in Singapore. All data relevant to the study are included in the article.
The authors have no funding and conflicts of interest to disclose.
The datasets generated during and/or analyzed during the current study are not publicly available, but are available from the corresponding author on reasonable request.
References
- [1].Marks G, Crepaz N, Senterfitt JW, Janssen RS. Meta-analysis of high-risk sexual behavior in persons aware and unaware they are infected with HIV in the United States: implications for HIV prevention programs. J Acquir Immune Defic Syndr 2005;39:446–53. [DOI] [PubMed] [Google Scholar]
- [2].Fisher M. Late diagnosis of HIV infection: major consequences and missed opportunities. Curr Opin Infect Dis 2008;21:01–3. [DOI] [PubMed] [Google Scholar]
- [3].Girardi E, Sabin CA, Monforte AD. Late diagnosis of HIV infection: epidemiological features, consequences and strategies to encourage earlier testing. J Acquir Immune Defic Syndr 2007;46: suppl: S3–8. [DOI] [PubMed] [Google Scholar]
- [4].Simmons RD, Ciancio BC, Kall MM, Rice BD, Delpech VC. Ten-year mortality trends among persons diagnosed with HIV infection in England and Wales in the era of antiretroviral therapy: AIDS remains a silent killer. HIV Med 2013;14:596–604. [DOI] [PubMed] [Google Scholar]
- [5].Grangeiro A, Escuder MM, Menezes PR, Alencar R, Ayres de Castilho E. Late entry into HIV care: estimated impact on AIDS mortality rates in Brazil, 2003–2006. PLoS One 2011;6:e14585. [DOI] [PMC free article] [PubMed] [Google Scholar]
- [6].Sobrino-Vegas P, Moreno S, Rubio R, et al. Impact of late presentation of HIV infection on short-, mid- and long-term mortality and causes of death in a multicenter national cohort: 2004–2013. J Infect 2016;72:587–96. [DOI] [PubMed] [Google Scholar]
- [7].Croxford S, Kitching A, Desai S, et al. Mortality and causes of death in people diagnosed with HIV in the era of highly active antiretroviral therapy compared with the general population: an analysis of a national observational cohort. Lancet Public Health 2017;2:e35–46. [DOI] [PubMed] [Google Scholar]
- [8].Mocroft A, Lundgren JD, Sabin ML, et al. Collaboration of Observational HIV Epidemiological Research Europe (COHERE) study in EuroCoord. Risk factors and outcomes for late presentation for HIV-positive persons in Europe: results from the Collaboration of Observational HIV Epidemiological Research Europe Study (COHERE). PLoS Med 2013;10:e1001510. [DOI] [PMC free article] [PubMed] [Google Scholar]
- [9].Chadborn TR, Baster K, Delpech VC, et al. No time to wait: how many HIV-infected homosexual men are diagnosed late and consequently die? (England and Wales, 1993–2002). AIDS 2005;19:513–20. [DOI] [PubMed] [Google Scholar]
- [10].Lundgren JD, Babiker AG, et al. Insight Start Study Group. Initiation of antiretroviral therapy in early asymptomatic HIV infection. N Engl J Med 2015;373:795–807. [DOI] [PMC free article] [PubMed] [Google Scholar]
- [11].Danel C, Moh R, et al. TEMPRANO ANRS 12136 Study Group. A trial of early antiretrovirals and isoniazid preventive therapy in Africa. N Engl J Med 2015;373:808–22. [DOI] [PubMed] [Google Scholar]
- [12].World Health Organization. Guideline on when to start antiretroviral therapy and on pre-exposure prophylaxis for HIV. Geneva: World Health Organization; 2015. Available at: http://www.who.int/hiv/pub/guidelines/earlyrelease-arv/en/. Accessed October 18, 2018. [Google Scholar]
- [13].Palella FJ, Jr, Baker RK, Moorman AC, et al. Mortality in the highly active antiretroviral therapy era: changing causes of death and disease in the HIV outpatient study. J Acquir Immune Defic Syndr 2006;43:27–34. [DOI] [PubMed] [Google Scholar]
- [14].Krentz HB, Kliewer G, Gill MJ. Changing mortality rates and causes of death for HIV-infected individuals living in Southern Alberta, Canada from 1984 to 2003. HIV Med 2005;6:99–106. [DOI] [PubMed] [Google Scholar]
- [15].Crum NF, Riffenburgh RH, Wegner S, et al. Comparisons of causes of death and mortality rates among HIV-infected persons: analysis of the pre-, early, and late HAART (highly active antiretroviral therapy) eras. J Acquir Immune Defic Syndr 2006;41:194–200. [DOI] [PubMed] [Google Scholar]
- [16].Sackoff JE, Hanna DB, Pfeiffer MR, Torian LV. Causes of death among persons with AIDS in the era of highly active antiretroviral therapy: New York City. Ann Intern Med 2006;145:397–406. [DOI] [PubMed] [Google Scholar]
- [17].Weber R, Ruppik M, Rickenbach M, et al. Swiss HIV Cohort Study (SHCS). Decreasing mortality and changing patterns of causes of death in the Swiss HIV Cohort Study. HIV Med 2013;14:195–207. [DOI] [PubMed] [Google Scholar]
- [18].Ministry of Health, Singapore. Update on the HIV/AIDS situation in Singapore 2019; 2020. Available at: https://www.moh.gov.sg/resources-statistics/infectious-disease-statistics/hiv-stats/update-on-the-hiv-aids-situation-in-singapore-2019-(june-2020). Accessed December 6, 2020. [Google Scholar]
- [19].Tey JS, Ang LW, Tay J, et al. Determinants of late-stage HIV disease at diagnosis in Singapore, 1996 to 2009. Ann Acad Med Singap 2012;41:194–9. [PubMed] [Google Scholar]
- [20].Ang LW, Tey SH, James L. Determinants of late-stage human immunodeficiency virus infection at first diagnosis. Singap Epidemiol News Bull 2008;34:47–50. [Google Scholar]
- [21].Ministry of Health, Singapore. Infectious Diseases Act. Available at: https://www.moh.gov.sg/policies-and-legislation/infectious-diseases-act. Accessed August 31, 2020. [Google Scholar]
- [22].Benichou J. A review of adjusted estimators of attributable risk. Stat Methods Med Res 2001;10:195–216. [DOI] [PubMed] [Google Scholar]
- [23].Rockhill B, Newman B, Weinberg C. Use and misuse of population attributable fractions. Am J Public Health 1998;88:15–9. [DOI] [PMC free article] [PubMed] [Google Scholar]
- [24].Smith C, Sabin CA, Lundgren JD, et al. Data collection on adverse events of anti-HIV drugs (D:A:D) Study Group. Factors associated with specific causes of death amongst HIV-positive individuals in the D:A:D Study. AIDS 2010;24:1537–48. [DOI] [PubMed] [Google Scholar]
- [25].Hernando V, Perez-Cachafeiro S, Lewden C, et al. All-cause and liver-related mortality in HIV-positive subjects compared to the general population: differences by HCV co-infection. J Hepatol 2012;57:743–51. [DOI] [PubMed] [Google Scholar]
- [26].Choy CY, Ang LW, Ng OT, Leo YS, Wong CS. Factors associated with hepatitis B and C co-Infection among HIV-infected patients in Singapore, 2006–2017. Trop Med Infect Dis 2019;4:pii:E87. [DOI] [PMC free article] [PubMed] [Google Scholar]
- [27].Rubin MS, Colen CG, Link BG. Examination of inequalities in HIV/AIDS mortality in the United States from a fundamental cause perspective. Am J Public Health 2010;100:1053–9. [DOI] [PMC free article] [PubMed] [Google Scholar]
- [28].Chadborn TR, Delpech VC, Sabin CA, Sinka K, Evans BG. The late diagnosis and consequent short-term mortality of HIV-infected heterosexuals (England and Wales, 2000–2004). AIDS 2006;20:2371–9. [DOI] [PubMed] [Google Scholar]
- [29].Chkhartishvili N, Sharvadze L, Chokoshvili O, et al. Mortality and causes of death among HIV-infected individuals in the country of Georgia: 1989–2012. AIDS Res Hum Retroviruses 2014;30:560–6. [DOI] [PMC free article] [PubMed] [Google Scholar]
- [30].Montlahuc C, Guiguet M, Abgrall S, et al. Impact of late presentation on the risk of death among HIV-infected people in France (2003–2009). J Acquir Immune Defic Syndr 2013;64:197–203. [DOI] [PubMed] [Google Scholar]
- [31].Sobrino-Vegas P, Garcia-San ML, Caro-Murillo AM, et al. Delayed diagnosis of HIV infection in a multicenter cohort: prevalence, risk factors, response to HAART and impact on mortality. Curr HIV Res 2009;7:224–30. [DOI] [PubMed] [Google Scholar]
- [32].Chen L, Pan X, Ma Q, et al. HIV cause-specific deaths, mortality, risk factors, and the combined influence of HAART and late diagnosis in Zhejiang, China, 2006–2013. Sci Rep 2017;7:42366. [DOI] [PMC free article] [PubMed] [Google Scholar]
- [33].Chua AC, Leo YS, Cavailler O, et al. Opt-out of voluntary HIV testing: a Singapore hospital's experience. PLoS One 2012;7:e34663. [DOI] [PMC free article] [PubMed] [Google Scholar]
- [34].Tan XQ, Goh WP, Venkatachalam I, et al. Evaluation of a HIV voluntary opt-out screening program in a Singapore hospital. PLoS One 2015;10:e0116987. [DOI] [PMC free article] [PubMed] [Google Scholar]
- [35].Ruffieux Y, Lemsalu L, Aebi-Popp K, et al. Swiss HIV Cohort Study and the Swiss National Cohort. Mortality from suicide among people living with HIV and the general Swiss population: 1988–2017. J Int AIDS Soc 2019;22:e25339. [DOI] [PMC free article] [PubMed] [Google Scholar]
- [36].UNAIDS. Confronting discrimination: overcoming HIV-related stigma and discrimination in health-care settings and beyond; 2017. Available at: https://www.unaids.org/en/resources/documents/2017/confronting-discrimination. Accessed November 11, 2019). [Google Scholar]
- [37].Fontela C, Aguinaga A, Moreno-Iribas C, et al. Trends and causes of mortality in a population-based cohort of HIV-infected adults in Spain: comparison with the general population. Sci Rep 2020;10:8922. [DOI] [PMC free article] [PubMed] [Google Scholar]
- [38].Sabin CA. Do people with HIV infection have a normal life expectancy in the era of combination antiretroviral therapy? BMC Med 2013;11:251. [DOI] [PMC free article] [PubMed] [Google Scholar]
- [39].Grabar S, Weiss L, Costagliola D. HIV infection in older patients in the HAART era. J Antimicrob Chemother 2006;57:04–7. [DOI] [PubMed] [Google Scholar]
- [40].Centers for Disease Control and Prevention (CDC). Revised surveillance case definition for HIV infection--United States. MMWR Recomm Rep 2014;63:01–10. [PubMed] [Google Scholar]
- [41].Lee VJM. Where are we with 90-90-90 in Singapore? Webinar 2: Update on HIV Treatment and Cure. Panel presentation at the 12th Singapore AIDS Conference, 5 December 2020. Available at: https://afa.org.sg/whatwedo/advocate/sac-12th-2020. Accessed December 18, 2020. [Google Scholar]