

Abstract
The dorsolateral prefrontal cortex (dlPFC) plays a critical role in spatial working memory and its activity predicts behavioral responses in delayed response tasks. Here, we addressed if this predictive ability extends to other working memory tasks and if it is present in other brain areas. We trained monkeys to remember the location of a stimulus and determine whether a second stimulus appeared at the same location or not. Neurophysiological recordings were performed in the dorsolateral prefrontal cortex and posterior parietal cortex (PPC). We hypothesized that random drifts causing the peak activity of the network to move away from the first stimulus location and toward the location of the second stimulus would result in categorical errors. Indeed, for both areas, in nonmatching trials, when the first stimulus appeared in a neuron’s preferred location, the neuron showed significantly higher firing rates in correct than in error trials; and vice versa, when the first stimulus appeared at a nonpreferred location, activity in error trials was higher than in correct. The results indicate that the activity of both dlPFC and PPC neurons is predictive of categorical judgments of information maintained in working memory, and neuronal firing rate deviations are revealing of the contents of working memory.
Keywords: monkey, neurophysiology, parietal cortex, prefrontal cortex, working memory
Introduction
Working memory, the ability to maintain and manipulate information over a time span of seconds, is a core component of higher cognitive functions (Baddeley 2012). Neurophysiological experiments in the prefrontal cortex of nonhuman primates identified neurons that remain active during a period of seconds over which a stimulus is maintained in memory (Fuster and Alexander 1971; Funahashi et al. 1989). This “persistent activity” is thought to be maintained through recurrent connections in a network of neurons (Chaudhuri and Fiete 2016; Zylberberg and Strowbridge 2017). Individual neurons exhibiting persistent activity are selective for the properties of stimuli held in memory (Qi and Constantinidis 2013) and trials in which persistent activity is diminished are more likely to result in errors (Funahashi et al. 1989; Zhou et al. 2013). It is therefore believed that persistent discharges constitute the neural correlate of working memory (Constantinidis and Klingberg 2016).
In recent years, the neural mechanisms of working memory have come under debate (Constantinidis et al. 2018; Miller et al. 2018). Short-term synaptic changes and rhythmic bursts in the gamma frequency range have been proposed as the main mechanisms of working memory generation (Stokes 2015; Lundqvist et al. 2016). Perhaps the strongest argument in favor of the persistent discharge model is that variations in persistent activity during the delay interval of working memory tasks are strongly predictive of behavior (Riley and Constantinidis 2016). For example, persistent activity recorded from trials in which monkeys made eye movements deviating clockwise versus counterclockwise relative to the true location of the stimulus yields slightly different tuning curves, as would be expected if the location recalled was determined by the peak of activity at the end of the delay period in a bump attractor network (Wimmer et al. 2014; Barbosa et al. 2019). Nonetheless, such results may be interpreted as suggestive of motor preparation rather than working memory itself (Lundqvist et al. 2018).
At the same time, the site of memory maintenance has come under debate. Functional magnetic resonance imaging (fMRI) studies have been successful in decoding information held in memory from the visual cortex (Harrison and Tong 2009; Albers et al. 2013; Ester et al. 2013; Xing et al. 2013; Sreenivasan et al. 2014b). Visual cortical areas rather than the prefrontal cortex have been thus suggested as the site of information maintenance (Sreenivasan et al. 2014a; Christophel et al. 2017). Activation of the posterior parietal cortex in fMRI studies has also shown to best predict individual working memory capacity (Todd and Marois 2004, 2005).
We were thus motivated to test 2 basic tenets of current working memory models. First, we devised a novel working memory task, allowing us to determine if the variability of persistent discharges in the prefrontal cortex is predictive of working memory behavior in a task that dissociates stimulus maintenance from motor preparation. Secondly, we wished to ascertain if such a relationship is exclusive to the prefrontal cortex, or is also present in a more posterior cortical region implicated in spatial working memory, the posterior parietal cortex (Constantinidis et al. 2013).
Materials and Methods
Two male rhesus monkeys (Macaca mulatta) weighing 9–12 kg were used in these experiments. Neural recordings were carried out in areas 8 and 46 of the dorsolateral prefrontal cortex and areas 7a and lateral intraparietal area (LIP) of the posterior parietal cortex. All experimental procedures followed guidelines by the US Public Health Service Policy on Humane Care and Use of Laboratory Animals and the National Research Council’s Guide for the Care and Use of Laboratory Animals and were reviewed and approved by the Wake Forest University Institutional Animal Care and Use Committee.
Experimental Setup
Monkeys sat in a primate chair with their head fixed while viewing a liquid crystal display monitor positioned 68 cm away from their eyes with dim ambient illumination. Animals were required to fixate a 0.2° white square appearing in the center of the monitor screen. During each trial, animals had to maintain fixation on the square while visual stimuli were presented either at a peripheral location or over the fovea in order to receive a liquid reward. Any break of fixation immediately terminated the trial, and no reward was given. Eye position was monitored throughout the trial using a noninvasive, infrared eye position scanning system (model RK-716; ISCAN, Burlington, MA). The system achieved a <0.3° resolution around the center of vision. Eye position was sampled at 240 Hz, digitized, and recorded. Visual stimuli display, monitoring of eye position, and the synchronization of stimuli with neurophysiological data were performed with in-house software (Meyer and Constantinidis 2005) implemented on the MATLAB environment (Mathworks, Natick, MA).
Task and Stimuli
Monkeys were trained to perform the oculomotor delayed response (ODR) task (Fig. 1A,B) and the Match-Stay Nonmatch-Go (MSNG) task (Fig. 1C,D). During recording days, the session started with an ODR task, which allowed us to determine the presence of neurons that responded during the delay period and the approximate location of their receptive fields. The MSNG task followed. Based on estimated best neuronal responding location, we determined the locations of stimuli used in the MSNG task; however, recordings were obtained from neurons at multiple electrodes, and the stimulus location could appear anywhere relative to a neuron’s receptive field.
Figure 1 .
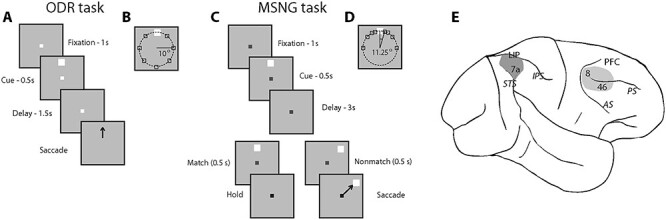
Tasks and areas for neurophysiological recordings. (A) Frames represent the sequence of events during the ODR task. The monkey is required to observe a cue stimulus, maintain fixation during delay period, and make eye movement to the remembered location of the visual cue once the fixation point disappears. (B) Possible locations of visual stimuli on the screen in the ODR task. (C) The sequence of events in the MSNG task. The monkey is required to observe the first cue and maintain fixation during the delay period. Then another visual stimulus appears, and a monkey needs to determine if it appeared at the same location as the cue. If 2 visual stimuli appeared at the same location (they match), the monkey needs to stay at the fixation point, after its color changes. If the location of the second stimulus deviates from the first (nonmatch), the monkey is required to make an eye movement to the (visible) second stimulus once the color of fixation point switches. (D) Possible locations of visual stimuli presentation on the screen in the MSNG task. White square represents the reference stimulus, around which all other stimuli are presented in a daily session. The reference stimulus appeared at different locations in different sessions, typically at the flank of the neuron’s tuning curve. (E) Regions of neurophysiological recordings, including areas 8 and 46 in dlPFC and areas 7a and LIP in PPC. IPS, intraparietal sulcus; STS, superior temporal sulcus.
The ODR task required monkeys to remember the spatial location of a 1° white cue stimulus displayed on a screen for 0.5 s and after a delay period of either 1.5 or 3 s, to make a saccade to its remembered location (Fig. 1A). Stimuli could appear at any of 8 locations arranged on an (invisible) circle of 10 degrees of visual angle eccentricity (Fig. 1B), and the monkeys were required to make an eye movement to the remembered location of the cue within 0.6 s to receive a liquid reward. Correct responses were considered those in which the saccadic end point deviated no more than 5–6° from the center of the stimulus (3–4° from the edge of the stimulus), and the monkey held fixation within this window for 0.1 s.
The MSNG task required the monkeys to remember the location of the cue presented in the same fashion, but after a 3 s delay period, a second stimulus appeared, either at the identical location (match) or a different location (nonmatch, Fig. 1C). After 500 ms, the fixation point changed color, and if the second stimulus was a match, the monkey was required to maintain fixation; if the second stimulus was a nonmatch, the monkey was required to make a saccade toward this visible stimulus. The monkeys received a liquid reward for a correct response. Trials were aborted if the monkey’s gaze exited a 4° fixation window; however, such aborted trials were not included in the analysis of correct and error trials. In each daily session, the cue could appear pseudo-randomly at 1 of 9 possible locations (Fig. 1D). Possible cue locations included a reference location (white square in Fig. 1D) and 8 locations deviating from the reference location by an angular distance of 11.25, 22.5, 45, and 90°, clockwise and counterclockwise. The cue was followed by a matching stimulus appearing at the same location as the cue in approximately half the trials (9/17 conditions) or by a nonmatch stimulus, which could only appear at the reference location (8/17 conditions). Match and nonmatch trials were interleaved within one session. The reference location varied from session to session. During the course of the recording session, we tried to select a reference location that appeared at the flank of the tuning curve of neurons under study, based on their responses in the ODR task, which preceded the MSNG task. However, multiple neurons were recorded in each session, and the location of the reference stimulus could not be optimized for all at the same time. Therefore, in practice, the reference location could appear at any position relative to the neuron’s tuning curve, and this determination was made post hoc. All stimuli were presented at an eccentricity of 10 degrees of visual angle, as in the ODR task. During training, other relative locations of cue and nonmatch stimuli were also displayed to ensure that the monkey understood the rule and could perform the task for any combination of stimuli.
Surgery and Neurophysiology
Two 20-mm diameter craniotomies were performed over the lateral prefrontal cortex and the posterior parietal cortex, and a recording cylinder was implanted over each site’s right hemisphere, respectively. The location of the cylinder was visualized with anatomical magnetic resonance imaging (MRI) and stereotaxic coordinates postsurgery. Neurophysiological recordings were obtained, as we have described before (Zhou et al. 2016b). Briefly, we used tungsten-coated electrodes with a 200 or 250 μm diameter and 4 MΩ impedance at 1 kHz (FHC, Bowdoinham, ME). Arrays of up to 4-microelectrodes spaced 0.5-1 mm apart were advanced into the cortex with a Microdrive system (EPS drive, Alpha-Omega Engineering) through the dura into the cortex. The signal from each electrode was amplified and band-pass filtered between 500 Hz and 8 kHz while being recorded with a modular data acquisition system (APM system, FHC, Bowdoin, ME). Waveforms that exceeded a user-defined threshold were sampled at 25 μs resolution, digitized, and stored for off-line analysis.
Anatomical Localization
Neural recordings were performed in 2 cortical areas, the dorsolateral prefrontal cortex and the posterior parietal cortex (Fig. 1E). Prefrontal recordings included areas 46 and 8 containing the caudal part of both banks of the principal sulcus (PS), and the area between the PS and the arcuate sulcus (AS). Posterior parietal recordings encompassed area 7a and LIP, which is directly connected to the dorsolateral prefrontal cortex (Cavada and Goldman-Rakic 1989). During the experimental sessions, the travel distance of electrodes before entering the cortex allowed us to map the sulcal pattern of each cylinder and provided a coarse map of anatomical location. Upon completion of the experiments, the anatomical location of electrode penetration was recorded onto an image of cortical surface obtained through previous magnetic resonance imaging.
Behavioral Data Analysis
All analysis of behavioral (and neural) data was performed in the MATLAB environment (Mathworks, Natick, MA, version 2012a-2019). We expressed the correct performance in the ODR task and the MSNG task as the percentage of trials that resulted in correct responses. Some trials were aborted early due to breaks in fixation, blinks, or premature saccades, before the fixation point changed color. These trials were ignored in performance estimation. We additionally calculated d′ (sensitivity index) defined as d′ = Z(hit rate) − Z(false alarm rate), where Z(x) is the inverse of the cumulative distribution function of the Gaussian distribution. The d′ value was calculated on a session-by-session basis, based on the MATLAB norminv function. Hit rate in this context represents the percentage of correct detections of nonmatch trials, and false alarm the error rate in match trials that the monkey incorrectly perceived as nonmatch trial and made a saccade toward the second stimulus.
Neural Data Analysis
Recorded spike waveforms were sorted into separate units using a semi-automated cluster analysis process relying on the KlustaKwik algorithm (Harris et al. 2000), which classified all waveforms into clusters, and then grouped into units (and noise) in a second phase of analysis. Mean firing rate was then determined in each trial epoch of each unit. To ensure the stability of firing rate in the recordings analyzed, we identified recordings in which a significant effect of trial sequence was evident on the baseline firing rate [analysis of variance{ANOVA}, P < 0.05], for example, due to a neuron disappearing or appearing during a run, as we were collecting data from multiple electrodes. Data from these sessions were truncated so that analysis was only performed on a range of trials with stable firing rate.
We identified task-related neurons as those with firing rates during the first stimulus presentation or delay period that were higher compared with the 1 s fixation period preceding it, based on a paired t-test, evaluated at the P < 0.05 level. Population discharge rates were evaluated by averaging activity from multiple neurons and constructing peristimulus time histograms (PSTH). These were constructed using the best stimulus responses for each neuron. PSTHs were aligned to the cue presentation and averaged responses for each stimulus set and brain region.
Correct and error conditions were compared for nonmatch trials in which the cue stimulus appeared at a location that corresponded to a higher firing rate than the second stimulus location based on the neuron’s tuning curve (preferred cue). As mentioned in the description of the MSNG task, above, the location of the cue (and match) varied across conditions, whereas the location of the nonmatch stimulus was fixed. It was possible, therefore, to identify trials in which the cue appeared at a more preferred location than the nonmatch location. Firing rate was also compared for trials in which the cue stimulus appeared at a location that corresponded to a lower firing rate than the second stimulus location (nonpreferred cue). This determination was done separately for each neuron. A minimum of 2 error trials in each condition was required for a neuron to be included in this comparison, and not all neurons were used for all conditions, resulting in a slightly different sample size for each test.
In order to quantify the trial-to-trial association between perceptual choice and neuronal activity, we analyzed trials that resulted in correct choices and incorrect choices in the MSNG task using receiver operating characteristic (ROC) analysis based on signal detection theory (Britten et al. 1996; Mendoza-Halliday et al. 2014). Firing rates of trials involving the same sequences of stimuli were pooled separately for correct and error outcomes. A ROC curve was computed from these 2 distributions of firing rates. The area under the ROC curve thus constructed is referred to in the perceptual inference literature as “choice probability” and represents a measure of correlation between the behavioral choice and neuronal activity. A value of 1 indicates that there is a perfect correlation between the behavioral choices and the neuronal discharge rates; a value of 0.5 indicates no correlation between the two. Time-resolved choice probabilities were computed from the spikes in 500 ms time windows, stepped by 50 ms intervals. This analysis was done separately for the preferred and nonpreferred cue conditions. Results from all available neurons were averaged together to produce population responses.
A population vector analysis (Georgopoulos et al. 1986) was used to determine the location represented by neural activity in correct and error trials. The population vector PV, for cue location c, was defined as: where PD is the preferred direction of neuron i, determined based on a cosine fit, and w is the weighted discharge rate of neuron i, for location c, defined as follows, for each neuron:
  . Here, FRc is the mean firing rate during the entire delay period following cue appearance at location c; FRbase is the baseline firing rate of this neuron, determined based on the cosine fit (approximately the mean of the delay period firing rate across all cue locations); and FRrange is the half range of its activity:
  , where the maximum and minimum firing rate across locations were determined based on the cosine fit.
Results
Behavioral Performance
Two monkeys were trained to perform the ODR and a novel, MSNG task (Fig. 1). The MSNG task required monkeys to observe and remember a visual cue and, after a 3 s delay period, observe a second cue and compare its location to the remembered location of the first visual cue. If the 2 stimuli were displayed at the same location, they defined as a Match trial and the monkey should hold fixation (stay). If the locations of 2 visual cues differed from each other, they defined as a nonmatch trial and the monkey was required to make an eye movement to the second stimulus, which remained visible at the screen at that point (go). The monkeys were rewarded for all correct stay or go responses. Trials were aborted immediately if the monkey made a premature eye movement. Stimuli were displayed at 9 possible locations, deviating from a reference cue (shown in white in Fig. 1D) by 11.25, 22.5, 45 or 90°, clockwise and counterclockwise. Match trials involved successive presentation of 2 stimuli at any of these 9 locations. Nonmatch trials involved presentation of the first stimulus at one of the 8 locations around the reference location, and the second stimulus always at the reference location. The reference location changed from session to session. During training, the monkeys were exposed to other combinations of match and nonmatch location so that they mastered the rule regardless of first and second stimulus location. The MSNG task includes all components of the ODR task (cue presentation, delay period, saccade); however, the monkey’s response is categorical, and the saccade is always directed to the same location. As such, it allowed us to dissociate activity representing the location of the cue, which varied between conditions, from motor preparation, which was always the same, and independent of the location of the cue.
Recordings commenced once each monkey reached asymptotic performance and no further consistent improvement was observed. The 2 monkeys (KE and LE) performed a total of 43 078 complete (nonaborted) trials during recording sessions. In nonmatch trials, performance increased monotonically as a function of increasing angular distance between the first and second stimulus (Fig. 2A,B). In other words, the further away from the second stimulus was from the first, the more likely that the animal perceived the location of the second stimulus as different from the remembered location of the first stimulus. For stimuli separated by 11.25, 22.5, 45, and 90°, mean performance across daily sessions for monkey KE was 62, 71, 86, and 87%, respectively (Fig. 2A); for monkey LE 54, 66, 78, and 85%, respectively (Fig. 2B). Performance in match trials was intermediate (KE, 82%; LE 79% correct responses). Performance was also expressed as a sensitivity index (d′), which provides the separation between means of the signal and the noise distribution, in this case the correct detections of nonmatch and false alarms of match trials perceived as nonmatch. A monotonic increase in sensitivity index was observed with larger angular distance between 2 stimuli. For monkey KE that was 1.27, 1.56, 2.03, and 2.12, for the first 4 separations respectively (Fig. 2C); for monkey LE, 0.92, 1.24, 1.62, and 1.84, respectively (Fig. 2D).
Figure 2 .
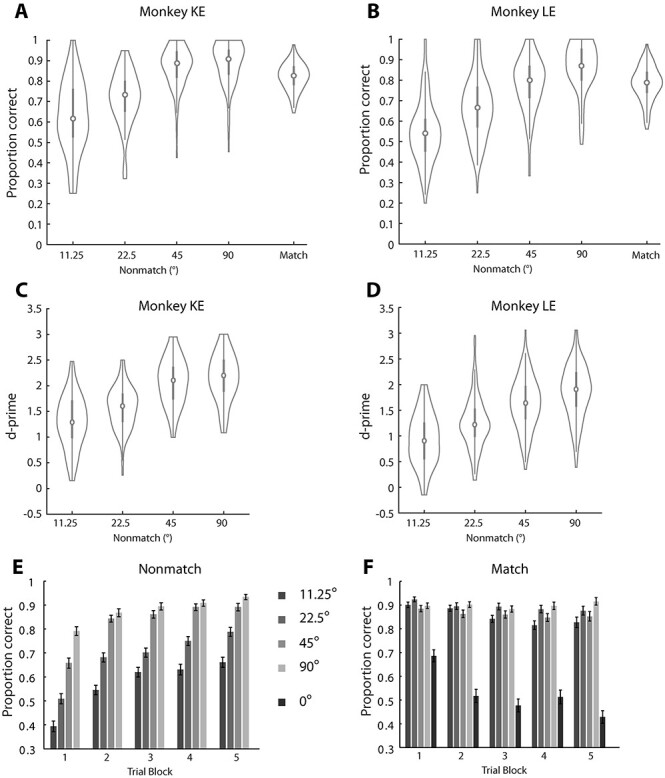
Behavioral performance. (A) The performance of monkey KE in the MSNG task, during neural recording sessions (n = 82). Proportions of correct trials for nonmatch trials are plotted as a function of the angular distance between the 2 consecutive stimuli. Performance in Match trials is also plotted for comparison. The estimate of performance excludes trials aborted before the color of fixation switched due to breaks in fixation. The median (circle) and interquartile difference (gray vertical line) are indicated in the plot. Vertical extent of violin plot demarks the entire distribution of behavioral performance of daily sessions and indicates density trace of the distribution at each performance level. (B) Behavioral performance for monkey LE in the MSNG task (n = 132) plotted as in A. (C) Sensitivity index (d-prime) for monkey KE, calculated based on the correct detections of nonmatch stimuli and false reports of match stimuli as nonmatches. Sensitivity measures are plotted for different angular distances between the 2 consecutive stimuli. Each colored dot represents the d-prime value calculated in a single session. (D) As in C, sensitivity index for monkey LE in the MSNG task. (E) Average performance across daily sessions for nonmatch trials is plotted as a function of successive blocks of 40 trials. For each block, different bars represent the distance between the cue and reference stimulus. (F) Performance for match trials. Only for match trials is it possible for the first stimulus to appear at the reference location.
Monkeys are generally very sensitive to stimulus statistics, and we noted that performance improved between the first and second block of approximately 40 trials, when they had, presumably, learned what the reference location was for the session (Fig. 2E). However, performance always depended on the relative location between the first and second stimulus. Even for the fifth block of 40 trials (the last one for which sufficient trials were collected across sessions) performance depended on the distance between the first and second stimulus (1-way ANOVA, F3,573 = 50.4, P = 6.55 × 10⁻²⁹). Additionally, performance in match trials declined in successive blocks (Fig. 2F). The result suggests that the nominal improvement in performance in nonmatch trials may have been partly due to an increasing bias toward nonmatch choices (higher tendency to generate saccades) as the session progressed. Lower performance was observed for the match condition appearing at the 0° reference location. A second stimulus appearing at this location had an 8-fold higher likelihood of being a nonmatch than a match, and the animals’ behavior reflected that. These results indicate that the monkeys maintained the location of the stimulus in working memory to perform the task; however, their judgment was also influenced by the absolute location of the second stimulus, after the end of the delay period. We base our analysis of neural responses, below, primarily on error nonmatch trials, when the animals erroneously judged the second stimulus as having appeared at the same location as the first, despite any advantage they may have derived from these strategies to avoid such an error.
Task-Related Neuronal Responses
Neuronal activity was recorded from areas 8 and 46 of the dorsolateral prefrontal cortex (PFC) and areas 7a and LIP of the posterior parietal cortex (PPC). Responses were recorded from 144 neurons in PFC (49 in subject KE, and 95 in subject LE) and 145 neurons in the PPC (44 in subject KE, and 101 in subject LE) that exhibited significantly elevated responses in the first cue period or the delay period in the MSNG task, compared with the baseline activity (paired t-test, P < 0.05). These neurons formed the dataset used for further analysis. Averaged, population responses are shown in Figure 3 for the best cue (Fig. 3A) and best delay period activity of each neuron relative to the baseline (Fig. 3B). Most of these neurons also exhibited significant responses in the ODR task. The activity of neurons with significant responses in the ODR task is shown in Figure 3C,D. Errors were rare in the ODR task, and we collected only a small number of trials in this task, mostly to aid in identifying neurons with delay period activity, during the experiment. The analysis that follows focuses exclusively on the MGNS task.
Figure 3 .
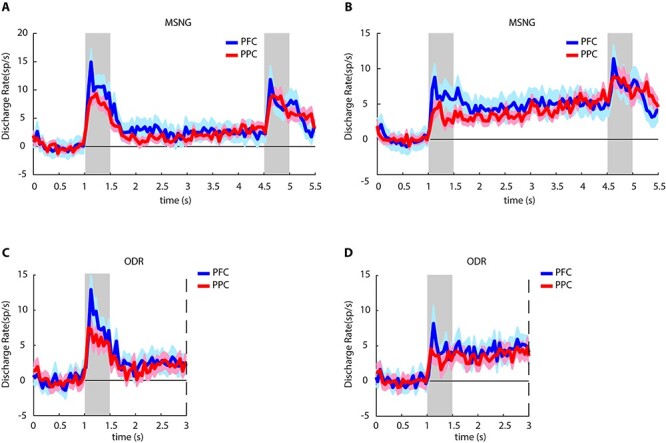
Neural activity in working memory tasks. (A) Average, evoked population peristimulus time histogram in the MSNG task, for the best cue period stimulus location of each neuron. Evoked firing rates, after subtracting the baseline firing rate computed in the 1 s fixation period, have been plotted. Neurons that showed significantly elevated responses during the cue presentation or delay period of the MSNG task are included (PFC n = 144; PPC n = 145). Gray bars indicate the presence of visual stimuli in the MSNG task; shaded area represents standard error of mean (SEM). (B) Average, evoked population peristimulus time histogram in the MSNG task, for the best delay period of each neuron. Same group of neurons are plotted, as in A. (C) Average, evoked population peristimulus time histogram in ODR task for the best cue period stimulus location of each neuron. Evoked firing rates relative to the baseline firing rate have been plotted. Neurons that showed significantly elevated responses during the cue presentation or delay period of the ODR task are included (PFC n = 79; PPC n = 120). Gray bar represents the presentation of the visual cue in the ODR task. Dashed line indicates the endpoint of the minimum duration delay period (1.5 s); some neurons were tested with longer delay period. (D) Average, evoked population peristimulus time histogram in ODR task for the best delay period of each neuron. Same group of neurons are plotted, as in C.
Neuronal Responses in Correct and Error Trials
We wished to examine if deviations of firing rate during the delay period of the task in the 2 areas were predictive of categorical errors about the remembered location of the stimulus. The rationale for our analysis is illustrated in Figure 4. Activity in the population of neurons that determines working memory behavior can be envisioned as a bump (peak) of activity centered in those neurons that are most activated by the stimulus. The simulation of such a network of recurrent connections revealed that the network behaves as a continuous attractor maintaining the position of the stimulus during the absence of the visual cue (Constantinidis and Klingberg 2016). This bump is expected to drift randomly during the delay period (Wimmer et al. 2014). The position of the bump at the end of the delay period will determine the location that the subject is actually recalling, and if it is judged to differ from the location of the second stimulus or not (Fig. 4A). In a brain area that does not directly influence what the subject recalls, the drift of such activity would be relatively uncorrelated with the behavioral outcome of the trial.
Figure 4 .
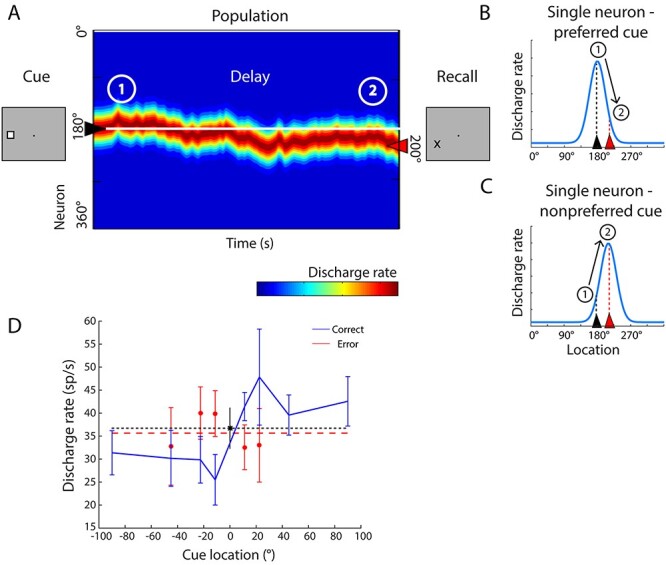
Neural activity during the working memory task. (A) Schematic depiction of population neural activity in the neural network representing spatial working memory. Neurons with peak responses at different stimulus locations (indicated as 0–360 degrees) are arranged along the y-axis of the color plot. The x-axis represents time. When the cue appears at the left to the fixation point in the screen (location 180), neurons with peak responses around this location are maximally activated creating a bump of activity in the network. After the cue is no longer present, the population of neurons maintains persistent discharges; however, the bump drifts during the delay period, due to random noise. At the end of the delay period, the location that the subject remembers is determined by the location of the bump in the network, shown here to have drifted counterclockwise (toward the 200 degree location). If a second (nonmatch) stimulus in the MSNG were to appear at that location, the subject would be expected to incorrectly report it as a match. (B) Schematic depiction of changes in neuronal activity at the level of a single neuron with peak response at 180 degrees is shown, for the same sequence of events represented in panel A. At time point 1, shortly after the cue appearance, the neuron is activated maximally as the bump of population responses is centered at 180 degrees. At time point 2, the bump has drifted toward 200 degrees. The neuron’s level of activity, described by its tuning function, is expected to decline. In other words, a neuron is expected to exhibit lower firing rate in error trials than in correct, when the cue appeared at the peak of its tuning function and a nonmatch stimulus followed at its tail. (C) Schematic depiction of changes in firing rate for a different neuron, with a tuning function peak at 200 degrees. At time point 1, this neuron is activated moderately. However, as the bump of the activity drifts toward its peak, at the time point 2, its firing rate has increased. A neuron is expected to exhibit higher firing rate in error trials than in correct when the first cue appeared at a location other than the preferred location and a nonmatch stimulus at a more preferred location. (D) Firing rate of a single PFC neuron in the delay period involving appearance of the cue at different locations, indicated in the x-axis. The second, nonmatch, stimulus always appears at location 0. Mean firing rate in correct trials (and SEM) is indicated by the blue line; rate in error trials is indicated by the red line. Firing rate in correct trials with the cue at the 0 location (which were followed by a match stimulus) is indicated by the black point; a horizontal line through it is plotted for easy comparison with other locations. Mean firing rate across all nonmatch error trials are indicated by the dashed line.
The model allows us to test predictions at the level of single neurons. If the first stimulus activates a neuron at the peak of its tuning curve, then drifts of the bump that led into errors will be associated with lower levels of activity for this neuron (Fig. 4B). Therefore, if a cue stimulus appeared at the neuron’s preferred location (180° in Fig. 4B), followed by a second stimulus at a less preferred location (200° in Fig. 4B), and the monkey incorrectly judged this second stimulus as a match, we would expect that the neuron’s activity levels would be lower relative to correct trials. We should note that drift is also possible in the opposite direction, toward the 160° location in this example. However, such drift would tend to exaggerate the apparent dissimilarity between the cue and nonmatch stimulus and increase the probability of the monkey reporting this as a nonmatch. In this sense, our analysis is conservative: firing rate in correct trials is the average of trials in which activity did not drift appreciably plus activity where it drifted to a lower level for the neuron under study, in the opposite direction of the bump. For a neuron for which the original stimulus appeared at the tail of its tuning curve, followed by the second stimulus at the peak (Fig. 4C), we would expect that the neurons’ activity levels would be higher when the subject incorrectly judged the stimulus as a match, compared with correct trials. Importantly, these predictions hold only for neurons in a cortical area that maintains the working memory trace that is read out to determine the categorical judgment. We thus compared the responses of prefrontal and parietal neurons in correct and error trials representing such conditions.
An important point for the analysis is that the model predictions do not depend on the shape of the turning curve, nor do they require it to be Gaussian-shaped over the tested range, such as those depicted schematically in Figure 4B,C. The tuning curve of a single neuron is shown in Figure 4D. The reference location is plotted at 0. Delay period firing rate is plotted in the ordinate, following appearance of the cue at each location indicated in the abscissa. The response of the first stimulus at the reference location is indicated by the black point (derived from match trials). We analyzed separately conditions for which the location of the second stimulus corresponded to a lower firing rate than the location of the first stimulus (those above the dotted line, which we refer as “preferred cues,” for simplicity). We also identified conditions for which the location of the second stimulus corresponded to a higher firing rate than the location of the cue stimulus (those below the black dotted line, which we refer to as “nonpreferred cues”). Our analysis did assume that the receptive field sizes of neurons encompassed more than one location, an assumption that was borne by the experimental data. The standard deviation of Gaussian fits for PFC neurons was 67.4° ± 33.8° and for PPC neurons 43.2° ± 17.0°.
Across the population of prefrontal neurons (Fig. 5A), firing rate in correct trials involving preferred cues was higher than in error trials, as the model predicted (Fig. 4B). This was also the case for the example neuron (Fig. 4D). A total of 111 PFC neurons with persistent activity in the delay period and error trials follow appearance of the cue at preferred locations in each neuron’s receptive field were available for this analysis. Not all conditions were available for all neurons, so the number of observations varied slightly for each comparison. Average firing rates during the last second of the delay period were 14.5 spikes/s in correct trials and 10.3 spikes/s in error trials (paired t-test, t110 = 4.59, P = 1.20 × 10⁻⁵), as indicated in Fig. 5A.
Figure 5 .
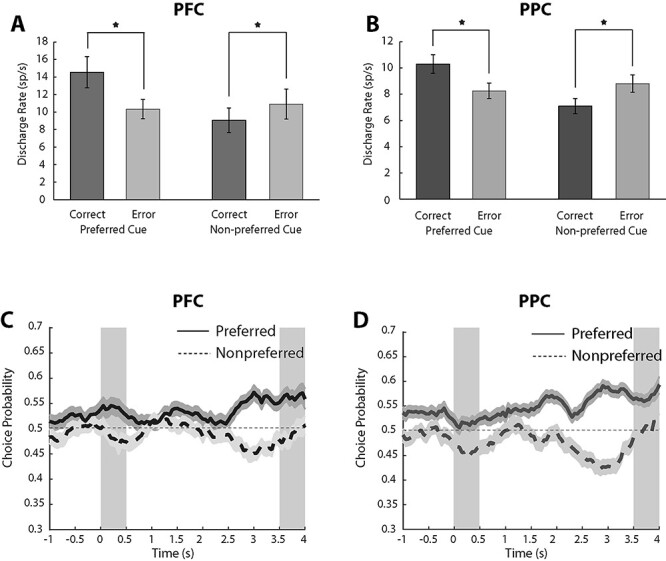
Neural activity in correct and error trials and ROC analysis. (A) Mean and SEM of firing rates in the last 1 s of the delay period for correct and error nonmatch trials among PFC neurons responsive to the task (n = 144). Responses are shown for nonmatch trials involving the cue stimulus presented at a location eliciting higher activity than the second stimulus for each neuron analyzed, indicated as preferred cue (first 2 bars). Correct and error trials are plotted separately and compared. Star indicates significant difference based on a paired t-test, evaluated at the 0.05 significance level. Responses are also shown for nonmatch trials involving the cue stimulus presented at a location eliciting lower activity than the second stimulus for each neuron analyzed, indicated as nonpreferred cue (second 2 bars). (B) As in A, for PPC neurons (n = 145). (C) Averaged area under the ROC curve from PFC neurons computed in a time resolved fashion and plotted as a function of time across the trial (n = 89 for preferred cue; n = 88 for nonpreferred cue condition). Solid line represents ROC value comparing the distribution of correct and error nonmatch trials, from the preferred cue condition; shaded area around it represents SEM. Dotted line represents ROC value comparing the distribution of correct and error nonmatch trials, from the nonpreferred cue condition (D) As in C, data are shown as averaged area under the ROC curve from PPC neurons in different conditions (n = 91 for preferred cue; n = 86 for nonpreferred cue condition).
Still, this was not a particularly strong prediction of the model, as error trials are likely to include some lapses, and it is well known that error trials typically elicit lower firing rates in the delay period of working memory tasks (Funahashi et al. 1989; Zhou et al. 2013). Most importantly, errors in which the cue appeared at nonpreferred locations elicited higher firing rates than correct trials, as predicted by the model (Fig. 4C). This can also be seen in the example neuron (Fig. 4D). A total of 108 PFC neurons with persistent activity in the delay period and error trials following the appearance of nonpreferred cues were available for this analysis. The average responses in the last second of the delay period were 9.1 spikes/s in correct trials and 10.9 spikes/in error trials (pair t-test, t107 = −3.26, P = 1.49 × 10⁻³). These results confirmed our expectation that the activity of prefrontal neurons during the delay period of the task determines what the subject recalls at the end of the trial (Fig. 5A). It was notable that the mean firing rate across all conditions that the subject reported the second stimulus to be a match (red dashed line in Fig. 4D) was almost identical to the true firing rate that the neuron elicited when the cue stimulus truly appeared in the match, reference location (black dotted line in Fig. 4D). The result was consistent across subjects. For the preferred cue condition, average responses in the last second of the delay period were significantly greater in correct than error trials in both animals (paired t-test, t33 = 3.35, P = 0.002; and t76 = 3.71, P = 0.0004 for the 2 monkeys, respectively). For the nonpreferred cue condition, activity in the last second of the delay period was greater in errors than in correct trials for both animals, though it only reached significance in subject LE, from which we had recorded a larger sample (paired t-test, t41 = −1.59, P = 0.12; and t65 = −2.99, P = 0.0039, for the 2 monkeys, respectively).
Essentially identical patterns of activity were also evident on the population responses of the posterior parietal cortex. Significantly higher responses were observed for correct trials when preferred than nonpreferred cues 10.3 versus 8.3 spikes/s, which constituted a significant difference, (paired t-test, t116 = 5.46, P = 2.75 × 10⁻⁷; Fig. 5B). Similarly, the average activity from the posterior parietal cortex for correct trials with nonpreferred cues was significantly lower than for error trials (7.1 spikes/s versus 8.8 spikes/s, paired t-test, t114 = −6.04, P = 1.98 × 10⁻⁸; Fig. 5B). We note that the difference between error and correct trials was detectable in the PPC, despite the lower overall elevated firing rate in parietal than prefrontal neurons (Fig. 3A,B). Results were consistent between subjects. For the preferred-cue condition, average responses in the last second of the delay period were greater in correct than error trials, in both animals, though the effect only reached significance for subject LE, from which we had recorded a larger sample size (paired t-test, t29 = 0.66, P = 0.51; and t86 = 5.90, P = 6.95 × 10⁻⁸, respectively). For the nonpreferred cue condition, activity in the last second of the delay period was significantly greater in errors than in correct trials for both animals (paired t-test, t37 = −3.40, P = 0.0016; and t76 = −4.96, P = 4.19 × 10⁻⁶, respectively).
Because this analysis represented averages across all neurons that may obscure the patterns of individual neurons, we further examined the phenomenon on a neuron-by-neuron basis, by plotting the neuronal firing rate we observed in each condition (Fig. 6). Each data point in Figure 6 represents the neuronal average firing rate during the last 1 s delay period in correct and error trials, in one condition. For preferred-cue trials, a total of 79% (88/111) PFC neurons exhibited higher firing rate in trials that the monkey correctly identified the second stimulus as a nonmatch, compared with the firing rate in which the monkey erroneously identified the second stimulus as a match (Fig. 6A). This proportion of neurons deviated significantly from a uniform distribution (χ2 test, P = 6.85 × 10⁻¹⁰). Among PPC neurons, a total of 83% (97/117) exhibited the same pattern of firing rates (Fig. 6C), which was also significantly different than a uniform distribution (χ2 test, P = 1.09 × 10⁻¹²). Conversely, when the cue appeared at a nonpreferred location, a total of 64% (69/108) PFC neurons exhibited lower firing rate for correct than for error trials (χ2 test, P = 3.89 × 10⁻³) in Fig. 6B as did 72% (83/115) PPC neurons (χ2 test, P = 1.98 × 10⁻⁶) in Fig. 6D. We conclude that the effect is highly consistent across neurons in both areas.
Figure 6 .
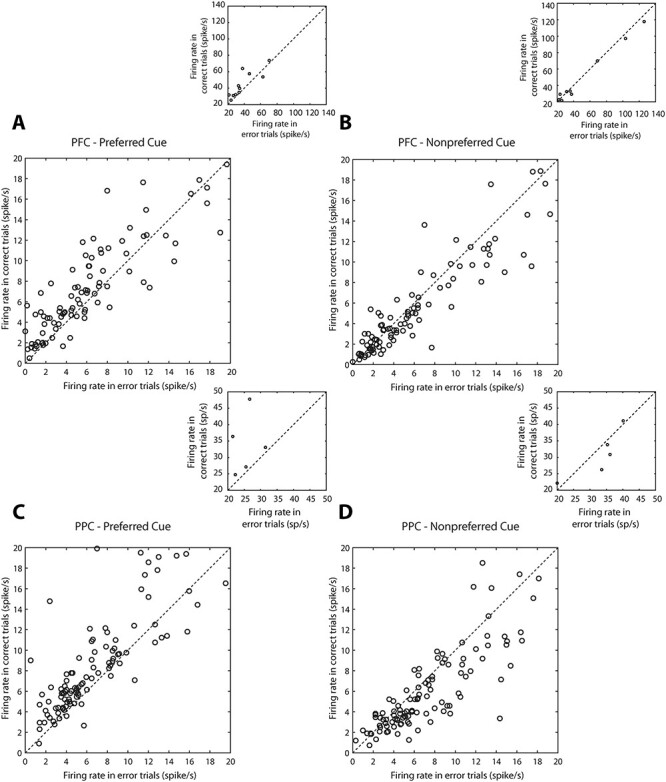
Distribution of neuronal activity in correct and error trials. (A) Neuronal activity from PFC in the last 1 s of the delay period from correct and error trials. The data averaged in Figure 5A are now plotted individually for each neuron. Each point represents the activity of one neuron in correct and error nonmatch trials for preferred cue trials (n = 144). Neurons with firing rate up to 20 spikes/s are represented in the main plot. Outliers, with firing rates > 20 spikes/s are shown in the inset. (B) PFC activity in correct and error nonmatch trials from the nonpreferred cue condition. (C,D) As in A and B, for PPC neurons (n = 145).
ROC Analysis
We assessed the reliability with which firing rates can predict the subject’s choice in the MSNG task by performing a ROC analysis that compared the distributions of firing rate in correct and error trials, yielding a quantity sometimes referred to as choice probability (Britten et al. 1996). A similar analysis comparing the responses of the PFC with the Medial Superior Temporal (MST) and Middle Temporal (MT) areas determined that PFC activity influences choice to a greater extent, even though area MST also generates persistent activity (Mendoza-Halliday et al. 2014). Our analysis was performed separately for preferred and nonpreferred cues, averaging choice-probability values across neurons in a time-resolved fashion, in successive 500-ms windows, sliding in 50-ms time intervals (Fig. 5C,D).
In both PFC and PPC, area under the ROC curve computed for the preferred cue condition was generally greater than 0.5 (representing chance) through the entire trial (solid lines in Fig. 5C,D), consistent with the firing rate analysis presented in Figure 5A,B: when activity was lower than average for the neuron’s preferred location, the subject was more likely to make an error. Choice probabilities computed for the nonpreferred cue condition were consistently less than 0.5 (dotted lines in Fig. 5C,D), indicating that when activity was greater than average for the neuron’s nonpreferred direction, the subject was likely to make an error. The distance from 0.5 was maximal during the end of the delay period, as would be expected if the animal’s judgment was informed by the firing rate of the neurons at the end of the delay period. Area under the ROC curve for the preferred cue conditions computed in the last 1 s of the delay period were significantly higher than 0.5 in both areas (2-tailed t-test, t88 = 5.05, P = 2.40 × 10⁻⁶ for PFC; t90 = 8.17, P = 1.86 × 10⁻¹² for PPC). Area under the ROC curve for the nonpreferred cue conditions computed in the last 1 s of the delay period was significantly lower than 0.5 in both areas (2-tailed t-test, t87 = −3.53, P = 6.75 × 10⁻⁴ for PFC; t85 = −5.79, P = 1.15 × 10⁻⁷ for PPC). Some subtle differences were present between areas. The probability computed in the 0.5 s cue period was significantly different from 0.5 for the preferred cue only for the PFC (2 tailed t-test; t88 = 2.62, P = 0.01) and for the nonpreferred cue for the PPC (2 tailed t-test; t85 = −3.43, P = 9.39 × 10⁻⁴). The finding that the area under the ROC curve of PPC neurons was at chance during the preferred cue implies that the monkey’s judgment was not driven by differences in PPC firing rate during the cue period, but at the end of the delay period alone. We have previously described PPC activity prior to the appearance of a stimulus, in the baseline fixation interval (of a different working memory task) can be better predictive of behavioral performance, akin to a bias signal (Katsuki et al. 2014b). Indeed, we found that the area under the ROC curve computed in the fixation period of the preferred condition was significantly higher than 0.5 in PPC (2-tailed t-test, t90 = 3.59, P = 5.35 × 10⁻⁴), which is consistent with our previous finding. In sum, these results confirm that the delay period activity in both PFC and PPC was predictive of working memory judgments.
Population Vector Analysis
The results presented so far provided a picture of averaged activity of individual neurons. To gain insights into the combined activity of the population of neurons in each area, we used a population vector analysis. We fitted the mean firing rate of each neuron during the entire delay period to a cosine function and decoded the activity of the population based on a vectorial sum, combining responses of all available neurons for each type of trial (see Materials and Methods). Five PPC neurons were excluded from this analysis due to poor fitting to the cosine function. For the PFC population, we were able to retrieve accurately the location of the remembered cue across all cue locations (open circles in Fig. 7A). We then examined population responses during nonmatch trials that resulted in errors (black circles in Fig. 7A). We focused on the ±22.5 and 45° locations for which sufficient numbers of trials were available (and which were separable from the 0° condition). In all cases, the direction of the population vector in error trials drifted toward the direction of 0°, as predicted by the model: the monkey erroneously indicated that a second stimulus appearing at the 0° was a match when the population activity indicated that 0° was the location of the remembered cue stimulus.
Figure 7 .
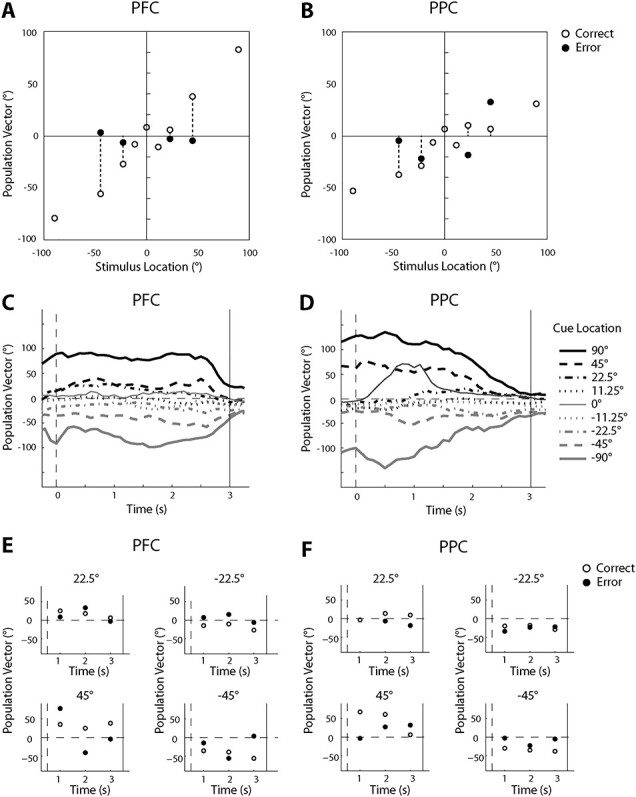
Population vector analysis. (A) Predicted location encoded by PFC population activity (n = 144) based on a population vector analysis is plotted against the actual location of the stimulus. Activity averaged over the delay period was used to calculate the population vector. Open circles represent activity from correct match and nonmatch trials, averaged together, when the cue appeared at the location indicated at the x-axis. Black circles represent activity from error trials, in the nonmatch condition only. (B) As in A, for PPC population activity (n = 140). (C). Time-evolved PFC population vector direction in the delay period of correct trials. Each point represents the direction of the population vector computed based on 1 s of activity centered on its x-value. Time 0 represents the beginning of the delay period. (D) As in C, for PPC population activity. (E). Time course of PFC population activity for correct and error trials, plotted separately for 4 cue locations. Three points are plotted, each based on 1 s of nonoverlapping, delay period activity. The point plotted at 3 s in each plot corresponds to the points plotted in panel A. (F). As in E, for PPC population activity.
For the PPC population, the location retrieved from error trials did not move toward 0° as consistently; however, the location retrieved from correct trials was not as accurate either (Fig. 7B). To understand the differences between population encoding in the 2 areas, we plotted the direction of the population vector during the delay period in a time-resolved fashion. PFC neurons maintained the location of the stimulus stably during the entire delay period (Fig. 7C). In PPC, however, the representation of different remembered cue locations was less separable toward the end of the delay period (Fig. 7D).
Finally, we used the population vector model to examine the time course of encoding in error trials (Fig. 7E,F). Although referring to “drift” may imply a continuous and smooth change in encoding during the time course of the trial that slowly approaches 0, this was not always the case. In several conditions (e.g., 22.5, −22.5, −45 in Fig. 7E) the activity of the population vector in error trials was deviating from that of the correct trials already at the first time point of the delay period. This result was consistent with the ROC analysis, which indicated that a difference in firing rate between correct and error trials was often present early in the trial and even before the cue appeared, particularly in the PPC (Fig. 5D).
Discussion
Persistent activity generated during the delay period of working memory tasks represents the properties of remembered stimuli and can account for behavioral fluctuations from trial to trial (Constantinidis et al. 2001; Wimmer et al. 2014). Evidence linking behavior with levels of persistent activity drawn from the ODR task has been criticized, however, on the grounds that may represent motor preparation rather than working memory per se (Lundqvist et al. 2018; Miller et al. 2018). The goal of the present experiments was to determine if persistent activity during a spatial working memory task that required a categorical judgment about 2 stimuli was predictive of the subject’s response, and if such a relationship was exclusive to the prefrontal cortex or also present in the posterior parietal cortex. We designed a novel task, the MSNG task, which requires a categorical decision based on the remembered spatial location of a stimulus and, arguably, captures better the essence of working memory than delayed response tasks. We often rely on our working memory for categorical decisions, and it follows that the neural correlates of working memory should covary with the outcome of such judgments. We characterized each neuron’s tuning function and made predictions depending on the relative positions of 2 stimuli and the subject’s judgment about the remembered location of the first compared with the second. Our results confirmed that trial-to-trial deviations of prefrontal persistent activity were predictive of the subject’s remembered location.
Our analysis was able to detect differences in firing rate between correct and error trials in the direction predicted by the relative responsiveness to the location of the first and second stimulus despite 3 types of factors that would tend to obscure them: errors caused by lapses rather than drift of the activity toward or away the peak of the neuron’s receptive field; strategies the monkeys may have developed depending on the location of the second stimulus to avoid errors altogether; and drifts of neural activity in the direction opposite to the nonmatch stimulus. Importantly, our task dissociated the response from the spatial location of the remembered stimulus. Thus, our study establishes a direct link between the contents of working memory and persistent activity of prefrontal neurons. Additionally, and contrary to our original expectation, we found that posterior parietal neurons are no less predictive of the subject’s remembered location than prefrontal neurons, at least at the level of single neuron responses.
Neural Correlates of Working Memory
Neurons in the lateral prefrontal cortex and other brain areas that generate persistent activity during working memory tasks that is selective for the properties of the remembered stimuli (Fuster and Alexander 1971; Kubota and Niki 1971; Funahashi et al. 1989; Constantinidis et al. 2001). Stimulus location and identity are represented in persistent discharges, as well as more abstract qualities relating to the rules of the working memory task being executed, quantities of stimuli, and categorical judgments, to name a few (Freedman et al. 2001; Crowe et al. 2013; Mendoza-Halliday et al. 2014; Blackman et al. 2016). Information represented in persistent activity changes based on task demands (Li et al. 2020). Working memory is not the only cognitive domain that persistent neural activity predicts (Constantinidis and Luna 2019). On a neuron by neuron basis, the ability of a neuron to generate persistent activity in working memory tasks is also predictive of activity generated in other types of tasks, most notably response inhibition (Zhou et al. 2016a). Computational models postulate that persistent activity is sustained by virtue of recurrent connections between neurons with similar tuning for stimulus properties, thus allowing activation to be maintained past the presence of the afferent input resulting in a system that behaves as a continuous attractor (Compte et al. 2000; Wang 2001; Murray et al. 2017). Structured excitatory and inhibitory connections are both important in the maintenance of working memory, in this scheme (Constantinidis et al. 2002; Wang et al. 2004).
Alternative models that do not rely on persistent activity have been proposed in recent years, relying on activity-silent mechanisms, or rhythmic bursts of discharges (Stokes 2015; Mi et al. 2017; Lundqvist et al. 2018). A comprehensive discussion of the arguments in favor of and against these models can be found elsewhere (Lundqvist et al. 2016; Riley and Constantinidis 2016; Constantinidis et al. 2018; Miller et al. 2018). We focus here on one aspect of this debate, the relationship between persistent activity and behavior. Discharge rates during the delay period of working memory tasks predict what the subject will recall (Constantinidis et al. 2001; Wimmer et al. 2014), with a level of precession that has not been nearly achieved by alternative models, at least yet. Deviations in the discharges of prefrontal neurons have been shown to predict the endpoint of the saccade in the ODR task (Wimmer et al. 2014). Persistent activity recorded from trials in which monkeys made eye movements deviating clockwise versus counterclockwise relative to the true location of the stimulus yields slightly different tuning curves, as would be expected if the location recalled was determined by the peak of activity at the end of the delay period. Nonetheless, this interpretation was criticized on the grounds that activity may reflect motor preparation to some extent rather than spatial working memory per se (Lundqvist et al. 2018). Our current results extend these findings and demonstrate that categorical judgments rather than the preparation of a motor movement are influenced by small deviations in persistent activity, in the direction predicted by the bump attractor model.
Prefrontal and Parietal Specialization in a Bump Attractor Model
The posterior parietal cortex is a major cortical afferent of the dorsolateral prefrontal cortex (Constantinidis and Procyk 2004). Posterior parietal and dorsolateral prefrontal cortex share many functional properties with respect to spatial working memory (Rawley and Constantinidis 2009). Neurons in posterior parietal cortex also generate persistent activity (Gnadt and Andersen 1988), and this has been shown to represent the remembered locations of visual stimuli, independent of a planned motor response (Constantinidis and Steinmetz 1996). Tested with the ODR task, virtually identical percentages of neurons exhibiting working memory responses were observed in posterior parietal and dorsolateral prefrontal areas (Chafee and Goldman-Rakic 1998).
Despite the overall similarity of responses, the prefrontal cortex exhibits some unique properties. For example, PPC neurons represent the most recent stimulus location and are disrupted by distracting stimuli (Constantinidis and Steinmetz 1996; Qi et al. 2010), whereas prefrontal neurons are better able to represent the location of the original stimulus held in memory even after the appearance of distractors, across tasks (di Pellegrino and Wise 1993; Qi et al. 2010; Suzuki and Gottlieb 2013), although the specific patterns of responses in the 2 areas appear to be task-dependent (Jacob and Nieder 2014; Qi et al. 2015). Persistent activity in prefrontal cortex appears more robust, overall (Masse et al. 2017), and exhibits lower levels of variability in the same tasks (Qi and Constantinidis 2012, 2015). Several studies have thus identified distinct patterns of responses and corresponding roles played by PFC and PPC in working memory and other cognitive functions (Swaminathan and Freedman 2012; Crowe et al. 2013; Ibos et al. 2013; Jacob and Nieder 2014; Qi et al. 2015; Zhou et al. 2016a; Meyers et al. 2018). These differences in functional properties, in turn, can be attributed to differences in intrinsic properties of neurons and circuits in the 2 areas (Zhou et al. 2012; Katsuki et al. 2014a; Hart and Huk 2020).
Based on these results, one might hypothesize that working memory behavior would depend on the readout of the prefrontal activity exclusively, or more strongly, compared with activity in the posterior parietal cortex, as is the case for other areas of the dorsal visual stream that generate persistent activity, such as area MST (Mendoza-Halliday et al. 2014). At the level of single neuron activity, we found that PPC the activity of prefrontal neurons was no less predictive of behavioral outcomes than prefrontal activity. On the other hand, decoding of population activity revealed that the cue location was represented more stably and was predictive of errors in a greater extent in the PFC than the PPC. Other subtle differences were also present between areas. Consistent with previous results (Katsuki et al. 2014b) we found that PPC activity in the fixation period, before the cue period even appeared, was predictive of eventual errors. An important point relevant to this result is that the source of errors in the task is likely multifactorial, including lapses in attention and erroneous application of the task rules and not only drift of the remembered location in neuronal activity, with the 2 areas likely influenced differentially by such factors.
These differences between areas notwithstanding, the robust modulation of PPC activity that was predictive of the animal’s choice raises 2 types of possible explanations. First, prefrontal and posterior parietal cortex simultaneously, and independently of each other influence downstream areas that ultimately determine behavior based on recall of information maintained in memory. Under such a model, “readout” of memory activity occurs in both areas. Alternatively, prefrontal cortex is the ultimate arbiter of information held in memory; however, posterior parietal activity determines prefrontal activity to a large extent. Prefrontal and parietal neurons are coactive in working memory tasks, with variations in parietal cortex preceding in time of similar changes in prefrontal cortex (Crowe et al. 2013). Under the second scenario, our results suggest precise propagation of deviations observed in the PPC into the PFC. Future experiments could differentiate between these alternatives.
Funding
National Eye Institute and National Institute of Mental Health of the National Institutes of Health (R01 EY017077, R01 EY016773, R01 MH116675 to C.C.).
Notes
We wish to acknowledge Kathini Palaninathan, Austin Lodish, Du Gu, and Leonardo Silenzi for technical help; and Rob Hampson, Emilio Salinas, Benjamin Rowland, and Wenhao Dang for helpful comments on the manuscript. Conflict of Interest: None declared.
Contributor Information
Sihai Li, Department of Neurobiology and Anatomy, Wake Forest School of Medicine, Winston-Salem, NC 27157, USA.
Christos Constantinidis, Department of Neurobiology and Anatomy, Wake Forest School of Medicine, Winston-Salem, NC 27157, USA; Department of Biomedical Engineering, Vanderbilt University, Nashville, TN 37235, USA; Neuroscience Program, Vanderbilt University, Nashville, TN 37235, USA; Department of Ophthalmology and Visual Sciences, Vanderbilt University Medical Center, Nashville, TN 37232, USA.
Xue-Lian Qi, Department of Neurobiology and Anatomy, Wake Forest School of Medicine, Winston-Salem, NC 27157, USA.
References
- Albers AM, Kok P, Toni I, Dijkerman HC, Lange FP. 2013. Shared representations for working memory and mental imagery in early visual cortex. Curr Biol. 23:1427–1431. [DOI] [PubMed] [Google Scholar]
- Baddeley A. 2012. Working memory: theories, models, and controversies. Annu Rev Psychol. 63:1–29. [DOI] [PubMed] [Google Scholar]
- Barbosa J, Stein H, Martinez R, Galan A, Adam K, Li S, Valls-Sole J, Constantinidis C, Compte A. 2019. Interplay between persistent activity and activity-silent dynamics in prefrontal cortex during working memory. BioRxiv. doi: 10.1101/763938. [DOI] [PMC free article] [PubMed] [Google Scholar]
- Blackman RK, Crowe DA, DeNicola AL, Sakellaridi S, MacDonald AW 3rd, Chafee MV. 2016. Monkey prefrontal neurons reflect logical operations for cognitive control in a variant of the AX continuous performance task (AX-CPT). J Neurosci. 36:4067–4079. [DOI] [PMC free article] [PubMed] [Google Scholar]
- Britten KH, Newsome WT, Shadlen MN, Celebrini S, Movshon JA. 1996. A relationship between behavioral choice and the visual responses of neurons in macaque MT. Vis Neurosci. 13:87–100. [DOI] [PubMed] [Google Scholar]
- Cavada C, Goldman-Rakic PS. 1989. Posterior parietal cortex in rhesus monkey: I. Parcellation of areas based on distinctive limbic and sensory corticocortical connections. J Comp Neurol. 287:393–421. [DOI] [PubMed] [Google Scholar]
- Chafee MV, Goldman-Rakic PS. 1998. Matching patterns of activity in primate prefrontal area 8a and parietal area 7ip neurons during a spatial working memory task. J Neurophysiol. 79:2919–2940. [DOI] [PubMed] [Google Scholar]
- Chaudhuri R, Fiete I. 2016. Computational principles of memory. Nat Neurosci. 19:394–403. [DOI] [PubMed] [Google Scholar]
- Christophel TB, Klink PC, Spitzer B, Roelfsema PR, Haynes JD. 2017. The distributed nature of working memory. Trends Cogn Sci. 21:111–124. [DOI] [PubMed] [Google Scholar]
- Compte A, Brunel N, Goldman-Rakic PS, Wang XJ. 2000. Synaptic mechanisms and network dynamics underlying spatial working memory in a cortical network model. Cereb Cortex. 10:910–923. [DOI] [PubMed] [Google Scholar]
- Constantinidis C, Bucci DJ, Rugg MD. 2013. Cognitive functions of the posterior parietal cortex. Front Integr Neurosci. 7:35. [DOI] [PMC free article] [PubMed] [Google Scholar]
- Constantinidis C, Franowicz MN, Goldman-Rakic PS. 2001. The sensory nature of mnemonic representation in the primate prefrontal cortex. Nat Neurosci. 4:311–316. [DOI] [PubMed] [Google Scholar]
- Constantinidis C, Funahashi S, Lee D, Murray JD, Qi XL, Wang M, Arnsten AFT. 2018. Persistent spiking activity underlies working memory. J Neurosci. 38:7020–7028. [DOI] [PMC free article] [PubMed] [Google Scholar]
- Constantinidis C, Klingberg T. 2016. The neuroscience of working memory capacity and training. Nat Rev Neurosci. 17:438–449. [DOI] [PubMed] [Google Scholar]
- Constantinidis C, Luna B. 2019. Neural substrates of inhibitory control maturation in adolescence. Trends Neurosci. 42:604–616. [DOI] [PMC free article] [PubMed] [Google Scholar]
- Constantinidis C, Procyk E. 2004. The primate working memory networks. Cogn Affect Behav Neurosci. 4:444–465. [DOI] [PMC free article] [PubMed] [Google Scholar]
- Constantinidis C, Steinmetz MA. 1996. Neuronal activity in posterior parietal area 7a during the delay periods of a spatial memory task. J Neurophysiol. 76:1352–1355. [DOI] [PubMed] [Google Scholar]
- Constantinidis C, Williams GV, Goldman-Rakic PS. 2002. A role for inhibition in shaping the temporal flow of information in prefrontal cortex. Nat Neurosci. 5:175–180. [DOI] [PubMed] [Google Scholar]
- Crowe DA, Goodwin SJ, Blackman RK, Sakellaridi S, Sponheim SR, Macdonald AW 3rd, Chafee MV. 2013. Prefrontal neurons transmit signals to parietal neurons that reflect executive control of cognition. Nat Neurosci. 16:1484–1491. [DOI] [PMC free article] [PubMed] [Google Scholar]
- Pellegrino G, Wise SP. 1993. Effects of attention on visuomotor activity in the premotor and prefrontal cortex of a primate. Somatosens Mot Res. 10:245–262. [DOI] [PubMed] [Google Scholar]
- Ester EF, Anderson DE, Serences JT, Awh E. 2013. A neural measure of precision in visual working memory. J Cogn Neurosci. 25:754–761. [DOI] [PMC free article] [PubMed] [Google Scholar]
- Freedman DJ, Riesenhuber M, Poggio T, Miller EK. 2001. Categorical representation of visual stimuli in the primate prefrontal cortex. Science. 291:312–316. [DOI] [PubMed] [Google Scholar]
- Funahashi S, Bruce CJ, Goldman-Rakic PS. 1989. Mnemonic coding of visual space in the monkey's dorsolateral prefrontal cortex. J Neurophysiol. 61:331–349. [DOI] [PubMed] [Google Scholar]
- Fuster JM, Alexander GE. 1971. Neuron activity related to short-term memory. Science. 173:652–654. [DOI] [PubMed] [Google Scholar]
- Georgopoulos AP, Schwartz AB, Kettner RE. 1986. Neuronal population coding of movement direction. Science. 233:1416–1419. [DOI] [PubMed] [Google Scholar]
- Gnadt JW, Andersen RA. 1988. Memory related motor planning activity in posterior parietal cortex of macaque. Exp Brain Res. 70:216–220. [DOI] [PubMed] [Google Scholar]
- Harris KD, Henze DA, Csicsvari J, Hirase H, Buzsaki G. 2000. Accuracy of tetrode spike separation as determined by simultaneous intracellular and extracellular measurements. J Neurophysiol. 84:401–414. [DOI] [PubMed] [Google Scholar]
- Harrison SA, Tong F. 2009. Decoding reveals the contents of visual working memory in early visual areas. Nature. 458:632–635. [DOI] [PMC free article] [PubMed] [Google Scholar]
- Hart E, Huk AC. 2020. Recurrent circuit dynamics underlie persistent activity in the macaque frontoparietal network. Elife. 9:e52460. [DOI] [PMC free article] [PubMed] [Google Scholar]
- Ibos G, Duhamel JR, Ben Hamed S. 2013. A functional hierarchy within the parietofrontal network in stimulus selection and attention control. J Neurosci. 33:8359–8369. [DOI] [PMC free article] [PubMed] [Google Scholar]
- Jacob SN, Nieder A. 2014. Complementary roles for primate frontal and parietal cortex in guarding working memory from distractor stimuli. Neuron. 83:226–237. [DOI] [PubMed] [Google Scholar]
- Katsuki F, Qi XL, Meyer T, Kostelic PM, Salinas E, Constantinidis C. 2014a. Differences in intrinsic functional organization between dorsolateral prefrontal and posterior parietal cortex. Cereb Cortex. 24:2334–2349. [DOI] [PMC free article] [PubMed] [Google Scholar]
- Katsuki F, Saito M, Constantinidis C. 2014b. Influence of monkey dorsolateral prefrontal and posterior parietal activity on behavioral choice during attention tasks. Eur J Neurosci. 40:2910–2921. [DOI] [PMC free article] [PubMed] [Google Scholar]
- Kubota K, Niki H. 1971. Prefrontal cortical unit activity and delayed alternation performance in monkeys. J Neurophysiol. 34:337–347. [DOI] [PubMed] [Google Scholar]
- Li S, Zhou X, Qi XL. 2020. Plasticity of persistent activity and its constraints. Front Neural Circuits. 14:15. [DOI] [PMC free article] [PubMed] [Google Scholar]
- Lundqvist M, Herman P, Miller EK. 2018. Working memory: delay activity, yes! Persistent activity? Maybe Not. J Neurosci. 38:7013–7019. [DOI] [PMC free article] [PubMed] [Google Scholar]
- Lundqvist M, Rose J, Herman P, Brincat SL, Buschman TJ, Miller EK. 2016. Gamma and beta bursts underlie working memory. Neuron. 90:152–164. [DOI] [PMC free article] [PubMed] [Google Scholar]
- Masse NY, Hodnefield JM, Freedman DJ. 2017. Mnemonic encoding and cortical organization in parietal and prefrontal cortices. J Neurosci. 37:6098–6112. [DOI] [PMC free article] [PubMed] [Google Scholar]
- Mendoza-Halliday D, Torres S, Martinez-Trujillo JC. 2014. Sharp emergence of feature-selective sustained activity along the dorsal visual pathway. Nat Neurosci. 17:1255–1262. [DOI] [PMC free article] [PubMed] [Google Scholar]
- Meyer T, Constantinidis C. 2005. A software solution for the control of visual behavioral experimentation. J Neurosci Methods. 142:27–34. [DOI] [PubMed] [Google Scholar]
- Meyers EM, Liang A, Katsuki F, Constantinidis C. 2018. Differential processing of isolated object and multi-item pop-out displays in LIP and PFC. Cereb Cortex. 28:3816–3828. [DOI] [PMC free article] [PubMed] [Google Scholar]
- Mi Y, Katkov M, Tsodyks M. 2017. Synaptic correlates of working memory capacity. Neuron. 93:323–330. [DOI] [PubMed] [Google Scholar]
- Miller EK, Lundqvist M, Bastos AM. 2018. Working memory 2.0. Neuron. 100:463–475. [DOI] [PMC free article] [PubMed] [Google Scholar]
- Murray JD, Bernacchia A, Roy NA, Constantinidis C, Romo R, Wang XJ. 2017. Stable population coding for working memory coexists with heterogeneous neural dynamics in prefrontal cortex. Proc Natl Acad Sci U S A. 114:394–399. [DOI] [PMC free article] [PubMed] [Google Scholar]
- Qi XL, Constantinidis C. 2012. Variability of prefrontal neuronal discharges before and after training in a working memory task. PLoS One. 7:e41053. [DOI] [PMC free article] [PubMed] [Google Scholar]
- Qi XL, Constantinidis C. 2013. Neural changes after training to perform cognitive tasks. Behav Brain Res. 241:235–243. [DOI] [PMC free article] [PubMed] [Google Scholar]
- Qi XL, Constantinidis C. 2015. Lower neuronal variability in the monkey dorsolateral prefrontal than posterior parietal cortex. J Neurophysiol. 114:2194–2203. [DOI] [PMC free article] [PubMed] [Google Scholar]
- Qi XL, Elworthy AC, Lambert BC, Constantinidis C. 2015. Representation of remembered stimuli and task information in the monkey dorsolateral prefrontal and posterior parietal cortex. J Neurophysiol. 113:44–57. [DOI] [PMC free article] [PubMed] [Google Scholar]
- Qi XL, Katsuki F, Meyer T, Rawley JB, Zhou X, Douglas KL, Constantinidis C. 2010. Comparison of neural activity related to working memory in primate dorsolateral prefrontal and posterior parietal cortex. Front Syst Neurosci. 4:12. [DOI] [PMC free article] [PubMed] [Google Scholar]
- Rawley JB, Constantinidis C. 2009. Neural correlates of learning and working memory in the primate posterior parietal cortex. Neurobiol Learn Mem. 91:129–138. [DOI] [PMC free article] [PubMed] [Google Scholar]
- Riley MR, Constantinidis C. 2016. Role of prefrontal persistent activity in working memory. Front Syst Neurosci. 9:181. [DOI] [PMC free article] [PubMed] [Google Scholar]
- Sreenivasan KK, Curtis CE, D'Esposito M. 2014a. Revisiting the role of persistent neural activity during working memory. Trends Cogn Sci. 18:82–89. [DOI] [PMC free article] [PubMed] [Google Scholar]
- Sreenivasan KK, Vytlacil J, D'Esposito M. 2014b. Distributed and dynamic storage of working memory stimulus information in extrastriate cortex. J Cogn Neurosci. 26:1141–1153. [DOI] [PMC free article] [PubMed] [Google Scholar]
- Stokes MG. 2015. 'Activity-silent' working memory in prefrontal cortex: a dynamic coding framework. Trends Cogn Sci. 19:394–405. [DOI] [PMC free article] [PubMed] [Google Scholar]
- Suzuki M, Gottlieb J. 2013. Distinct neural mechanisms of distractor suppression in the frontal and parietal lobe. Nat Neurosci. 16:98–104. [DOI] [PMC free article] [PubMed] [Google Scholar]
- Swaminathan SK, Freedman DJ. 2012. Preferential encoding of visual categories in parietal cortex compared with prefrontal cortex. Nat Neurosci. 15:315–320. [DOI] [PMC free article] [PubMed] [Google Scholar]
- Todd JJ, Marois R. 2004. Capacity limit of visual short-term memory in human posterior parietal cortex. Nature. 428:751–754. [DOI] [PubMed] [Google Scholar]
- Todd JJ, Marois R. 2005. Posterior parietal cortex activity predicts individual differences in visual short-term memory capacity. Cogn Affect Behav Neurosci. 5:144–155. [DOI] [PubMed] [Google Scholar]
- Wang XJ. 2001. Synaptic reverberation underlying mnemonic persistent activity. Trends Neurosci. 24:455–463. [DOI] [PubMed] [Google Scholar]
- Wang XJ, Tegner J, Constantinidis C, Goldman-Rakic PS. 2004. Division of labor among distinct subtypes of inhibitory neurons in a cortical microcircuit of working memory. Proc Natl Acad Sci U S A. 101:1368–1373. [DOI] [PMC free article] [PubMed] [Google Scholar]
- Wimmer K, Nykamp DQ, Constantinidis C, Compte A. 2014. Bump attractor dynamics in prefrontal cortex explains behavioral precision in spatial working memory. Nat Neurosci. 17:431–439. [DOI] [PubMed] [Google Scholar]
- Xing Y, Ledgeway T, McGraw PV, Schluppeck D. 2013. Decoding working memory of stimulus contrast in early visual cortex. J Neurosc. 33:10301–10311. [DOI] [PMC free article] [PubMed] [Google Scholar]
- Zhou X, Katsuki F, Qi XL, Constantinidis C. 2012. Neurons with inverted tuning during the delay periods of working memory tasks in the dorsal prefrontal and posterior parietal cortex. J Neurophysiol. 108:31–38. [DOI] [PMC free article] [PubMed] [Google Scholar]
- Zhou X, Qi XL, Constantinidis C. 2016a. Distinct roles of the prefrontal and posterior parietal cortices in response inhibition. Cell Rep. 14:2765–2773. [DOI] [PMC free article] [PubMed] [Google Scholar]
- Zhou X, Zhu D, Qi XL, Lees CJ, Bennett AJ, Salinas E, Stanford TR, Constantinidis C. 2013. Working memory performance and neural activity in the prefrontal cortex of peri-pubertal monkeys. J Neurophysiol. 110:2648–2660. [DOI] [PMC free article] [PubMed] [Google Scholar]
- Zhou X, Zhu D, Qi XL, Li S, King SG, Salinas E, Stanford TR, Constantinidis C. 2016b. Neural correlates of working memory development in adolescent primates. Nat Commun. 7:13423. [DOI] [PMC free article] [PubMed] [Google Scholar]
- Zylberberg J, Strowbridge BW. 2017. Mechanisms of persistent activity in cortical circuits: possible neural substrates for working memory. Annu Rev Neurosci. 40:603–627. [DOI] [PMC free article] [PubMed] [Google Scholar]