

Abstract
A growing literature suggests a relationship between HIV-infection and a molecular profile of age acceleration. However, despite the widely known high prevalence of HIV-related brain atrophy and HIV-associated neurocognitive disorder (HAND), epigenetic age acceleration has not been linked to HIV-related changes in structural MRI. We applied morphological MRI methods to study the brain structure of 110 virally suppressed participants with HIV infection and 122 uninfected controls age 22–72. All participants were assessed for cognitive impairment, and blood samples were collected from a subset of 86 participants with HIV and 83 controls to estimate epigenetic age. We examined the group-level interactive effects of HIV and chronological age and then used individual estimations of epigenetic age to understand the relationship between age acceleration and brain structure. Finally, we studied the effects of HAND. HIV-infection was related to gray matter reductions, independent of age. However, using epigenetic age as a biomarker for age acceleration, individual HIV-related age acceleration was associated with reductions in total gray matter. HAND was associated with decreases in thalamic and hippocampal gray matter. In conclusion, despite viral suppression, accentuated gray matter loss is evident with HIV-infection, and greater biological age acceleration specifically relates to such gray matter loss.
Keywords: epigenetics, HAND, HIV, MRI
Introduction
Today, HIV infection has largely become a nonlife threatening disease thanks to the efficacy of combined antiretroviral therapies. With patients readily able to achieve viral suppression, HIV is now seen as a chronic disease in the resource-rich countries, with a life expectancy similar to that of uninfected individuals (Samji et al. 2013). However, with aging and long-term chronic disease, age-related co-morbidities have become a key concern in people with HIV (PWH; Rasmussen et al. 2015; Wing 2016). Additionally, theories of accelerated aging have emerged due to the increased incidence of age-related comorbidities in PWH compared with uninfected individuals (Pathai et al. 2014). These comorbidities include cardiovascular disease (Martin-Iguacel et al. 2015), liver disease (Joshi et al. 2011), renal disease (Ando et al. 2012), and neurologic diseases such as HIV-associated neurocognitive disorder (HAND; Heaton et al. 2010).
HIV is known to cross the blood brain barrier in the early stages of systemic viremia. Once in the CNS, it can infect astrocytes and cause inflammatory changes that may propagate to neural damage (González-Scarano and Martín-García 2005; Kaul et al. 2005). This process has been hypothesized to lead to accelerated aging in the brain, which may ultimately present as cognitive decline in the form of HAND (Caruana et al. 2017). HIV-related accelerated aging may also be linked to gross changes in brain structure (Holt et al. 2012), which some studies suggest reflect those seen in normative aging although amplified (Raz et al. 2005; Taki et al. 2011). Multiple studies have examined how these structural changes are differentially modulated by aging in HIV infection (Cardenas et al. 2009; Chang et al. 2011; Ances et al. 2012; Becker et al. 2012; Pfefferbaum et al. 2012; Towgood et al. 2012), but the overall findings in PWH have been inconsistent, with some studies showing that other health factors such as adipose tissue (Lake et al. 2017) and hypertension (Van Zoest et al. 2018) may also be associated with the brain atrophy seen in PWH. Additionally, none of these studies have included a biomarker of age acceleration, which could help quantify age acceleration at the individual level, beyond conventional gross measures such as chronological age, and clarify the nature of these changes in local brain structure.
One promising method that has been used to measure HIV-related age acceleration is through the epigenetic clock. This method involves the quantification of specific CpG (cytosine phosphate guanines) sites from human cells (Hannum et al. 2013; Horvath 2013). These predetermined sites have been identified in genes associated with development and aging, and examining epigenetic methylation at these sites allows for modeling of an individual’s biological age. Age acceleration can then be determined as the difference between an individual’s chronological and biological age. Notably, this metric has shown to be predictive of all-cause mortality in older age (Marioni et al. 2015) and has been utilized in multiple fields. In the context of HIV specifically, accelerated aging has been detected in both blood and brain tissue using the epigenetic clock (Horvath and Levine 2015; Gross et al. 2016), and such HIV-related epigenetic aging has been linked to HAND (Levine et al. 2016). Accelerated epigenetic age has even been found in adolescents with perinatally acquired HIV infection (Horvath et al. 2018). However, it remains unclear how such accelerated epigenetic aging relates to the changes in brain structure seen in HIV.
Herein, we examine the relationship between aging and brain structure in the context of HIV infection. Given that the majority of diagnosed PWH in the United States of America are virally suppressed (Harris et al. 2019), we aimed to study virally suppressed PWH. Briefly, we applied advanced computational methods on high-resolution structural MRIs from a large group of PWH and uninfected controls, sampled evenly from 22- to 72-year old. Additionally, we measured epigenetic age from peripheral blood to determine each participant’s age acceleration/deceleration and then related such aging to our MRI-derived measures of brain structure. We hypothesized that structural MRI metrics would show evidence of accelerated aging in PWH and that these metrics would relate to our independent epigenetic age acceleration estimations. Finally, we studied how these metrics differ in participants with HAND relative to cognitively unimpaired participants, hypothesizing that those with HAND would show larger degrees of atrophy and age acceleration.
Methods and Materials
Participants
This study examined the same sample as described in a previous magnetoencephalography study (Lew et al. 2020). Briefly, PWH were recruited from the HIV Clinic of the University of Nebraska Medical Center and demographically matched uninfected control participants were recruited from the local community. To optimize the study of aging in HIV, participants were recruited using a decade-classification approach with manual tuning to create an even distribution across age, ranging from 22 to 72 years. All PWH were receiving effective cART and had an undetectable viral load within 3 months of participation in the study, defined as <50 copies/mL. Uninfected controls were specifically recruited to match PWH based on their race/ethnicity, age, and sex. Of note, CD4 metrics were not examined in controls as we did not hypothesize that fluctuations in CD4 would be functionally meaningful in those without HIV. Exclusion criteria included any chronic medical illness affecting CNS function (other than HIV-infection/HAND), any neurological or psychiatric disorder, acute intercurrent illness, pregnancy, history of head trauma, current substance use disorder, and presence of any ferrous metal implant which may interfere with the MRI data acquisition. The Institutional Review Board at the University of Nebraska Medical Center approved this protocol. Each participant provided written informed consent, and all participants completed the same protocol.
Out of the 121 PWH and 133 uninfected controls recruited for this study, 110 PWH (nage 22–39 = 32, nage 40–59 = 62, nage 60–72 = 16) and 122 controls (nage 22–39 = 53, nage 40–59 = 45, nage 60–72 = 24) successfully completed the MRI protocol (Table 1) and had structural T1 MRI data that could be used for processing. All PWH were virally suppressed with a median current CD4 of 702 cells/μL (range: 102–2617) and a median CD4 nadir of 237 cells/μL (range: 3–586). Participant’s body mass index (BMI) did not significantly differ between our HIV (MBMI = 28.62) and control (MBMI = 29.27) groups (P = 0.478) nor did BMI significantly correlate with age (P = 0.756).
Table 1.
Participant demographics
| Sample with MRI data | Subsample with MRI and epigenetic data | |||
|---|---|---|---|---|
| Uninfected controls (n = 122) | PWH (n = 110) | Uninfected controls (n = 83) | PWH (n = 86) | |
| Chronological age (years; mean/SD) | 44.56 (15.33) | 47.11 (12.29) | 43.69 (14.68) | 47.11 (12.15) |
| Sex (M/F; n/%) | 65/57 (53.3/46.7%) | 64/46 (58.2/41.8%) | 43/40 (51.8/48.2%) | 55/31 (64.0/36.0%) |
| Race (Caucasian/African American/Asian/Other: n/%) | 82/33/5/2 (67.2/27.0/4.1/1.6%) | 71/34/2/3 (64.5/30.9/1.8/2.7%) | 57/21/4/1 (68.7/25.3/4.8/1.2%) | 58/26/1/1 (67.4/30.2/1.2/1.2%) |
| Average composite neuropsychological Z-Score (mean/SD) | −0.12 (0.60) | −0.41 (0.64) | 0.02 (0.50) | −0.43 (0.61) |
| HAND (n/%) | — | 40 (36.4%) | — | 34 (39.5%) |
| Time Since HIV Diagnosis (years; mean/stdv) | — | 11.1 (7.32) | — | 11.7 (7.43) |
| CD4 Nadir (median/range) | — | 237 (3–586) | — | 237 (3–585) |
| Current CD4 (median/range) | — | 702 (102–2617) | — | 743.5 (106–2617) |
Ninety-seven PWH and 87 controls completed a blood draw for epigenetic age estimation. Missing data were due to participants quitting the study, being lost to follow-up, or related issues. Notably, 12 participants who completed the blood draw did not successfully complete the MRI protocol, and three blood samples were inadequate for epigenetic age estimation. Ultimately, this yielded a final sample of 86 PWH and 83 controls who had reliable data from both epigenetic age estimations and structural T1 MRI data. Subsequent MRI analyses included all 232 participants that completed MRI, and analyses examining only epigenetic data included all 181 participants that had completed methylation data. Analyses relating MRI to epigenetics only utilized participants that had data from both methods (n = 169).
Neuropsychological Testing
Participants completed a full neuropsychological battery to identify PWH who had HAND as described in Lew et al. (2018). Briefly, this battery assessed multiple functional domains, including executive functioning, attention, speed of processing, fine motor, verbal learning and memory, and language. Composite scores were then used to identify participants with HAND according to the Frascati criteria (Antinori et al. 2007).
MRI Acquisition
Structural T1-weighted MRI images were acquired with a Philips Achieva 3 T X-series scanner using an eight-channel head coil and a 3D fast field echo sequence with the following parameters: TR: 8.09 ms; TE: 3.7 ms; field of view: 24 cm; matrix: 256 × 256; slice thickness: 1 mm with no gap; in-plane resolution: 0.9375 × 0.9375 mm; sense factor: 1.5.
Structural MRI Morphometry
To study the regional distribution of gray matter, participants’ high-resolution T1-weighted MRI data were processed using the standard voxel-based morphometry (VBM) pipeline in the computational anatomy toolbox (CAT12 v12.6; Gaser and Dahnke 2016) within SPM12. Briefly, MRI data underwent noise reduction using a spatially adaptive nonlocal means denoising filter (Manjón et al. 2010) and a classical Markov Random Field approach (Rajapakse et al. 1997). An affine registration and a local intensity transformation were then applied to the bias corrected images. Finally, preprocessed images were segmented based on an adaptive maximum a posterior technique (Ashburner and Friston 2005) and a partial volume estimation with a simplified mixed model of a maximum of two tissue types (Tohka et al. 2004). Images were normalized to MNI template space, and the resulting VBM images were smoothed using an 8-mm FWHM Gaussian kernel.
To examine the cortical thickness, we applied additional surface-based morphometry calculations at a resolution of 1 mm3. This utilizes a projection-based thickness approach to estimate cortical thickness and reconstruct the central surface in one step (Dahnke et al. 2013). Briefly, the white matter (WM) distance is estimated, and the local maxima are projected onto other gray matter voxels using a neighboring relationship described by the WM distance. Topological defects are corrected based on spherical harmonics (Yotter, Dahnke, et al. 2011a), and the cortical surface mesh was reparameterized into a common coordinate system via an algorithm that reduces area distortion (Yotter, Thompson, et al. 2011b). Finally, the resulting maps were resampled and smoothed using a 15-mm FWHM Gaussian kernel.
Total Tissue Volume Statistics with Chronological Age
To examine the relationship between age and calculated total tissue volumes (gray matter, WM, and CSF volumes), each participant’s tissue volumes were first normalized to their total intracranial volume (TIV; tissue volume/TIV). We then utilized hierarchical regressions to examine the best model fit for the relationship between age and tissue volumes across all participants. Polynomial terms were iteratively added to determine the relationship between MRI metrics and age in our sample, testing whether each metric had a linear, quadratic, or cubic relationship with age, before introducing the effect of HIV. That is, we ran regressions of tissue volumes on age, with the first block having just the linear age term, the second block adding age squared to assess for a quadratic relationship, and the third block adding age cubed to assess for a cubic relationship. The significance of the change in R2 was used to determine whether higher order relationships better explained the relationship between age and tissue volumes.
Once this relationship was determined, we then added group (PWH vs. controls) as an independent variable into the models to determine the main effect of HIV. Finally, to determine how the relationship between age and tissue volumes changed with HIV infection, we added the interactive group by age term(s) in a final hierarchical regression block. That is, for a linear relationship, one age by HIV interactive term was added, and for a quadratic relationship, both an age by HIV term and age2-by-HIV term were entered in one block. The significance of the change in R2 was used to determine whether this interactive effect was significant.
MRI Morphometry Statistical Comparisons with Chronological Age
To determine the spatially specific independent and interactive effects of HIV and aging, we then ran ANCOVA models on the VBM volume maps and the cortical thickness surface maps. These statistical models were estimated using SPM12 and the CAT12 toolbox. HIV status was entered as a categorical factor, and chronological age was used as a covariate of interest, along with the interaction between HIV-status and age. In the VBM model, TIV was also used as a nuisance covariate, and an absolute threshold mask of 0.1 was used. Finally, to correct for multiple comparisons, an FDR threshold of 0.05 and a k threshold of 200 were used in both models.
Epigenetic Aging and Calculation of Age Acceleration
Whole-blood samples were collected as closely as possible to their MRI scan date, and this time difference was used as a covariate of no interest in all analyses involving the two different types of measures. All of the methylation metrics, including the Horvath and Hannum models of DNAm age, were computed on the entire data set. The DNA sample collection, methylation analysis, and epigenetic age estimation followed the pipeline established in earlier work (Gross et al. 2016).
Briefly, DNA was purified from whole-blood samples using BD Vacutainer EDTA collection tubes and DNeasy blood and tissue extraction kits (QIAGEN). Methylation analysis was performed using Infinium HumanMethylation450 BeadChip Kits (Illumina). Following hybridization, BeadChips were scanned using the Illumina HiScan System. All data were processed through the Minfi R processing pipeline (Aryee et al. 2014). Methylome data were downloaded from Hannum (Hannum et al. 2013) and EPIC (GEO: GSE40279 and GSE51032; Riboli et al. 2002), and we processed these data together along with those from the current study. Beta values were extracted and quantile normalized using Minfi; cell counts were estimated using estimate Cell Composition and resulting normalized beta values were adjusted for cell types (Houseman et al. 2012; Gross et al. 2016). All data were then normalized using a modified BMIQ procedure provided by Horvath (Horvath 2013). The gold standard was set to the median beta observed in the Hannum study (Hannum et al. 2013).
To compute epigenetic age, the “consensus model” of methylation age was used, which combines both the Horvath (Horvath 2013) and Hannum (Hannum et al. 2013) methods of prediction and has been previously found to provide more predictive capacity than either model in isolation (Gross et al. 2016). Upon calculating each participant’s epigenetic age, we then subtracted each participant’s consensus predicted biological age from their chronological age to obtain a measure of age disparity. This metric represents the participant-specific age acceleration/deceleration of biological age relative to chronological age.
Relationships between Brain Structure and Biologically Determined Age Acceleration
To relate structural MRI metrics to molecularly derived age, we utilized HIV infection, relative age acceleration, and their interaction as independent variables in ANCOVAs examining their effect on structural MRI measurements. This analysis only used data from participants that had both complete MRI and methylation data. We first ran ANCOVAs with total brain tissue volumes (gray matter, WM, and CSF) as dependent variables, examining the main effects of HIV and relative age acceleration, and the interaction between the two. We then examined whether there were region-specific effects of relative age acceleration on brain structure by using the same ANCOVA model on our VBM and cortical thickness maps. We again probed for the main effects of HIV, relative age acceleration, and their interaction, and as before, an FDR threshold of 0.05 and a k threshold of 200 were used to correct for multiple comparisons.
Analysis of HAND
To determine the impact of HAND, we performed post hoc analyses repeating our statistical comparisons after splitting the PWH group by HAND. Specifically, we performed pairwise comparisons between uninfected controls, unimpaired PWH, and participants with HAND. These comparisons were performed for the total brain tissue data, cortical thickness, and VBM maps, and for the relationships between epigenetic age acceleration and total tissue volumes.
Results
Independent Effects of HIV and Aging in Gray Matter Volume
To determine the best model fit, we first ran hierarchical regressions of MRI volume on age, iteratively adding polynomial terms and assessing the significance of the change in R square. All volume data were normalized to each participant’s TIV. The linear regression of gray matter volume on age was significant (F(1,230) = 240.02; P < 0.001), and adding the age squared quadratic term did not show a significant improvement in model fit (F(1,229) = 0.04; P = 0.849). The regression of WM volume on age showed a significant linear effect (F(1,230) = 25.73; P < 0.001), as well as a significant improvement with the addition of the quadratic term (F(1,229) = 32.44; P < 0.001). Adding age cubed did not significantly improve the model (F(1,228) = 0.72; P = 0.397). Similarly, the regression of CSF volume on age showed a significant linear effect (F(1,230) = 152.95; P < 0.001), a significant improvement with the age squared term (F(1,229) = 11.98; P < 0.001), and no significant improvement with the cubed term (F(1,228) = 1.70; P = 0.193). Therefore, gray matter volume showed a linear trend with age, and WM and CSF volumes showed a quadratic trend with age.
Next, using each tissue’s respective model from the previous analysis, we assessed the main effect of HIV. This showed a main effect of HIV in gray matter volume (F(1,229) = 10.31; P = 0.002) and CSF (F(1,228) = 8.13; P = 0.005), with no significant effect in WM volume (F(1,228) = 2.14; P = 0.145). Finally, we added the interactive term(s) of group by age (and group by age squared for WM and CSF) in one block and examined the significance in R squared change. There was no significant interactive effect for gray matter volume (F(1,228) = 0.11; P = 0.737), nor CSF (F(2,226) = 2.08; P = 0.127); however, there was a trending interactive effect for WM volume (F(2,226) = 2.71; P = 0.069; Fig. 1). These statistics are summarized in Table 2.
Figure 1 .
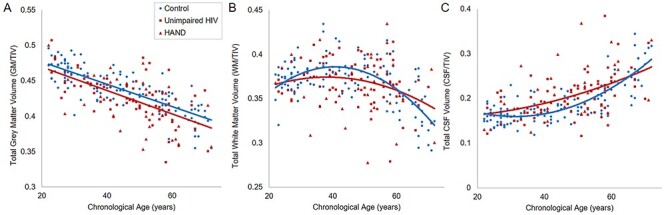
Tissue volumes by HIV status and age. Total gray matter (A), WM (B) and CSF (C) volumes were calculated from T1 MRIs and normalized to TIV. Hierarchical regressions with chronological age were used to determine the relationships between each tissue volume and age, and then the main effect of HIV, and interaction effect of HIV by age were tested. PWH specifically displayed significantly less gray matter volume relative to uninfected controls, independent of age. No interaction effects of HIV by age were found.
Table 2.
Total tissue volume statistics
| Hierarchical regression | |||
|---|---|---|---|
| Age | HIV | HIV × Age | |
| Gray matter | linear: F(1,230) = 240.02; P < 0.001 | F(1,229) = 10.31; P = 0.002 | F(1,228) = 0.11; P = 0.737 |
| WM | quadratic: F(1,229) = 32.44; P < 0.001 | F(1,228) = 2.14; P = 0.145 | F(2,226) = 2.71; P = 0.069 |
| CSF | quadratic: F(1,229) = 11.98; P = 0.001 | F(1,228) = 8.13; P = 0.005 | F(2,226) = 2.08; P = 0.127 |
| ANCOVA | |||
| Age acceleration | HIV | HIV × Age acceleration | |
| Gray matter | F(1,165) = 7.59; P = 0.007 | F(1,165) = 11.47; P = 0.001 | F(1,165) = 4.18; P = 0.043 |
| WM | F(1,165) = 0.05; P = 0.831 | F(1,165) = 2.79; P = 0.097 | F(1,165) < 0.01; P = 0.961 |
| CSF | F(1,165) = 3.84; P = 0.052 | F(1,165) = 10.04; P = 0.002 | F(1,165) = 1.63; P = 0.204 |
In summary, only total gray matter showed a main effect of HIV, and the trajectory of the linear decrease in gray matter volume with age did not significantly differ from controls.
Independent Effects of HIV and Aging in Cortical Thickness
Cortical thickness surface maps were used to test the independent effects of HIV and aging, as well as the HIV by age interaction. After multiple comparisons correction, significant widespread reductions in cortical thickness were found to be associated with HIV infection, independent of age (Fig. 2A). The main effect of age showed an expected reduction in cortical thickness with increasing age across the cortical mantle (Fig. 2B). No significant clusters displaying an HIV by age interaction survived multiple comparisons correction.
Figure 2 .

Statistical parametric maps of cortical thickness on HIV and aging. Surface-based morphometry was used to estimate cortical thickness from T1 MRIs, and the independent and interactive effects of HIV and age were estimated. PWH displayed widespread reduced cortical thickness in comparison to controls, independent of age (A). The model also showed an expected pattern of reduction in cortical thickness with age (22–72 years, B). No HIV by age interaction was found. Color bars display P-values scaled by −log(P), and corrected with a 0.05 FDR and k = 200 threshold.
Independent Effects of HIV and Aging in VBM
Voxel-based morphometry maps were used to test for the independent effects of HIV and age, as well as the interaction between the two. As expected, the independent effect of age showed widespread cortical and subcortical reductions in gray matter with increasing age (Fig. 3A). The independent effect of HIV showed a collection of subcortical and cortical significant clusters that survived multiple comparisons correction, including the cingulate cortex, bilateral thalamus, and hippocampus (Fig. 3B).
Figure 3 .

Statistical parametric maps of VBM on HIV and aging. VBM was computed from T1 MRIs, and the independent and interactive effects of HIV and age were tested. (A) VBM maps showed widespread reductions in gray matter with increasing age. (B) PWH displayed significant reductions in gray matter in comparison to controls across a collection of brain regions, including the cingulate cortex, bilateral thalamus, and hippocampus independent of age. No HIV by age interaction was found. Color bars display P-values scaled by –log(P), and corrected with a 0 05 FDR and k = 200 threshold.
HIV-Specific Relationship between Gray Matter Volume and Accelerated Aging
Epigenetic age was calculated per participant, and each participant’s relative age acceleration was determined by subtracting consensus predicted epigenetic age from their age at blood draw. Examining group differences in epigenetic age acceleration alone, we conducted an independent samples Mann–Whitney U test, due to the presence of several outliers [>3 standard deviations (SDs) from the group mean]. A two tailed Mann–Whitney U test showed a nonsignificant, but trending, difference between uninfected controls and PWH (U = 4757; P = 0.056). This comparison utilized all participants that had epigenetic data, irrespective of whether they had MRI data.
ANCOVA examining the relationship between normalized total gray matter volume and relative age acceleration by HIV status revealed significant main effects of HIV and age acceleration on total gray matter volume such that both greater molecular age acceleration (F(1,165) = 7.59; P = 0.007, ƞ2 = 0.044) and HIV infection (F(1,165) = 11.47; P = 0.001, ƞ2 = 0.065) were independently related to reductions in total gray matter volume. Additionally, there was a significant HIV by age acceleration interaction such that PWH showed a stronger relationship between reduced gray matter and relative age acceleration when compared with controls (F(1,165) = 4.18; P = 0.043, ƞ2 = 0.025). This effect remained significant after covarying for BMI (F(1,164) = 4.25; P = 0.041). To probe this interaction, we then performed simple effects testing on controls and PWH separately. This showed that the relationship between age acceleration and total gray matter volume was significant in PWH (r(84) = −0.346; P = 0.001) and nonsignificant in controls (r(81) = −0.057; P = 0.611). Ultimately, this shows that specifically for PWH, the greater biological age acceleration a participant displayed, the smaller their total gray matter volume (Fig. 4).
Figure 4 .

HIV-related age acceleration is related to reduced gray matter volume. When comparing chronological age to epigenetic age, PWH showed a greater relative age acceleration compared with uninfected controls (A). When examining the relationship between participants’ relative age acceleration and total gray matter volume, a significant HIV by age acceleration interaction was found such that the greater accelerated age seen in PWH was related to reduced total gray matter volume, while controls showed no relationship (B). GM/TIV = Total gray matter volume/TIV.
ANCOVAs examining the relationship between WM and CSF volumes with relative age acceleration by HIV status both failed to show a significant main effect of relative age acceleration and failed to show an interactive HIV by relative age acceleration effect. As in earlier models examining chronological age, the main effect of HIV on CSF volume did remain significant (F(1,165) = 10.04; P = 0.002, ƞ2 = 0.057) and the main effect of HIV on WM volume remained nonsignificant. These results are summarized in Table 2.
In regard to local effects, statistical parametric mapping of both VBM and cortical thickness maps examining HIV, relative age acceleration, and their interaction failed to display any region-specific main effect of relative age acceleration, nor an interactive effect of HIV by relative age acceleration after correcting for multiple comparisons. The main effects of HIV still remained and had similar topographies to previous models using chronological age (Figs 2 and 3).
In summary, only total gray matter volume showed a relationship with epigenetic age acceleration, such that greater age acceleration was associated with smaller gray matter volume, specifically in PWH. Whole brain statistics indicated that this pattern did not appear to be localized to a specific region.
Pairwise Comparisons by HAND Status
Post hoc analyses were executed to identify whether effects were driven by participants with HAND. Total brain volume split by HAND showed that both participants with HAND and unimpaired PWH had significantly less total gray matter volume in comparison to controls (HAND: F(1,159) = 9.57; P = 0.002; Unimpaired PWH: F(1,189) = 6.84; P = 0.010). Similarly, both participants with HAND and unimpaired PWH also had significantly greater total CSF volume in comparison to controls (HAND: F(1,158) = 9.54; P = 0.002; Unimpaired PWH: F(1,188) = 5.50; P = 0.020). However, neither HIV group showed significant differences from controls in total WM volume (HAND: F(1,158) = 3.35; P = 0.069; Unimpaired PWH: F(1,188) = 1.10; P = 0.296). When comparing participants with HAND to unimpaired PWH, no significant differences were found in total gray matter (F(1,107) = 0.61; P = 0.436), WM (F(1,106) = 0.81; P = 0.369), or CSF volume (F(1,106) = 0.93; P = 0.336). Finally, the age-by-group interactive term remained nonsignificant for all group comparisons in all tissue types (all P > 0.05).
After splitting the PWH by HAND status, whole-brain cortical thickness ANCOVAs also showed no significant differences between unimpaired PWH and participants with HAND. Comparing controls to the two PWH groups separately (controls vs. unimpaired HIV, and controls vs. HAND) showed similar significant differences to the original model (Fig. 5A,B). Notably, the control versus HAND comparison showed less significant clusters, which may be a reflection of decreased power due to the smaller number of HAND participants. To further investigate this, we calculated the effect size r for each of these comparisons (Fig. 5C,D). This showed that the effect sizes of both comparisons were of similar pattern and magnitude, confirming that the differences in significance were likely due to power differences.
Figure 5 .

Pairwise comparisons by HAND status on cortical thickness. (A) When comparing only unimpaired PWH to uninfected controls, widespread areas showed reductions of cortical thickness related to HIV above and beyond age. (B) When comparing participants with HAND to uninfected controls, fewer regions showed significant reductions in cortical thickness after correction, potentially due to a reduction in statistical power. (C and D) To circumvent power concerns, we computed the effect sizes of each comparison, which revealed a relatively similar pattern and magnitude for the control versus unimpaired PWH (C) and control versus HAND (D) comparisons. No significant clusters were found comparing unimpaired HIV participants to participants with HAND. Color bars display P-values scaled by −log(P), and corrected with a 0.05 FDR and k = 200 threshold. Color bars for the bottom panel display effect size (r-values).
Whole-brain VBM ANCOVAs also showed no significant differences between unimpaired PWH and participants with HAND. However, when comparing controls to the two PWH groups separately, the controls versus HAND comparison had predominantly more regions displaying significantly reduced gray matter compared with the controls versus unimpaired HIV comparison, particularly in the bilateral thalamus and bilateral hippocampus (Fig. 6A,B). Unlike the cortical thickness pairwise comparisons, this is despite the decreased power in the HAND versus control contrast relative to the unimpaired HIV versus control contrast. Further investigating the effect sizes of these comparisons shows that the control versus HAND comparison had relatively large effect sizes in the bilateral thalamus and bilateral hippocampus, while the control versus unimpaired PWH comparison had relatively small effect sizes in these regions.
Figure 6 .

Pairwise comparisons by HAND status on VBM maps. (A) The control versus unimpaired HIV comparison had relatively few clusters showing significant group differences above and beyond the effect of age. (B) By comparison, the control versus HAND comparison revealed many significant clusters independent of age, most notably in the bilateral thalamus, and bilateral hippocampus, despite the reduced power of this contrast. (C and D) Examining the effect sizes of each pairwise comparison revealed that these regions had a relatively large effect size in the control versus HAND comparison (D), and a small effect size in the control versus unimpaired PWH comparison (C). No significant clusters survived multiple comparisons correction when comparing unimpaired HIV participants to participants with HAND. Color bars for the top panel display P-values scaled by −log(P), and corrected with a 0.05 FDR and k = 200 threshold. Color bars for the bottom panel display effect size (r-values).
When examining relative age acceleration split by HAND, there were no significant pairwise effects (P’s > 0.05). Examining the interaction between HIV status and relative age acceleration on gray matter volume broken up by group revealed a significant HIV by relative age acceleration interaction when using the unimpaired HIV group only (F(1,131) = 5.42; P = 0.021). However, when using the HAND group only, there is no significant interaction (F(1,113) = 1.19; P = 0.277). Thus, the interaction in our main model does not appear to be by participants with HAND.
In summary, participants with HAND appeared to drive gray matter differences in the thalamus and hippocampus but did not appear to drive the broad relationship between HIV and reduced total gray matter, nor the relationship between age acceleration and reduced gray matter.
CD4 Nadir
Finally, we performed a post hoc analysis on PWH examining potential effects of CD4 nadir. Total gray matter volume did significantly correlate with CD4 nadir (r(107) = 0.20, P = 0.038); however, this relationship was not significant after accounting for age (t(106) = 0.87, P = 0.386). Neither total WM, total CSF, nor epigenetic age acceleration was found to significantly correlate with CD4 nadir (all P > 0.05).
Discussion
This study used morphometric analyses of structural MRIs and epigenetic biomarkers of accelerated aging to study the differential impact of aging on brain structure in a large sample of PWH. We found independent effects of HIV and aging on total gray matter volume, and widespread reductions in cortical thickness and local gray matter content as identified by voxel based morphometry. Furthermore, when using the epigenetic clock to calculate relative age acceleration, we found that reduced total gray matter volume is related to increased age acceleration. This relationship was specific to the HIV group, suggesting that HIV infection is the process that underlies this relationship. Finally, when taking cognitive status into account, we identified HAND-related gray matter reductions in the thalamus and hippocampus and find that our earlier relationships with epigenetic age did not appear to be driven by those with HAND.
When examining total tissue volumes, gray matter decreased linearly throughout adulthood, WM volume appeared to peak at middle age, and CSF volume sharply increased in older adulthood. These relationships have been established in previous literature (Ge et al. 2002; Taki et al. 2011), which provides an important foundation for our subsequent comparisons. We then found that PWH had reduced total gray matter volume irrespective of age. This finding is consistent with a long list of studies (Paul et al. 2002; Thurnher and Judith Donovan Post 2008; Cole et al. 2018), including a recent meta-analysis (O’connor et al. 2018), and may be reflective of neuronal loss due to HIV (Ghafouri et al. 2006), although other health factors may also be at play (Becker et al. 2012; Lake et al. 2017; Van Zoest et al. 2018). Our study adds to this literature, specifically with a virally suppressed sample spanning almost the full extent of adulthood, and extends previous findings by relating such gray matter loss to epigenetic aging. Interestingly, the gray matter loss identified in our sample did not appear to be driven by participants with HAND. We suspect that this may be due to the small number of HAND participants, particularly the predominant number of HAND participants with asymptomatic neurocognitive impairment (the mildest form). Indeed, recent studies have suggested that HAND prevalence may be overestimated (Su et al. 2015; Wang et al. 2019), and our lack of findings with HAND may be reflective of this. On the other hand, these data clearly show that gray matter reductions are present in PWH, even without clear signs of cognitive impairment. Such atrophy may be directly related to HIV infection or may also be associated with health factors not controlled for in this study.
Our surface-based morphometry results showed a widespread main effect of HIV in cortical thickness above and beyond age. Given the amount of cortex displaying this reduction in cortical thickness, our data suggest that HIV-related reductions in cortical thickness do not follow a specific regional pattern but rather affect the cortical mantle relatively globally. In comparison, our main effect of age also showed a global reduction in cortical thickness but also displayed an especially strong effect in the frontal cortex, which has been shown in previous studies of normative aging (Lemaitre et al. 2012). Examining the effect of HAND showed similar effect sizes for the control versus unimpaired and control versus HAND comparisons, suggesting that our HIV-related reductions in cortical thickness were also not driven by participants with HAND. Therefore, expanding upon our total gray matter findings, this may indicate that cortical thinning can occur without HIV-related cognitive impairment.
Similarly, our voxel-based morphometry results also showed a collection of regions with reduced gray matter related to HIV infection above and beyond age. Notably however, there was a particularly strong difference in the cingulate cortex, bilateral thalamus, and bilateral hippocampus. Upon probing the effect of HAND, significant differences in the thalamus and hippocampus were not present and had low effect sizes in the control versus unimpaired HIV comparison but were present with relatively large effect sizes in the control versus HAND comparison, despite reduced power in the HAND comparison. Therefore, we believe that these HIV-related reductions in gray matter are driven by those with cognitive impairment. This is a particularly interesting finding given other studies examining the relationship between cognitive status and brain structure in PWH (Patel et al. 2002; Ances and Hammoud 2014; Sanford et al. 2019). Specifically, a recent longitudinal study found that thalamus volume is decreased in PWH specifically during the period of time before patients begin cART therapy (Sanford, Ances, et al. 2018a). Therefore, thalamic volume may be affected during primary HIV infection, and the degree to which may be an indicator of future cognitive impairment. Furthermore, the specificity of both thalamus and hippocampal volume decreases relating to cognitive impairment has been seen in a previous study examining PWH and alcohol use disorder (Fama et al. 2014). Relating brain regions from a whole brain parcellation to neuropsychological performance, they found that volumes of both the thalamus and the hippocampus were each unique independent predictors of explicit memory scores. Our findings therefore replicate and extend this finding in a sample of cognitively impaired PWH without alcohol use disorder.
In all of these measures (total gray matter volume, cortical thickness, and VBM), we did not find any HIV by age interactions. This implies that, while HIV-related reductions in gray matter reflect age-related changes, the trajectory of these changes with increasing age does not differ in PWH and ultimately do not appear to be progressively worsening with age in PWH with viral suppression. This is in agreement with recent longitudinal studies showing decreased gray matter volume in PWH at baseline in comparison to uninfected controls, but with a relatively normal trajectory of change in brain structure over the 2 year follow-up (Cole et al. 2018; Sanford, Fellows, et al. 2018b).
When combining the epigenetic data with measures of brain structure, we identified an HIV by age acceleration interaction, such that, specifically for PWH, the greater biological age acceleration a participant displayed, the smaller their total gray matter volume. The lack of such an association between relative age acceleration and gray matter volume in uninfected participants further points toward HIV infection being the underlying link between age acceleration and gray matter reductions. We therefore propose that gray matter changes related to HIV are indeed associated with age acceleration at a molecular level. This is important because epigenetic aging is a peripheral biomarker used to quantify individual-specific levels of age acceleration, beyond their chronological age. Importantly, DNA methylation age of brain tissue has been shown to be highly concordant with that of peripheral blood (Horvath et al. 2012; Horvath 2013). Brain-related age acceleration had largely been studied using only chronological age, and biological age acceleration has been showed to be associated with age-related mortality (Marioni et al. 2015). Therefore, our study not only illuminates the nature of HIV-related brain atrophy but also further validates epigenetic accelerated aging as a relevant biomarker in HIV. Mechanistically, this relationship may also suggest that epigenetic change could be a primary pathway by which gray matter atrophy occurs and/or persists in PWH. That is, viral reservoirs in the CNS and throughout the body may lead to inflammation, cellular damage, and ultimately epigenetic change that reflects accelerated aging, and this may drive brain atrophy related to HIV. However, further study is needed to examine such causality. With regard to HAND, this relationship persisted even in those without HAND. Impairment may therefore be more closely related to atrophy in specific regions or may be more tied to neural function rather than structure more broadly.
While these findings replicate previous gray matter and epigenetic changes that occur with HIV infection, the link between these two metrics is highly novel and needs to be replicated in other large-cohort studies of HIV. Furthermore, this study’s limitations include the fact that PWH were specifically recruited because they had well-managed HIV-infection. That is, all PWH were receiving effective combination antiretroviral medications, had undetectable plasma levels of HIV, and had no other substantial neurologic/psychiatric comorbidities including substance use disorders. Therefore, these data may not generalize well to a broader population of PWH that may have a variety of other complications. On the other hand, we did not examine common health comorbidities such as obesity, hypertension, or diabetes, nor did this study assess the effects of socioeconomic factors or health habits. Further study is needed to examine the impact of these common other health factors on our findings.
In conclusion, our study found broad decreases in gray matter volumes and cortical thickness, independently related to HIV and aging. Biomarkers of epigenetic age acceleration revealed that PWH with increased age acceleration had an associated decrease in gray matter volume, and this relationship was not seen in uninfected controls. We also identified age-independent HAND-related reductions in gray matter, specifically in the thalamus and hippocampus. These findings ultimately link molecular epigenetic age acceleration to large-scale aberrations in brain structure in PWH, which provides additional evidence supporting the epigenetic clock as a relevant biomarker for HIV-related age acceleration, and may also begin to reveal the underlying mechanisms of accelerated aging in the HIV-infected brain.
Contributor Information
Brandon J Lew, Institute for Human Neuroscience, Boys Town National Research Hospital, Omaha, NE 68010, USA; Department of Neurological Sciences, University of Nebraska Medical Center (UNMC), Omaha, NE 68198-8440, USA.
Mikki D Schantell, Institute for Human Neuroscience, Boys Town National Research Hospital, Omaha, NE 68010, USA.
Jennifer O’Neill, Department of Internal Medicine, Division of Infectious Diseases, UNMC, Omaha, NE 68198-8440, USA.
Brenda Morsey, Department of Neurological Sciences, University of Nebraska Medical Center (UNMC), Omaha, NE 68198-8440, USA.
Tina Wang, Department of Medicine, University of California San Diego, La Jolla, CA 92093, USA.
Trey Ideker, Department of Medicine, University of California San Diego, La Jolla, CA 92093, USA.
Susan Swindells, Department of Internal Medicine, Division of Infectious Diseases, UNMC, Omaha, NE 68198-8440, USA.
Howard S Fox, Department of Neurological Sciences, University of Nebraska Medical Center (UNMC), Omaha, NE 68198-8440, USA.
Tony W Wilson, Institute for Human Neuroscience, Boys Town National Research Hospital, Omaha, NE 68010, USA; Department of Neurological Sciences, University of Nebraska Medical Center (UNMC), Omaha, NE 68198-8440, USA.
Authors’ Roles
B.J.L.: drafting a significant portion of the manuscript and figures, acquisition and analysis of data, design of the study; M.S.: acquisition and analysis of data; J.O.: acquisition and analysis of data; B.M.: acquisition and analysis of data; T.W.: acquisition and analysis of data; T.I.: acquisition and analysis of data, design of the study; S.S.: conception and design of the study; H.S.F.: conception and design of the study; T.W.W.: conception and design of the study, drafting a significant portion of the manuscript.
Funding
National Institutes of Health (NIH; MH103220, MH116782, MH062261, MH115747, DA041917, DA048713, AG055332); National Science Foundation of the USA (NSF; 1539067).
Notes
We thank the participants and all the study staff. We also acknowledge the enormous contribution from Kevin R. Robertson, PhD, professor of neurology and director of the AIDS Neurological Center at the University of North Carolina at Chapel Hill. Dr Robertson designed the neuropsychological testing battery and analyzed the data, and sadly died during the conduct of the study. T.I. is a co-founder of Data4Cure, Inc. and has an equity interest. T.I. has an equity interest in Ideaya BioSciences, Inc. The terms of this arrangement have been reviewed and approved by the University of California, San Diego in accordance with its conflict of interest policies.
Conflict of Interest: Dr Swindells reports research grants to her institution from ViiV Healthcare.
References
- Ances BM, Hammoud DA. 2014. Neuroimaging of HIV-associated neurocognitive disorders (HAND). Curr Opin HIV AIDS. 9:545–551. [DOI] [PMC free article] [PubMed] [Google Scholar]
- Ances BM, Ortega M, Vaida F, Heaps J, Paul R. 2012. Independent effects of HIV, aging, and HAART on brain volumetric measures: JAIDS. J Acquir Immune Defic Syndr. 59:469–477. [DOI] [PMC free article] [PubMed] [Google Scholar]
- Ando M, Tsuchiya K, Nitta K. 2012. How to manage HIV-infected patients with chronic kidney disease in the HAART era. Clin Exp Nephrol. 16:363–372. [DOI] [PubMed] [Google Scholar]
- Antinori A, Arendt G, Becker J, Brew B, Byrd D, Cherner M, Clifford D, Cinque P, Epstein LG, Goodkin K. 2007. Updated research nosology for HIV-associated neurocognitive disorders. Neurology. 69:1789–1799. [DOI] [PMC free article] [PubMed] [Google Scholar]
- Aryee MJ, Jaffe AE, Corrada-Bravo H, Ladd-Acosta C, Feinberg AP, Hansen KD, Irizarry RA. 2014. Minfi: a flexible and comprehensive bioconductor package for the analysis of Infinium DNA methylation microarrays. Bioinformatics. 30:1363–1369. [DOI] [PMC free article] [PubMed] [Google Scholar]
- Ashburner J, Friston KJ. 2005. Unified segmentation. Neuroimage. 26:839–851. [DOI] [PubMed] [Google Scholar]
- Becker JT, Maruca V, Kingsley LA, Sanders JM, Alger JR, Barker PB, Goodkin K, Martin E, Miller EN, Ragin Aet al. 2012. Factors affecting brain structure in men with HIV disease in the post-HAART era. Neuroradiology. 54:113–121. [DOI] [PMC free article] [PubMed] [Google Scholar]
- Cardenas V, Meyerhoff D, Studholme C, Kornak J, Rothlind J, Lampiris H, Neuhaus J, Grant R, Chao L, Truran Det al. 2009. Evidence for ongoing brain injury in human immunodeficiency virus–positive patients treated with antiretroviral therapy. J Neurovirol. 15:324–333. [DOI] [PMC free article] [PubMed] [Google Scholar]
- Caruana G, Vidili G, Serra P, Bagella P, Spanu A, Fiore V, Calvisi D, Manetti R, Rocchitta G, Nuvoli S. 2017. The burden of HIV-associated neurocognitive disorder (HAND) in post-HAART era: a multidisciplinary review of the literature. Eur Rev Med Pharmacol Sci. 21:2290–2301. [PubMed] [Google Scholar]
- Chang L, Andres M, Sadino J, Jiang CS, Nakama H, Miller E, Ernst T. 2011. Impact of apolipoprotein E ε4 and HIV on cognition and brain atrophy: antagonistic pleiotropy and premature brain aging. Neuroimage. 58:1017–1027. [DOI] [PMC free article] [PubMed] [Google Scholar]
- Cole JH, MWA C, Underwood J, De Francesco D, van Zoest, FWNM W, HJMM M, Leech R, Geurtsen GJ, Portegies Pet al. 2018. No evidence for accelerated aging-related brain pathology in treated human immunodeficiency virus: longitudinal neuroimaging results from the comorbidity in relation to AIDS (COBRA) project. Clin Infect Dis. 66:1899–1909. [DOI] [PubMed] [Google Scholar]
- Dahnke R, Yotter RA, Gaser C. 2013. Cortical thickness and central surface estimation. Neuroimage. 65:336–348. [DOI] [PubMed] [Google Scholar]
- Fama R, Rosenbloom MJ, Sassoon SA, Rohlfing T, Pfefferbaum A, Sullivan EV. 2014. Thalamic volume deficit contributes to procedural and explicit memory impairment in HIV infection with primary alcoholism comorbidity. Brain Imaging Behav. 8:611–620. [DOI] [PMC free article] [PubMed] [Google Scholar]
- Gaser C, Dahnke R. 2016. CAT-a computational anatomy toolbox for the analysis of structural MRI data. HBM. 2016:336–348. [DOI] [PMC free article] [PubMed] [Google Scholar]
- Ge Y, Grossman RI, Babb JS, Rabin ML, Mannon LJ, Kolson DL. 2002. Age-related total gray matter and white matter changes in normal adult brain. Part I: volumetric MR imaging analysis. Am J Neuroradiol. 23:1327–1333. [PMC free article] [PubMed] [Google Scholar]
- Ghafouri M, Amini S, Khalili K, Sawaya BE. 2006. HIV-1 associated dementia: symptoms and causes. Retrovirology. 3:28. [DOI] [PMC free article] [PubMed] [Google Scholar]
- González-Scarano F, Martín-García J. 2005. The neuropathogenesis of AIDS. Nat Rev Immunol. 5:69–81. [DOI] [PubMed] [Google Scholar]
- Gross AM, Jaeger PA, Kreisberg JF, Licon K, Jepsen KL, Khosroheidari M, Morsey BM, Swindells S, Shen H, Ng CT. 2016. Methylome-wide analysis of chronic HIV infection reveals five-year increase in biological age and epigenetic targeting of HLA. Mol Cell. 62:157–168. [DOI] [PMC free article] [PubMed] [Google Scholar]
- Hannum G, Guinney J, Zhao L, Zhang L, Hughes G, Sadda S, Klotzle B, Bibikova M, Fan J-B, Gao Y. 2013. Genome-wide methylation profiles reveal quantitative views of human aging rates. Mol Cell. 49:359–367. [DOI] [PMC free article] [PubMed] [Google Scholar]
- Harris NS, Johnson AS, Huang Y-LA, Kern D, Fulton P, Smith DK, Valleroy LA, Hall HI. 2019. Vital signs: status of human immunodeficiency virus testing, viral suppression, and HIV preexposure prophylaxis—United States, 2013–2018. Morb Mortal Wkly Rep. 68:1117. [DOI] [PMC free article] [PubMed] [Google Scholar]
- Heaton RK, Clifford DB, Franklin DR, Woods SP, Ake C, Vaida F, Ellis RJ, Letendre SL, Marcotte TD, Atkinson JHet al. 2010. HIV-associated neurocognitive disorders persist in the era of potent antiretroviral therapy: CHARTER study. Neurology. 75:2087–2096. [DOI] [PMC free article] [PubMed] [Google Scholar]
- Holt JL, Kraft-Terry SD, Chang L. 2012. Neuroimaging studies of the aging HIV-1-infected brain. J Neurovirol. 18:291–302. [DOI] [PMC free article] [PubMed] [Google Scholar]
- Horvath S. 2013. DNA methylation age of human tissues and cell types. Genome Biol. 14:3156. [DOI] [PMC free article] [PubMed] [Google Scholar]
- Horvath S, Levine AJ. 2015. HIV-1 infection accelerates age according to the epigenetic clock. J Infect Dis. 212:1563–1573. [DOI] [PMC free article] [PubMed] [Google Scholar]
- Horvath S, Stein DJ, Phillips N, Heany SJ, Kobor MS, Lin DT, Myer L, Zar HJ, Levine AJ, Hoare J. 2018. Perinatally acquired HIV infection accelerates epigenetic aging in south African adolescents. AIDS Lond Engl. 32:1465. [DOI] [PMC free article] [PubMed] [Google Scholar]
- Horvath S, Zhang Y, Langfelder P, Kahn RS, Boks MP, van Eijk K, van den Berg LH, Ophoff RA. 2012. Aging effects on DNA methylation modules in human brain and blood tissue. Genome Biol. 13:R97. [DOI] [PMC free article] [PubMed] [Google Scholar]
- Houseman EA, Accomando WP, Koestler DC, Christensen BC, Marsit CJ, Nelson HH, Wiencke JK, Kelsey KT. 2012. DNA methylation arrays as surrogate measures of cell mixture distribution. BMC Bioinformatics. 13:86. [DOI] [PMC free article] [PubMed] [Google Scholar]
- Joshi D, O’Grady J, Dieterich D, Gazzard B, Agarwal K. 2011. Increasing burden of liver disease in patients with HIV infection. The Lancet. 377:1198–1209. [DOI] [PubMed] [Google Scholar]
- Kaul M, Zheng J, Okamoto S, Gendelman H, Lipton S. 2005. HIV-1 infection and AIDS: consequences for the central nervous system. Cell Death Differ. 12:878–892. [DOI] [PubMed] [Google Scholar]
- Lake JE, Popov M, Post WS, Palella FJ, Sacktor N, Miller EN, Brown TT, Becker JT. 2017. Visceral fat is associated with brain structure independent of human immunodeficiency virus infection status. J Neurovirol. 23:385–393. [DOI] [PMC free article] [PubMed] [Google Scholar]
- Lemaitre H, Goldman AL, Sambataro F, Verchinski BA, Meyer-Lindenberg A, Weinberger DR, Mattay VS. 2012. Normal age-related brain morphometric changes: nonuniformity across cortical thickness, surface area and gray matter volume? Neurobiol Aging. 33:617.e1–617.e9. [DOI] [PMC free article] [PubMed] [Google Scholar]
- Levine AJ, Quach A, Moore DJ, Achim CL, Soontornniyomkij V, Masliah E, Singer EJ, Gelman B, Nemanim N, Horvath S. 2016. Accelerated epigenetic aging in brain is associated with pre-mortem HIV-associated neurocognitive disorders. J Neurovirol. 22:366–375. [DOI] [PMC free article] [PubMed] [Google Scholar]
- Lew BJ, McDermott TJ, Wiesman AI, O’Neill J, Mills MS, Robertson KR, Fox HS, Swindells S, Wilson TW. 2018. Neural dynamics of selective attention deficits in HIV-associated neurocognitive disorder. Neurology. 91:e1860–e1869. [DOI] [PMC free article] [PubMed] [Google Scholar]
- Lew BJ, O’Neill J, Rezich MT, May PE, Fox HS, Swindells S, Wilson TW. 2020. Interactive effects of HIV and aging on neural oscillations: independence from neuropsychological performance. Brain Commun. 2(1):fcaa015. [DOI] [PMC free article] [PubMed] [Google Scholar]
- Manjón JV, Coupé P, Martí-Bonmatí L, Collins DL, Robles M. 2010. Adaptive non-local means denoising of MR images with spatially varying noise levels: spatially adaptive nonlocal denoising. J Magn Reson Imaging. 31:192–203. [DOI] [PubMed] [Google Scholar]
- Marioni RE, Shah S, McRae AF, Chen BH, Colicino E, Harris SE, Gibson J, Henders AK, Redmond P, Cox SR. 2015. DNA methylation age of blood predicts all-cause mortality in later life. Genome Biol. 16:25. [DOI] [PMC free article] [PubMed] [Google Scholar]
- Martin-Iguacel R, Llibre JM, Friis-Moller N. 2015. Risk of cardiovascular disease in an aging HIV population: where are we now? Curr HIV/AIDS Rep. 12:375–387. [DOI] [PubMed] [Google Scholar]
- O’connor E, Zeffiro TA, Zeffiro TA. 2018. Brain structural changes following HIV infection: meta-analysis. Am J Neuroradiol. 39:54–62. [DOI] [PMC free article] [PubMed] [Google Scholar]
- Patel SH, Kolson DL, Glosser G, Matozzo I, Ge Y, Babb JS, Mannon LJ, Grossman RI. 2002. Correlation between percentage of brain parenchymal volume and neurocognitive performance in HIV-infected patients. Am J Neuroradiol. 23:543–549. [PMC free article] [PubMed] [Google Scholar]
- Pathai S, Bajillan H, Landay AL, High KP. 2014. Is HIV a model of accelerated or accentuated aging? J Gerontol A Biol Sci Med Sci. 69:833–842. [DOI] [PMC free article] [PubMed] [Google Scholar]
- Paul R, Cohen R, Navia B, Tashima K. 2002. Relationships between cognition and structural neuroimaging findings in adults with human immunodeficiency virus type-1. Neurosci Biobehav Rev. 26:353–359. [DOI] [PubMed] [Google Scholar]
- Pfefferbaum A, Rosenbloom MJ, Sassoon SA, Kemper CA, Deresinski S, Rohlfing T, Sullivan EV. 2012. Regional brain structural dysmorphology in human immunodeficiency virus infection: effects of acquired immune deficiency syndrome, alcoholism. and Age Biol Psychiatry. 72:361–370. [DOI] [PMC free article] [PubMed] [Google Scholar]
- Rajapakse JC, Giedd JN, Rapoport JL. 1997. Statistical approach to segmentation of single-channel cerebral MR images. IEEE Trans Med Imaging. 16:176–186. [DOI] [PubMed] [Google Scholar]
- Rasmussen LD, May MT, Kronborg G, Larsen CS, Pedersen C, Gerstoft J, Obel N. 2015. Time trends for risk of severe age-related diseases in individuals with and without HIV infection in Denmark: a nationwide population-based cohort study. Lancet HIV. 2:e288–e298. [DOI] [PubMed] [Google Scholar]
- Raz N, Lindenberger U, Rodrigue KM, Kennedy KM, Head D, Williamson A, Dahle C, Gerstorf D, Acker JD. 2005. Regional brain changes in aging healthy adults: general trends, individual differences and modifiers. Cereb Cortex. 15:1676–1689. [DOI] [PubMed] [Google Scholar]
- Riboli E, Hunt KJ, Slimani N, Ferrari P, Norat T, Fahey M, Charrondiere UR, Hemon B, Casagrande C, Vignat J. 2002. European prospective investigation into cancer and nutrition (EPIC): study populations and data collection. Public Health Nutr. 5:1113–1124. [DOI] [PubMed] [Google Scholar]
- Samji H, Cescon A, Hogg RS, Modur SP, Althoff KN, Buchacz K, Burchell AN, Cohen M, Gebo KA, Gill MJet al. 2013. Closing the gap: increases in life expectancy among treated HIV-positive individuals in the United States and Canada. PLoS One. 8:e81355. [DOI] [PMC free article] [PubMed] [Google Scholar]
- Sanford R, Ances BM, Meyerhoff DJ, Price RW, Fuchs D, Zetterberg H, Spudich S, Collins DL. 2018a. Longitudinal trajectories of brain volume and cortical thickness in treated and untreated primary human immunodeficiency virus infection. Clin Infect Dis. 67:1697–1704. [DOI] [PMC free article] [PubMed] [Google Scholar]
- Sanford R, Fellows LK, Ances BM, Collins DL. 2018b. Association of Brain Structure Changes and Cognitive Function with combination antiretroviral therapy in HIV-positive individuals. JAMA Neurol. 75:72. [DOI] [PMC free article] [PubMed] [Google Scholar]
- Sanford R, Strain J, Dadar M, Maranzano J, Bonnet A, Mayo NE, Scott SC, Fellows LK, Ances BM, Collins DL. 2019. HIV infection and cerebral small vessel disease are independently associated with brain atrophy and cognitive impairment. AIDS. 33:1197–1205. [DOI] [PMC free article] [PubMed] [Google Scholar]
- Su T, Schouten J, Geurtsen GJ, Wit FW, Stolte IG, Prins M, Portegies P, Caan MW, Reiss P, Majoie CB. 2015. Multivariate normative comparison, a novel method for more reliably detecting cognitive impairment in HIV infection. AIDS. 29:547–557. [DOI] [PubMed] [Google Scholar]
- Taki Y, Thyreau B, Kinomura S, Sato K, Goto R, Kawashima R, Fukuda H. 2011. Correlations among brain gray matter volumes, age, gender, and hemisphere in healthy individuals. PLoS One. 6(7):e22734. [DOI] [PMC free article] [PubMed] [Google Scholar]
- Thurnher MM, Judith Donovan Post M. 2008. The uses of structural neuroimaging in the brain in HIV-1-infected patients. In: Karl Goodkin, Paul Shapshak, Ashok Verma, editors. The spectrum of neuro-AIDS disorders: pathophysiology, diagnosis, and treatment. Hoboken, New Jersey: Wiley Online Library. pp. 245–272. [Google Scholar]
- Tohka J, Zijdenbos A, Evans A. 2004. Fast and robust parameter estimation for statistical partial volume models in brain MRI. Neuroimage. 23:84–97. [DOI] [PubMed] [Google Scholar]
- Towgood KJ, Pitkanen M, Kulasegaram R, Fradera A, Kumar A, Soni S, Sibtain NA, Reed L, Bradbeer C, Barker GJet al. 2012. Mapping the brain in younger and older asymptomatic HIV-1 men: frontal volume changes in the absence of other cortical or diffusion tensor abnormalities. Cortex. 48:230–241. [DOI] [PubMed] [Google Scholar]
- Van Zoest RA, Underwood J, De Francesco D, Sabin CA, Cole JH, Wit FW, Caan MW, Kootstra NA, Fuchs D, Zetterberg H. 2018. Structural brain abnormalities in successfully treated HIV infection: associations with disease and cerebrospinal fluid biomarkers. J Infect Dis. 217:69–81. [DOI] [PubMed] [Google Scholar]
- Wang Z, Molsberry SA, Cheng Y, Kingsley L, Levine AJ, Martin E, Munro CA, Ragin A, Rubin LH, Sacktor N. 2019. Cross-sectional analysis of cognitive function using multivariate normative comparisons in men with HIV disease. AIDS. 33:2115–2124. [DOI] [PMC free article] [PubMed] [Google Scholar]
- Wing EJ. 2016. HIV and aging. Int J Infect Dis. 53:61–68. [DOI] [PubMed] [Google Scholar]
- Yotter RA, Dahnke R, Thompson PM, Gaser C. 2011a. Topological correction of brain surface meshes using spherical harmonics. Hum Brain Mapp. 32:1109–1124. [DOI] [PMC free article] [PubMed] [Google Scholar]
- Yotter RA, Thompson PM, Gaser C. 2011b. Algorithms to improve the reparameterization of spherical mappings of brain surface meshes. J Neuroimaging. 21:e134–e147. [DOI] [PubMed] [Google Scholar]