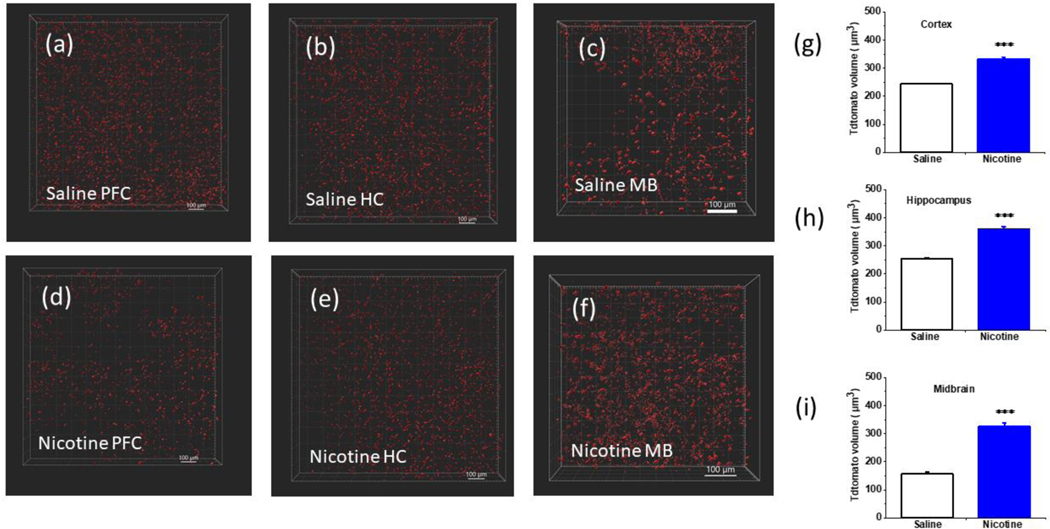
FIGURE 8.
Comparison of nicotine induced morphological changes in astrocytes in vivo. (a)-(f) Representative 3-dimensional reconstructions of confocal images of cleared tissue from saline and nicotine treated mice at the prefrontal cortex (PFC), the CA1 of the hippocampus (HC) and the substantia nigra (SNc) of the midbrain (scalebar = 100 μm). (g), (h), and (i) Comparison of the average volume of cortical astrocytes from the prefrontal cortex, hippocampal astrocytes from CA1, and midbrain astrocytes from the substantia nigra (SNc) for saline and nicotine (2 mg/Kg/hour) treated animals (AZLET 1002 osmotic minipumps, 12 days) calculated from Imaris (Bitplane) surface tool. Non astrocytic features were removed during the analysis by applying sphericity threshold of 0.3 – 1 and area threshold 50 – 1000 μm2. Student’s t-test for (n = 6 animals, ***p < 0.001). Data are expressed in the form of mean ± SEM. Bar diagrams of territorial area measurement are shown in the Supplementary Figure 8 (b), (c) and (d).

